
In the last Premium Update I indicated that although the week before had been impressive in terms of precious metals' performance, there was no decisive breakout and that caution is necessary. It turned out that we have indeed bounced after touching the resistance line, and have been declining since that happened.
The correlations that I mentioned last week have changed, but the changes are not very significant, and are visible in the short term only. I will get back to that topic in the following part of the essay. This week I will begin by analyzing the general stock market. Charts are courtesy of stockcharts.com.
The General Stock Market
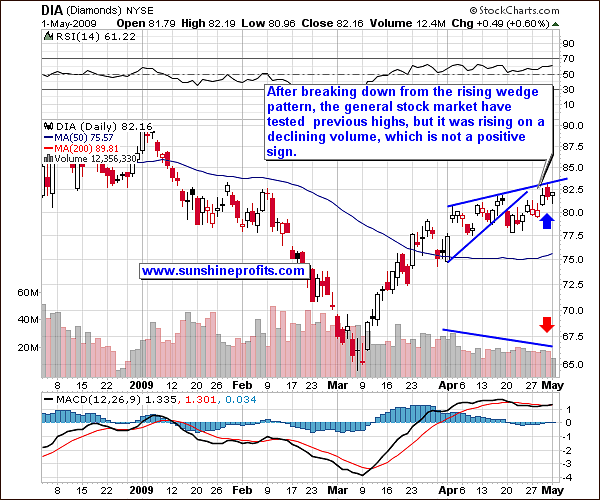
This chart is once again rather bearish, as the value of DJIA rose on a declining volume. The previous high has been tested (but not broken) in the last few days. What is noteworthy here is that the recent top has been tested on an intraday basis two times (on Wednesday and Thursday), but each time index closed below it. This serves as an indication that there are many investors eager to sell at these levels and that the 8200-8300 level is indeed a strong resistance.
The same can be said about the broad market index - S&P 500, here represented by the SPY ETF.
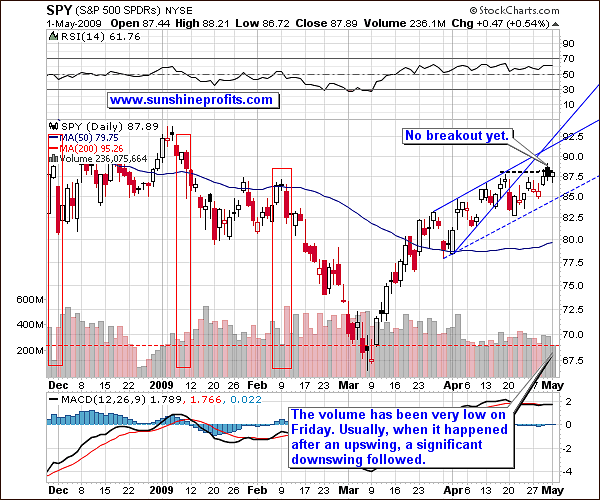
This analysis of volume on the SPY ETF provides us with additional details. Not only did S&P fail to break its recent high, but the small upswing on Friday took place on a very small volume. This alone signals lower values ahead, especially when we take the previous months into account. Several times when we had similar volume on the SPY ETF after a rally, it meant lower prices ahead. It is likely (not guaranteed) that the history will repeat itself.
On the other hand, like I mentioned last week, a breakout on a strong volume above the resistance line (for DJIA it's currently at 8300 level) would most likely mean higher prices in the near future. As you may read here:
Results of the "stress tests" conducted on the nation's 19 biggest financial institutions will be released late Thursday afternoon and include information on both the individual banks as well as aggregate data, CNBC has learned.
(...)
Since then, the market appetite for the results has reached a fever pitch, forcing the Treasury Department to rethink its plan to keep detailed results of individual banks private. The source told Reuters that officials are well aware of the market's sensitivity to the information, evidenced by the punishment some bank stocks have endured from leaked reports of the results and outside analysts' versions of the tests.
"Everyone's being very sensitive," the source said.
The government gave their preliminary results to the banks a week ago, and regulators are now negotiating the results and any capital recovery plans with the banking companies.
In other words The Powers That Be have several more days to twist the data so that it looks positive and to make appropriate comments justifying the twists. I'm not making any accusations here, but I would not be surprised to read that the banking sector is now one of the soundest sectors (yeah, right...) either because the test results are very positive or that it were somewhat negative, but now the situation is under control as banks are about to get a additional trillions of dollars at a ridiculously low interest rate. I'm exaggerating here, but I expect Thursday's statement to be optimistic.
The key factor here is how market will perceive this report. If investors believe that the positive report is honest, and it would come to them as a surprise, then markets will rally. Another thing worth mentioning is that banks are already familiar with the results of the test. It will be interesting to watch volume on the banking stocks and options in the coming week and see if there will be any big bets. I will be monitoring markets and report to you if I see any significant clues.
USD
As far as the dollar market is concerned, there is not much to report since the previous week.
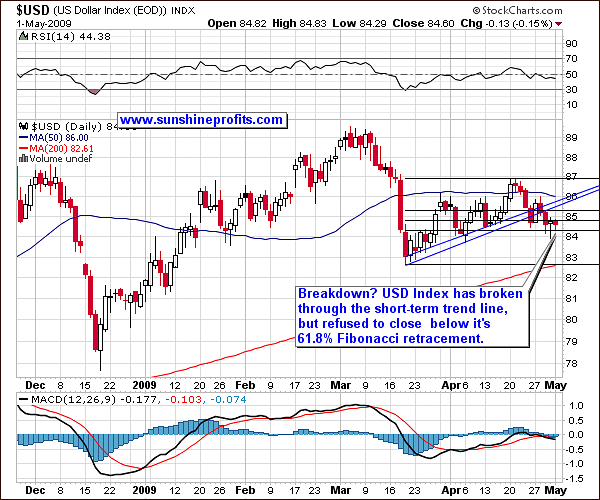
As I wrote in the previous update, the breakdown in the USD Index is visible only if one takes a look at the short-term chart. The long-term trend line has not been touched yet.
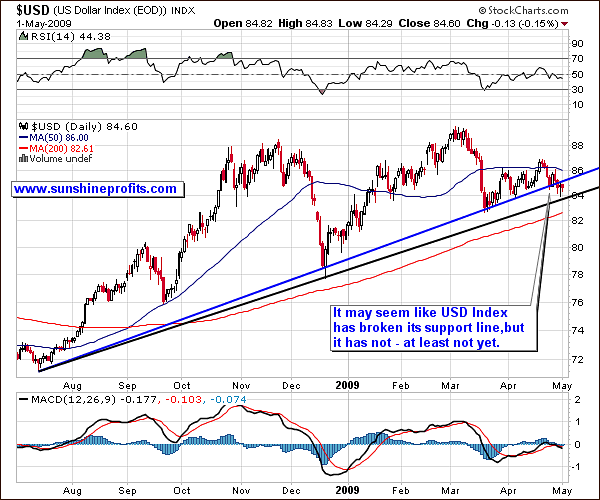
The above chart has barely any changes from the previous week, as the situation on the USD market, has also not changed from the long-term point of view. The final support line, created by using the intraday lows has not been broken - in fact it wasn't even touched. Keeping in mind that previous week I mentioned that USD Index is once again moving more or less in tune with gold but with the opposite direction (they are negatively correlated), I view the situation on the dollar market as bearish for gold in the near term - at least as for now.
Correlations
Although this has not been the case during the last few days where gold declined despite the decline in the value of USD Index, the correlation between precious metals and dollar is now rather significantly negative in the short term (based on the previous 30 trading days).
Please take a look at the up-to-date version of our correlation table.
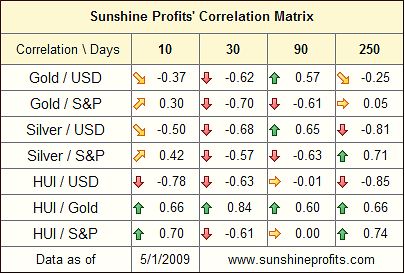
What is interesting here is that in the short term (30 trading days of data) gold and silver are negatively correlated with both: USD Index and the general stock market. Since charts are in my view bullish for USD (we're talking about the short term here) and bearish for the general stock market, it seems that gold will either trade sideways or invalidate one of the aforementioned correlations.
The reason that I included the 10-day column in the above table (though these numbers are not statistically significant) is that it gives us at least a "guesstimate" of how the correlations might change in the future. For now, it is likely that gold/silver will trade in the opposite direction to the USD Index. The same cannot be said about gold/silver and the S&P, as the correlation numbers are positive for both metals. This means that if situation plays out as expected for both markets - USD will rise and S&P will fall - then the precious metals may also decline.
Please note that silver is mostly more positively correlated with the general stock market (with a small exception) than gold is. We can explain that tendency by the fact that silver is much more of an industrial metal and is not yet perceived (!) as a hedge against financial/economic turmoil, like gold is.
Precious Metals
As far as gold is concerned given the coming release of the bank report - it could influence gold positively or negatively, depending on the details and on market perception at that particular moment. If the report is positive, then gold will lose its shine in the short-term, as those who bought precious metals as a hedge against a financial/banking crisis, will dump their holdings. If the report mentions printing much more money, it might as well serve as a positive factor in the short term. This does not change my view on what could happen next on the precious metals market (and with what probability), but these comments could prove helpful in putting the coming report into proper perspective.
As far as the technical picture is concerned, there are no significant changes since the previous Premium Update was posted.
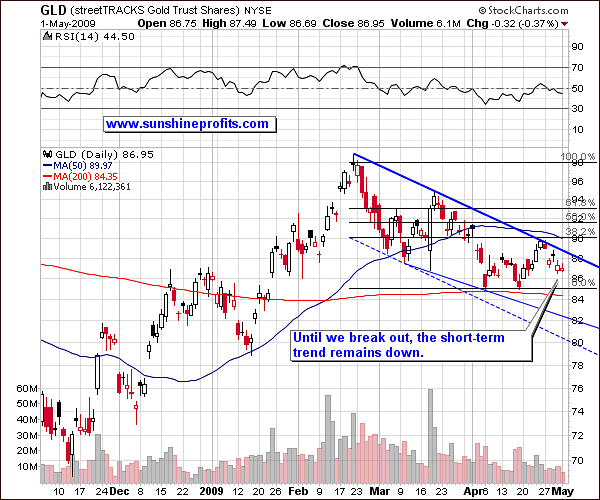
As mentioned on the chart, the short term trade remains down. As far as long term is concerned, I have created another chart that emphasizes the difference between the long- and short-term view on the gold market.
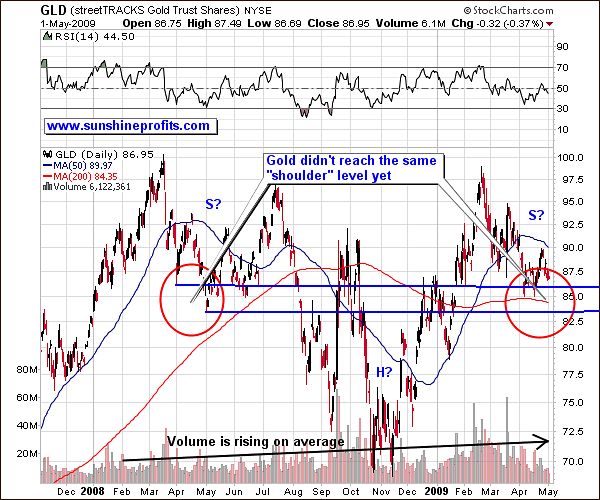
Generally, the long-term situation on the gold market is similar to the reverse head-and-shoulders pattern, but as far as details are concerned, the volume does not confirm the price action, so I did not write about this formation in the first place. This makes the whole formation much less reliable. This means that I would not use it as a primary tool in determining the direction in which the PM market will go next, but it can still be used as a confirmation. The implications of the above chart analysis (although not completely correct from a "technical" point of view) are: purchase long-term holdings, wait for additional signals before entering short-term speculative positions, as we didn't reach the level of previous "shoulder" yet. This is exactly what I suggested after using different techniques in the past.
The situation on the silver market is very similar to the one on the gold market, and there are no additional factors to report on this week.
Moving on to the precious metals stocks, the chart does not look bullish from my point of view.
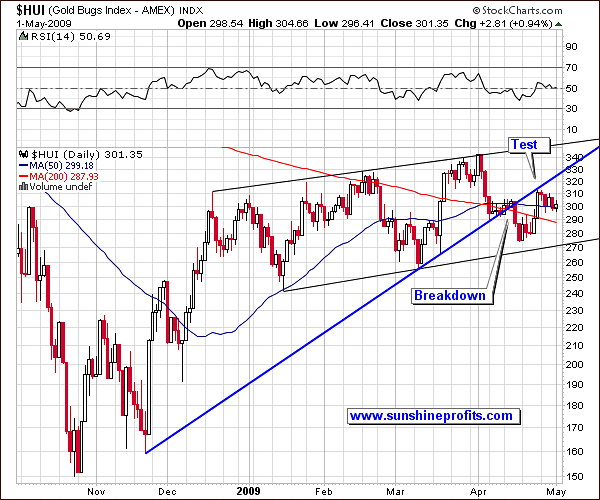
We have broken down through the rising trend line and have verified this line as a resistance. This is definitely not a bullish sign in the short- and medium-term. As far as the latter is concerned, we will know more after (and if) we go lower. Much depends on what will happen on other markets and also on the way the volume will shape in the following days. Should the precious metals stocks decline on a strong volume, I would consider shorting this sector in the short term. As always - I will keep you updated.
Summary
I realize that Day-Traders are discouraged by the fact that I did not suggest any speculative positions in the precious metals sector in the recent weeks, but please note that I cannot recommend transactions that I personally don't feel comfortable with. I understand that you may prefer to initiate and close a trade more often than I do, and that's why I strive to provide you with detailed analysis. This way, you can apply it to your own trades without waiting for my final signal. This is also the main idea behind indicators from the Charts section and behind most of our tools. I plan to add new features to these sections in the not-too-distant future.
As far as long-term is concerned - it's been a month now since I published a list of the best performing gold and silver juniors that were most likely to outperform in the future. As stated in the Key Principles section, the list of top juniors will be updated approximately every 4 weeks, so this is the Update that should contain the revised version of the list.
The tables below feature our favorite junior stocks at the moment of writing these words. For more information on how you can use these lists please refer to the Key Principles section, especially to the part dedicated to juniors
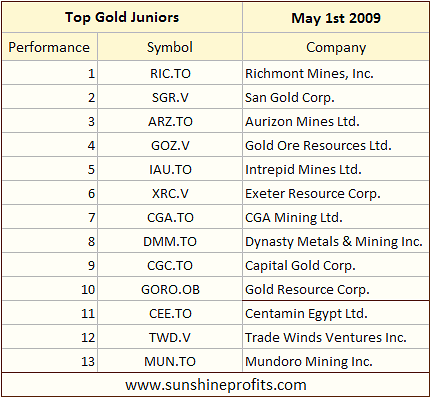
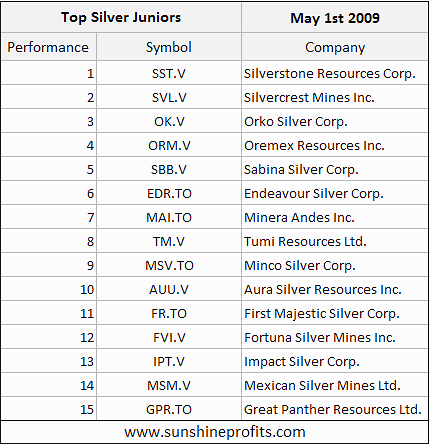
As far as juniors are concerned, our Junior Long-term Indicator has just suggested selling juniors and switching to bigger companies with a part of one's long term capital - naturally if one is interested in the junior sector at all and if one wants to trade the junior/senior ratio. Given the fact that we have just featured a revised list of top juniors, it might be a good idea to drop juniors that are underperforming and have been removed from our list, or if you own juniors that are on our list only, to sell those that are lower on the list.
Please note that all gold juniors that were on our list in March are still on it, only but on different place. This does NOT imply that these are the only juniors that we took into account.
I realize that this short summary might be perplexing for our new Members. Again, should that be the case, please go to the Key Principles section where we described details of our approach regarding long-term investments.
Other information
This week we have implemented two new features on our website: the RSS feed mechanism and the Share/Save button.
The RSS mechanism enables you to stay up-to-date with virtually anything that we update on our website more or less regularly. We provide five separate feeds and you can sign up for as many as you would like to. The feeds are created for the following sections:
- Premium Updates
- Free commentary
- Research
- Editor answers
- Charts
Generally, what we post in the Free commentary and Research sections is based on what we write in the Premium Updates sections. Therefore, for Premium Service Members, I would recommend signing up for feeds from the following sections: Premium Updates, Editor answers and optionally Charts. Naturally, you will still receive e-mails from us in the usual way (with Market Alerts or notifications about new Premium Updates).
In order to sign up for our RSS feeds, please click the following button
You may also find it at the right side of the page just below the "Tell your friends" button.
The second feature that I mentioned above is the Share/Save button that is visible on the bottom of most pages. This button is a super-easy and convenient way to share your favorite essays, answers or even our homepage with your friends, using e-mail, Twitter, Facebook, Digg, StumbleUpon and many other services. If you like our service, but didn't tell your friends about it yet, as it was too inconvenient - this button is a really quick way to do it. We suggest checking it out - it will only take a minute, and if your friends tell us your username when filling the registration form and become Members of the Premium Service, you'll get additional 3 weeks of access free of charge per each new Member that you recommended us to.
This completes this week's Premium Update. Thank you for using the Premium Service. Have a great weekend!
Sincerely,
Przemyslaw Radomski

