
Before I proceed with presenting my thoughts on the current market situation, I would like to address an issue that several Subscribers have asked me about. This may prove valuable information also to other Investors / Speculators.
I have received several e-mails in which I'm asked about the possibility of a sharp decline in the PM sector, during which gold would drop to the $650 level. As I was informed, there are analysts (mainly followers of the Elliott Wave Theory), who believe that a quick plunge to $650 is rather imminent. This makes many investors completely stay out of the precious metals market until the low of $650 is reached.
While I can't completely rule out the scenario in which gold would decline to $650 level on a very temporary (!) basis, I don't see that as very probable. The tools and techniques that I have personally found to be reliable currently don't point to this level.
The Elliott Wave Theory is a part of the technical analysis, and as such it is more of an art than of a science. Therefore, it is impossible to prove that it is either good or bad for any market. I have personally not found it particularly useful. When gold broke through the $400 level I remember many Elliott Wave analysts writing about imminent correction to the $200 area, which never happened. I understand that these wave patterns often do occur, but I found them easy to spot and reliable only in hindsight. Of course EW analysts have more experience in reading these waves and I don't claim to be an expert on that field.
Either way, even if we were to plunge dramatically from here, I would still not recommend waiting with all of one's capital to re-enter the market at $650. The risk with precious metals as a long-term investment is to be out of the market, not to be in it (we are in the secular bull market, so gold, silver and PM stocks rise on average), and timing the exact bottom is speculation. I believe that one should use only a part of their capital for speculation. You will find more about this topic in the "Key Principles" section.
Summing up, I respect the Elliott Wave theory and people using it, but I would not recommend waiting with one's long-term holdings for a not-very-likely plunge. What if it does not materialize? It's very easy to get "all emotional" about any market while trying to time it with a very large (on a percentage basis) amount of money. This alone is dangerous, as it often makes one wait for the big (or at least small) pullback for the whole upswing and finally "give up" right at the top. Therefore, even if you decide to wait for gold to plunge to $650, I would suggest waiting with only a (speculative) part of your capital.
The Precious Metals Market
On the other hand, I have received several e-mails in which I was asked about whether this correction is over or not. Generally, if I believed that was the case, I would send a Market Alert, since that would invalidate what I've written previously. I can't tell market what to do next, so I always try to focus on what provides me with and tell you what I think about it. Since previous week's rally has not invalidated previously established declining short-term trend line, it should be viewed as a counter-trend rally. Please take a look at the following chart for more details. Charts are courtesy of stockcharts.com.
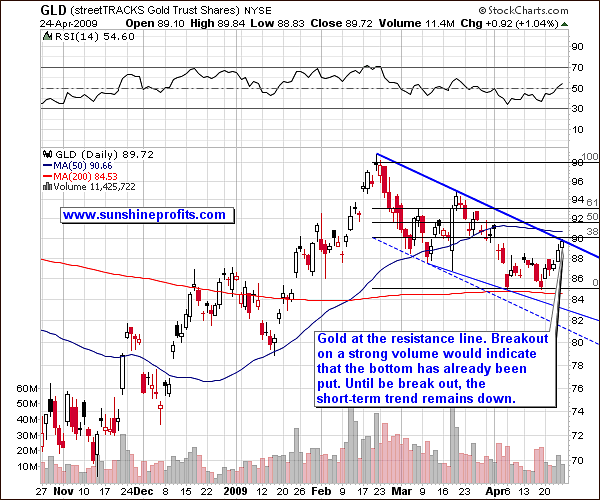
Last week's rally was really impressive on a day-to-day basis, but when one takes a look at it from a distance it becomes visible that that it has reached a resistance level and stopped right there. This means that it is still a counter-trend rally, and should not make you too excited - yet. Don't get me wrong - I'm referring to the short-term trend which is down - I'm still bullish on the precious metals sector in the long run.
Much depends on where will the gold market go in the next few days. If we get a breakout on a strong volume and verify the previous trend line as a support (as prices drop modestly and bounce after reaching it) - an immediate surge to $1000 is likely. However, if we bounce off the resistance line, or (even stronger signal) break through it on a low volume and then decline on a strong volume (again, below the trend line), gold would likely reach the area described in the previous Premium Update - $825 - $860.
The silver market provides us with similar signals:
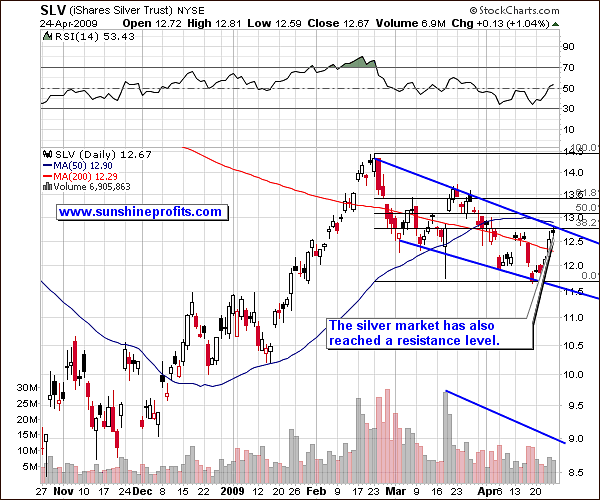
We have just seen a remarkable, almost $1 move in only 5 trading days, but it has also stopped at the resistance line. Once again, the next few days will most likely serve as a key factor in determining what is more probable in the near future: a rally or another decline.
Moving on to the gold stock sector, we have experienced a substantial move in the last few days, but it doesn't suggest that the bottom is in - yet.
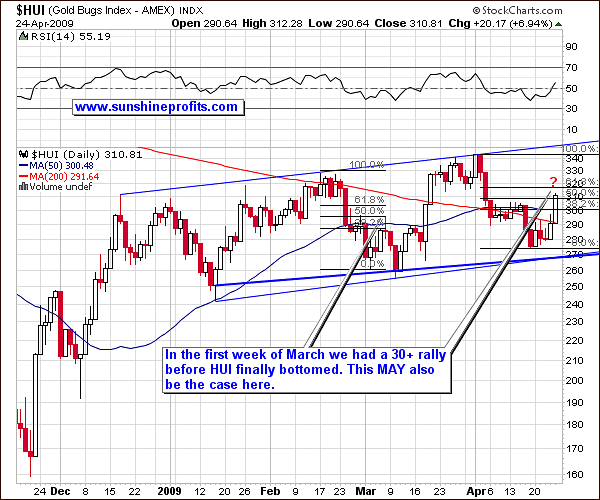
The HUI Index bounced to the 50% retracement level, which is exactly the level that stopped similar temporary upswing at the beginning of March. Therefore, I'm not yet convinced that we will move higher immediately. In my view, this is possible, but not enough to enter a speculative long position here, especially after a few days of sizable gains. In more quantitative terms - the potential profit that one can make during the following rally has decreased (we are higher, so wherever the top might be, we are closer to it today, than we were a week ago. At the same time the chance for further gains has not increased significantly, as what we've seen is still within the "historical norms" for a decline in the PM stock sector. If we break higher we will have even smaller potential profit for this rally, but the probability that the following rally will indeed materialize, would increase significantly.
Correlations
As you already know, it is usually best to analyze many markets, even if you are really interested in only few of them. After all, given today's level of globalization in the world economy and in financial markets, it is not uncommon to see most (!) markets plunge or soar at the same time. I've written about this phenomenon in the essay dedicated to gold market's fundamentals, so I don't want to repeat myself here.
Analyzing many markets already gives us advantage over most investors, which focus on gold or silver only, but we don't stop there. In order to make this multi-market analysis even more efficient, we estimate the strength of "influence" that particular non-PM market has on gold, silver and corresponding equities. Consequently, we are able to pay greater attention to markets that are more important at particular moment. One of ways to measure the strength of the aforementioned "influence" is to use the linear correlation coefficient. I have put "influence" into quotation marks, because the correlation coefficient does not tell us which market influences which - still, we have the common sense to know that the price of gold determines earnings and therefore share prices of gold mining companies, not the other way around.
What this number really tells us, is "how much" have the markets moved together in the past, without telling us why this has taken place. This "correlation number" takes values from -1 to 1. If it has a negative value it means that this correlation is negative - two markets on average move in the opposite direction. If the "correlation number" is positive, then it means that these two markets move in the same direction on average.
For example, if we calculated the value of correlation coefficient for gold and silver it would certainly be positive. You can also tell the strength of the correlation by looking how far it is from 0. For example during last year (+/- 250 trading days) gold and S&P Index have moved rather independently from each other and the correlation value is very close to 0 (it equals 0.08). On the other hand, HUI Index has moved rather in tune with the price of gold, so the correlation coefficient for the previous year equals 0.67. Please take a look at the table below.
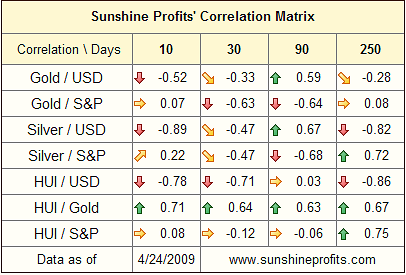
I have calculated values of correlation coefficient for gold, silver and PM stocks with USD Index and the general stock market (S&P Index). I have grouped the results into columns, depending on how much data I have used to calculate a particular number. The first one has been calculated for the previous two weeks (10 trading days), whereas the last one has been calculated for the previous year (+/- 250 trading days)
The column, which one should analyze depends on what one wants to know. If you're a long-term Investor who wants to analyze the long-term trends, one should go with the last column that is created by calculating data from the previous 250 trading days (about a year). On the other hand, Day-traders should focus on the 30-day long column or even the 10-day one (though this one is not statistically significant, but that is another matter).
The point is that not only do the prices on various markets change and should be analyzed in different time-frames, but the same applies to the way markets influence each other. The important thing here is that prices and correlations don't necessarily change at the same time. Therefore, when we see that we are getting closer to a particular turning point in gold, silver or corresponding equities, we may check what the key markets are - at that particular moment. This will tell us what might serve as a catalyst for either breakout or breakdown, which consequently increases our chances of making a correct decision. In other words, analyzing these key markets should provide us with more information about future prices and trends, than analyzing other, non-key markets.
The table above tells us several obvious things (thus indicating that this type of analysis makes sense), and several new ones. As far as the former are concerned, please note that the correlation between gold and gold stocks is always positive, meaning that gold and gold stocks tend to move in the same direction - which is obvious, and that does not add much to what we already know. On the other hand, we see several interesting points.
Gold has been lately (30- and 90-day correlation) trading rather in tune with the general stock market (naturally in the opposite direction), but it seems that gold is going trade more independently in the future. The 10-day correlation equals mere 0.07 which means that in the very recent past gold moved rather independently from the general stock market. As I've mentioned earlier, 10 days is not enough data to make any detailed claims, but it's enough for us to be suspicious regarding the previously prevailing correlation.
As you may recall, in April 3rd Premium Update, I wrote:
It is difficult to say, when will markets stop perceiving U.S. Dollars as a safe haven, but I will monitor this situation are report to you accordingly. For now, the direct implication is that for now, signals for the USD market do not automatically translate into signals for gold/silver.
For now, it (once again) seems that gold is resuming its normal, negative correlation with the dollar (as measured by the USD Index). This, accompanied by already strong negative correlation USD - silver and USD - HUI, is more than enough to make me get back to our regular USD analysis. Still, I'm not yet convinced that this correlation has returned to its normal, negative form.
Summing up, there is no strong proof yet, but it seems that the precious metals market is once again looking more at the USD Index, than at the general stock market. This does not mean that "from now on, the dollar market is all there is to the precious metals market", but it indicates that divergences between the dollar market and the precious metals market should once again be viewed as important. The general stock market is still relevant in our analysis, but we may need to look at the dollar market for more meaningful signals.
The General Stock Market
As far as the general stock market is concerned, please take a look at the following chart.
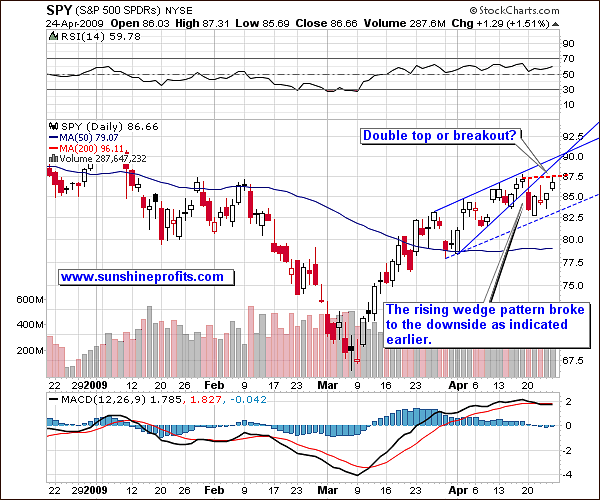
The rising wedge pattern that I mentioned last week has broken to the downside, as expected, but the following decline was only a few days long. The general stock market is now testing its previous local top, and it is not clear what will happen next. However, taking the aforementioned correlation analysis into account, it is not as important, as it used to be in the previous months.
USD
This time, we need to take a look at the USD Index for more details.
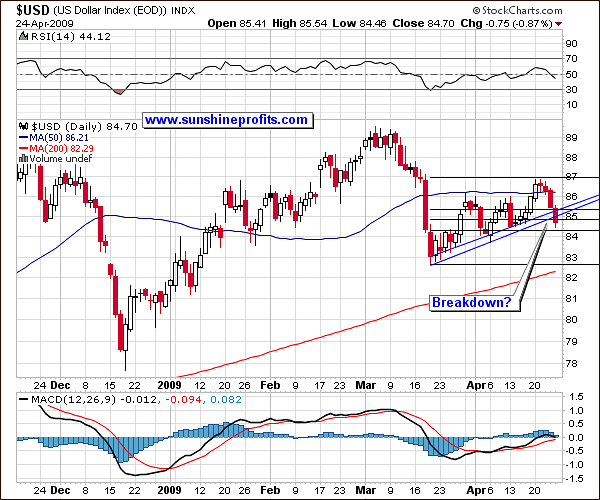
The above short-term chart may seem bearish, as USD Index has just broken below a short-term trend line. However, I for now I remain skeptical about this breakdown, as it didn't go below the 61.8% Fibonacci retracement level, and it closed below the trend line just for one day. Moreover, the breakdown is visible on the short-term chart.
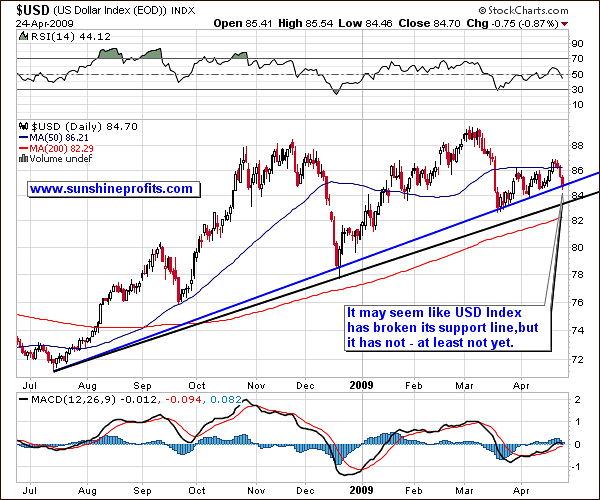
From a long-term perspective, this "breakdown" is currently really insignificant. Naturally, this could turn into a serious decline, but it has not happened yet.
Summary
Summing up, I believe that long-term part of one's capital should already be invested in the market. Please note that our Gold Bottom Indicator has already signaled that we are at or near a long-term buying opportunity.
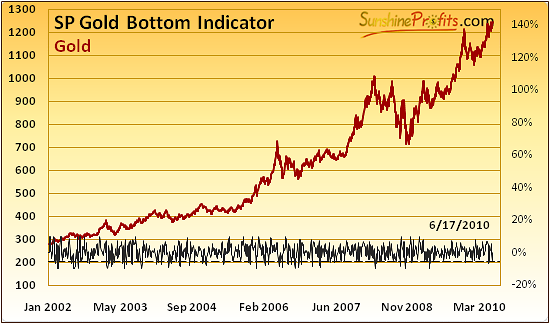
You can monitor this indicator by going to the Charts ->SP Indicators - Long-term Charts section.
Given rather high reliability of this indicator, in the previous Premium Update I wrote that long-term PM Investors can add to their positions in metals, regardless of what happens in the next few days.
As far as speculation is concerned - there are no changes this week and information from the previous Premium Update is still up-to-date. In other words - in my view, we are not yet at a particularly favorable moment to initiate a speculative position. This may change if we break out of the declining trend lines which I mentioned in this update, or if we decline once again. I will keep you updated.
Other information
We are working on the RSS feed which will (optionally) notify you when indicators from the Charts section give a signal. We will most likely implement also other features in the RSS mechanism - it should be available within the next 2 weeks.
We are implementing this feature, because several Subscribers indicated that it would prove useful. If you have any other requests/ideas we would love to hear them and (if possible) upgrade our service accordingly.
Thank you for reading, have a great week!
Sincerely,
Przemyslaw Radomski

