
We didn’t win the $2.6 million bid for the power lunch with Warren Buffet. Truth is, we didn’t even bid. But that’s not going to stop us, the staff of Sunshine Profits, from imagining what it would be like to sit down for lunch with the planet’s third wealthiest person, the Oracle of Omaha, himself.
This is the man whose rule number one is never to lose money, and whose rule number two is never to forget rule number one. Maybe we could change his mind about gold and gain some nuggets of his wisdom. His views on gold are well known including his famous quote: “Gold gets dug out of the ground in Africa, or someplace. Then we melt it down, dig another hole, bury it again and pay people to stand around guarding it. It has no utility. Anyone watching from Mars would be scratching their head.”
Again, the situation below is just a hypothetical one created to illustrate a few long-term points about gold and non-gold investments.
We arrive early at Manhattan’s steakhouse, Smith & Wollensky. We don’t want to be late to a lunch for which we had just paid $2.6 million. We study the menu while we’re waiting. At a rate of $21,666 per minute, every minute is precious, but it’s all for charity, so who is counting. We’ve already discussed some possible questions to ask, some macroeconomic questions such as does he like China? Brazil? The Eurozone? What about Treasuries and oil? Does he still believe in America? The only topic that is off-limits is his future investments.
There no point is asking about his investing secret; it’s well known-- buying great companies whose earnings are predicable at reasonable prices and holding them for a long time. He was quoted as saying that it’s far better to buy a wonderful company at a fair price than a fair company at a wonderful price.
He arrives exactly on time, lean and affable, spry for an 80-year-old. There are smiles and handshakes all around and he puts us at ease. As we walk to our cozy, wood-paneled alcove we are aware of heads turning and whispers trailing us like the wake of a boat sailing the Hudson River.
We sit, the waiter pours ice water all around and Buffet gets right to the point.
“Why would a bunch of precious metals analysts such as yourselves want to have lunch with me, knowing my views about gold?” he says, a teasing smile on his face. He’s obviously done his homework and knows what we do.
“Maybe by desert and coffee we will have changed your mind about precious metals,” I retort, smiling back.
He rises to the challenge, “Go for it,” but looks skeptical, like he is not expecting to hear anything new. “Listen,” he says. “The problem with commodities is that you are betting on what someone else would pay for them in six months. The commodity itself isn’t going to do anything for you. It is an entirely different game to buy a lump of something and hope that somebody else pays you more for that lump two years from now, than it is to buy something that you expect to produce income for you over time.”
“It’s a matter of investing philosophy,” I reply. “It’s true that gold doesn’t earn you interest, but…”
I’m interrupted by the waiter bringing a basket filled with various kinds of breads as he sets down the menus. The bread inspires me.
“As a long-term investment, physical gold isn’t so much an investment as it is money and a preserver of wealth,” I say, reaching out for the bread basket, and I hold it up.
“See this bread?” I ask. “In Babylonian times, some 3,000 years ago, an ounce of gold could have bought you 350 loaves of bread.”
“And the point is…”
“That today, an ounce of gold will still buy you the same amount of good quality whole wheat bread. That’s over 3,000 years of wealth preservation,” I say and slather butter on a slice, as if to make my point. “That’s a nice suit you’re wearing,” I add gesturing to Buffet’s blue well-tailored suit. I know that the guy lives modestly, still in the same five-bedroom stucco house in Omaha that he bought in 1957 for $31,500, but the suit looks new, probably a Zegna. “I’m not going to ask you how much you paid for the suit. That would be rude. But probably something like an ounce of gold’s worth,” I say.
“I buy expensive suits,” says Buffet, a smile lighting up his face. “They just look cheap on me.” He delivers the punch line with perfect timing and looks pleased. We all laugh.
“Well, in Roman times, an ounce of gold would have bought you a toga of the first quality. Again, that’s a couple of thousand of years of a proven track record of wealth preservation.”
The waiter comes to take our order. Buffet orders his signature medium rare steak with hash browns, a side salad and a cherry coke. (Berkshire Hathaway is Coca-Cola's largest shareholder.)
“Look,” he says turning to me as soon as the waiter leaves. “If you’re going long on gold you are going long on fear. But you really have to hope people become more afraid in a year or two years than they are now. And if they become more afraid you make money, if they become less afraid you lose money, but the gold itself doesn’t produce anything.”
I let that sink in for a minute.
“There is plenty of fear out there and there is a lot more coming with the U.S.’s mountain of debt, the euro zone falling apart, the lingering effects of the Tsunami in Japan. You don’t have to be Dr. Doom and Gloom and dream about black swans at night to see that there are difficult times ahead. Physical gold is some of the best insurance you can have.”
“In the business world, the rear view mirror is always clearer than the windshield,” Buffet says. “None of us have a crystal ball. None of us know what will happen. I guess that means you like to buy gold and hold it. I guess it means that I like to buy good companies and hold them. When I buy a company I never attempt to make money on the stock market. I buy on the assumption that they could close the market the next day and not reopen it for five years. If a business does well, the stock eventually follows.”
“Our investment philosophies do not clash,” I say. “There should be room for both in any portfolio. Besides, just like gold has proved its mettle over thousands of years, you certainly have made your point with your Midas touch for picking stocks.”
“Do all your metaphors allude to gold?” he asks, amused.
We discuss what characteristics make for a good investor and agree that one needs to attain intellectual clarity and emotional detachment.
“Look at market fluctuations as your friend rather than your enemy,” says Buffet. “Profit from folly rather than participate in it.”
“We couldn’t agree more,” says one of my associates. “But sometimes these market fluctuations start off as your friends and very quickly turn on you and stab you in the back.”
We all laugh with some remembered pain.
“If it were that easy, everyone would be millionaires,” Buffet replies. “The line separating investment and speculation, which is never bright and clear, becomes blurred still further when most investors have recently enjoyed triumphs. Nothing sedates rationality like large doses of effortless money. After a heady experience of that kind, normally sensible people drift into behavior akin to that of Cinderella at the ball. They know that overstaying the festivities will eventually bring on pumpkins and mice. But they nevertheless hate to miss a single minute of what is one helluva party. Therefore, the giddy participants all plan to leave just seconds before midnight. There’s a problem, though: They are dancing in a room in which the clocks have no hand.”
The waiter comes to get our desert order.
“Just bring one of each and lots of spoons,” Buffet says. The man knows how to enjoy the simple pleasures of life.
As we savor the deserts, (especially the Hot Deep Dish Apple Betty with vanilla sauce and Bourbon Pecan Pie) and linger over the coffee, Buffet gives us the benefit of his many years of experience and wisdom.
Someone brings up Dominique Strauss-Kahn and Buffet says; “It takes 20 years to build a reputation and five minutes to ruin it. If you think about that, you’ll do things differently. Remember that you only have to do a very few things right in your life so long as you don’t do too many things wrong.”
As the lunch date begins to wind down he talks about the effects of aging. He delivers his last punch line and it’s a good one:
“I’ve reluctantly discarded the notion of my continuing to manage the portfolio after my death,” he says. “I have abandoned hope to give new meaning to the term ‘thinking outside the box.’”
We wish him good health and a long life and thank him for the privilege of breaking bread with him.
“Don’t listen to my prattle against gold,” he says as we shake hands. “I may be talking against it but you’re laughing all the way to the bank, so who is right?”
Since we know that there is no such thing as a free lunch, we will now turn to this week’s technical portion with the analysis of the Euro Index chart (charts courtesy by http://stockcharts.com.)
Euro - USD Indices
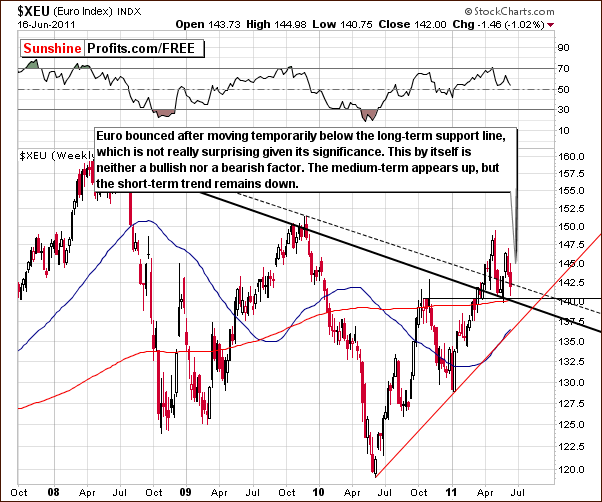
The Euro Index levels bounced this week after temporarily moving below the declining support line created by the 2008 and 2009 tops. This support level is indeed significant.
The current index level is close to the local top seen late in 2010, so a pause here appears to be justified. The short-term trend still appears to be down but the medium-term trend seems to be up. If the current downtrend continues and the Euro Index reaches the red, rising support line in our chart, this will likely cause precious metals’ prices to move much lower. Please note that the medium-term outlook here is not overly important to the short-term outlook for the precious metals sector.
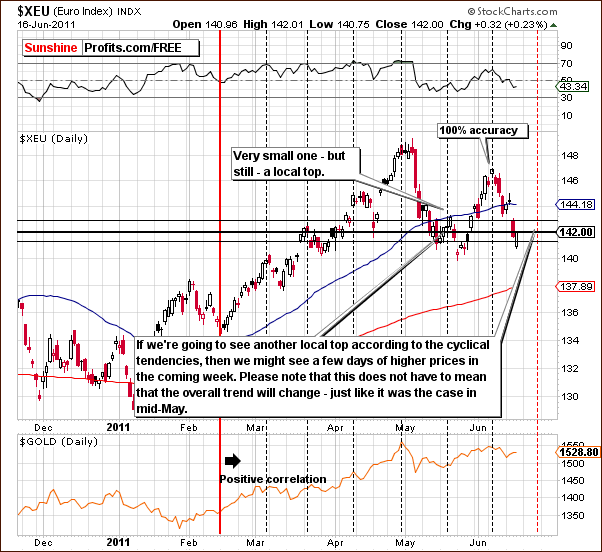
In this week’s short-term Euro Index chart, we see that a support level based on the late 2010 top has been touched. It is certainly possible that a contra-trend rally may be seen from here; however, we don’t think it would be a big one.
The cyclical tendencies of the Euro Index indicate that local tops repeat every two and a half weeks or so. Consequently, a local top is possible in about a week but this will be seen only if index levels reverse and move higher beforehand. This possibility is similar to what was seen in mid-May when a small rally led to slightly higher index level values but at the same time it did not really invalidate the previous downtrend.
The implication for gold is rather positive in the immediate term (several days) and bearish soon after that. A number of other factors are involved and will be discussed in later sections of this week’s Premium Update.
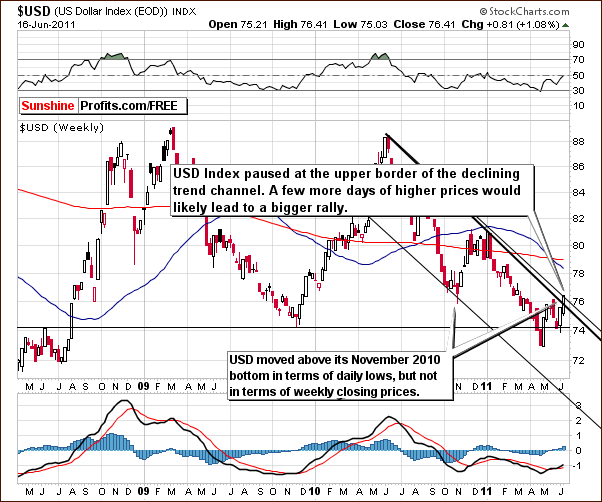
In this week’s long-term USD Index chart, we see a similar (but opposite) outlook to what we discussed in the Euro Index chart. Resistance levels have been reached and a pause and/or some sideways movement may be seen. Perhaps the index could even decline slightly. On the other hand, there is a good possibility that a breakout could be seen soon after that and this would, of course, result in considerably lower prices for gold.
Summing up, the outlook is slightly bearish for the dollar in the immediate term although bullish for the short term. It appears that some sideways movement or slight declines for a week or so could be followed by higher USD Index levels.
General Stock Market
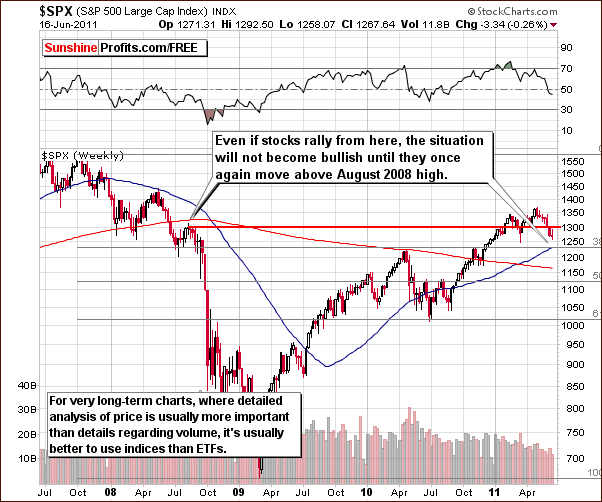
In the very long-term general stock market chart this week, we have seen the S&P 500 Index move to the level of August 2008 highs and then decline. The breakdown appears verified and may be verified once again if accompanied by a quick consolidation in the USD Index. Consequently, the medium-term outlook is bearish at this time and going forward until the S&P 500 Index again moves above the level of the August 2008 highs.
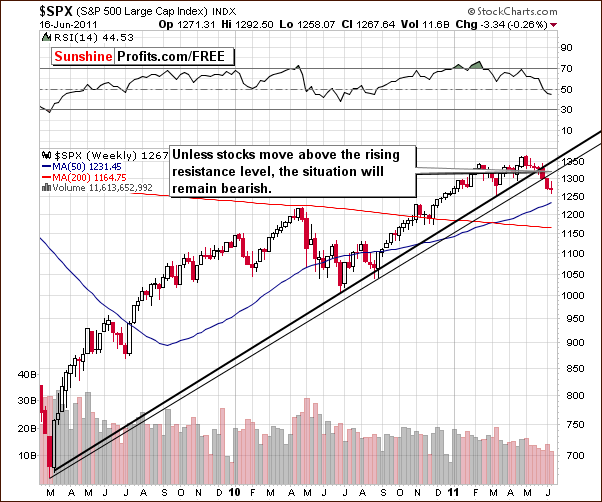
In the medium-term S&P 500 chart this week, we have also seen a breakdown and it is currently in the process of being verified. Generally, index levels need to move above the rising resistance line to invalidate the breakdown and this appears unlikely.
A small (!) rally or a period of sideways movement would still confirm the breakdown and likely lead to much lower index levels in a week or so. This appears to be the most likely scenario based on current analysis and historical trends.
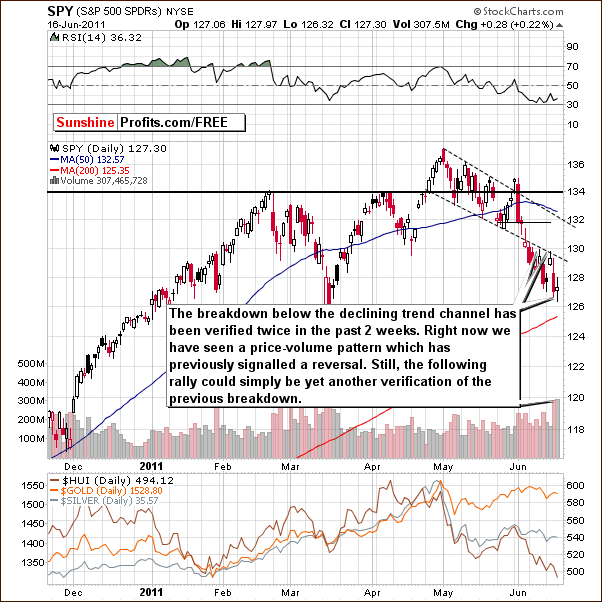
In this week’s short-term chart, it appears that perhaps a short-term rally is possible based on volume levels in Wednesday’s price decline. The doji candlestick pattern, defined as the situation when the opening and closing prices are virtually the same, has been seen on Thursday. This factor signals that it is likely that a reversal will soon be seen here.
Therefore, one more sign of the eventual verification of the recent breakdown has been seen which is similar to what’s been happening during the past two weeks. Both rallies failed to take stock levels back into the trading channel and the situation remains bearish.
At this point, there is no evidence that stock prices will move much (!) higher but it is more probable that even a small rally would materialize than it was several days ago. If a short, contra-trend rally is to be seen, it’s likely to begin now.
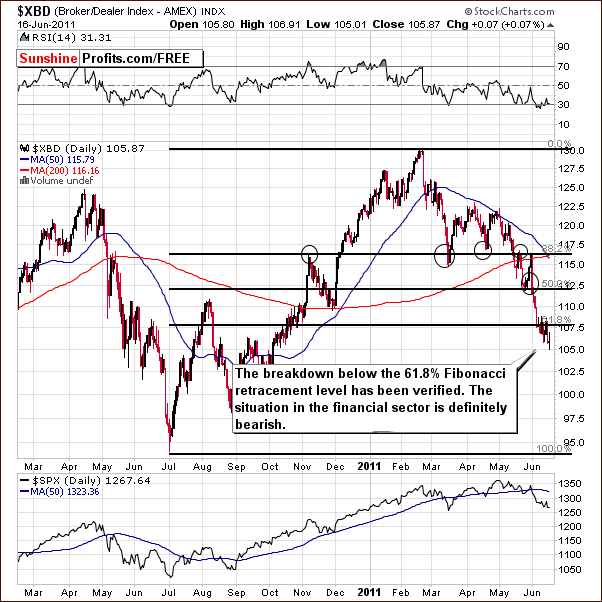
The XBD Broker-Dealer Index chart indicates that any rally in the stock market is not likely to be sustainable. Here, a breakdown below the 61.8% Fibonacci retracement level has been seen and verified. This is an important bearish indicator.
The next significant support level is that formed by the 2010 lows. If the financial stocks decline to that level, then significant declines in the overall values in the general stock market will likely be seen.
Summing up, the situation for stocks in general appears bearish for the medium term. The outlook for the short term, however, is slightly bullish.
Correlation Matrix
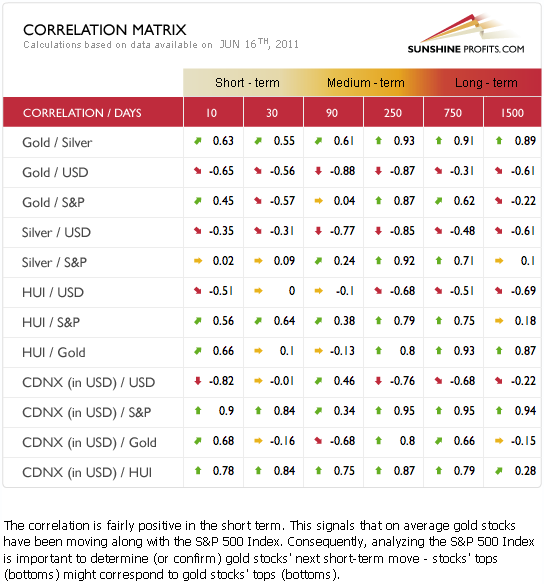
In this week’s Correlation Matrix, we see that the short-term bullish situation in the general stock market is most likely to influence the gold and silver mining stocks. The correlation coefficient of 0.64 is quite high as seen in the 30-day column of this week’s matrix.
Gold and silver mining stocks have been following the general stock market more closely than they have been following gold in both the short and medium term. The short-term influence of the general stock market clearly visible this week. In fact, this could be one of the reasons behind the underperformance of gold stocks recently. Another reason could be that gold stock’s underperformance is simply an indication of a severe decline which has yet to be seen.
It appears that we could see an immediate-term rally in the general stock market and in gold and silver mining stocks as well. However, given the breakdown (which we will discuss in the mining stocks section), such a move could simply be a bearish verification of previous chart patterns. More will be discussed on this topic later. For now, let’s take a look at the long-term gold chart.
Gold
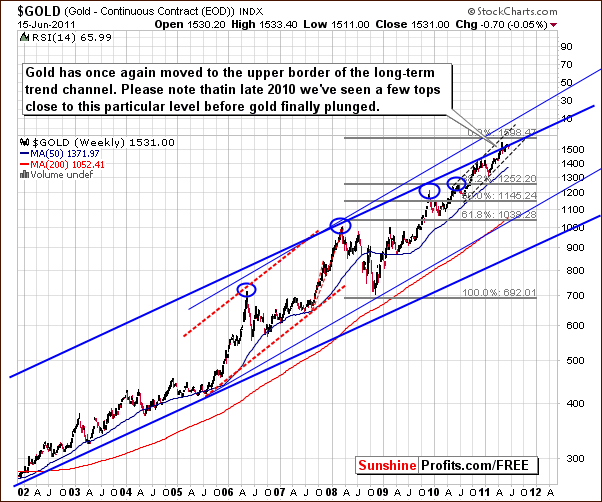
In this week’s very long-term chart for gold, we see that gold is still trying to move above the upper border of the rising trend channel. Once again, this move is similar to one which was seen late in 2010 and several attempts to rise above the trading channel have been unsuccessful. The most likely outcome of these failed attempts appears to be an eventual decline from present levels.
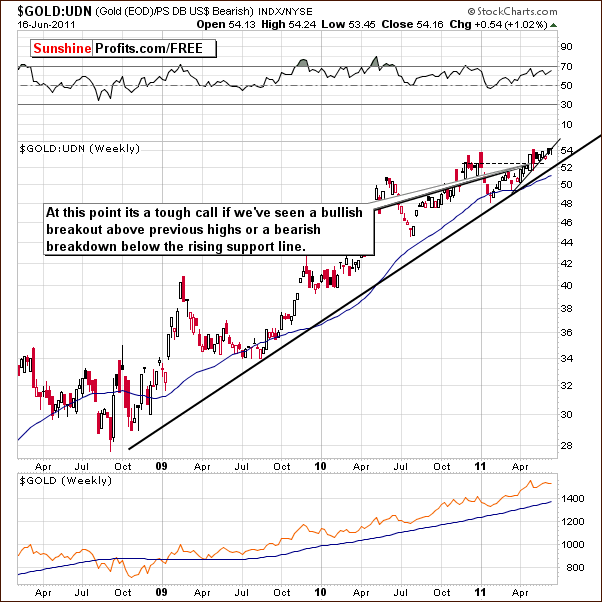
In gold’s long-term chart from a non-USD perspective, we can see both: a breakout above previous highs and a possibly breakdown below the rising support line. It is a tough call as to which will win out based on this chart alone.
The important point here is that the move below the short-term rising support line could signify a loss of momentum for the yellow metal and could very well lead to a period of decline. We have actually seen a move below the support line and then a move back to it.
In short, the sentiment is bullish on a breakout and bearish in any move below the rising support line. The situation therefore, is mixed with a slightly bullish bias at this time.
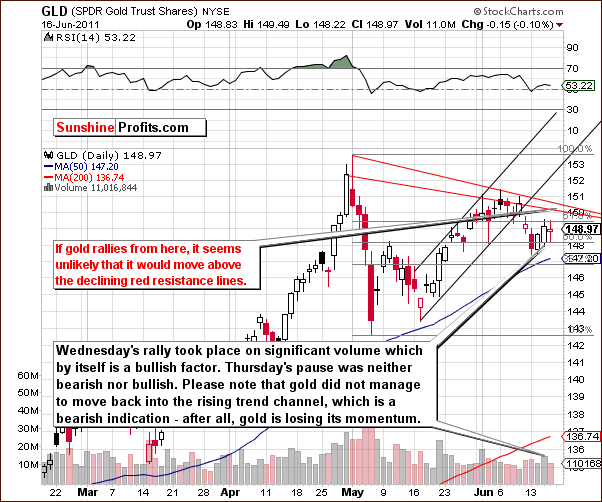
In this week’s short term GLD ETF chart, a proxy for gold from a USD perspective, we see that the situation is mixed as well. Note that the breakdown below the rising trend channel has been confirmed since the price action has been below this level for more than three consecutive days. The indication is that the momentum is declining which is a bearish factor as any market needs fresh buying power in order to move higher.
Wednesday’s rally with significant volume appeared to be a somewhat bullish sign. On Thursday however, gold barely moved on low volume with a decrease of about 0.1%, in effect a pause. Consequently, gold could move a bit higher in the next few days, perhaps to the declining resistance lines (marked on the above chart with red).
Summing up, the situation is quite mixed for gold at this time. The medium-term outlook appears rather bearish while there is some evidence of slightly bullish indications in the immediate term. The breakout below the rising trend channel has been confirmed and the fact that gold is losing its momentum is quite bearish. The past few days seem to have been a small contra-trend rally and are unlikely to have any overly important, long-lasting effect.
Let’s examine the silver market to see if it confirms gold’s recent move up.
Silver
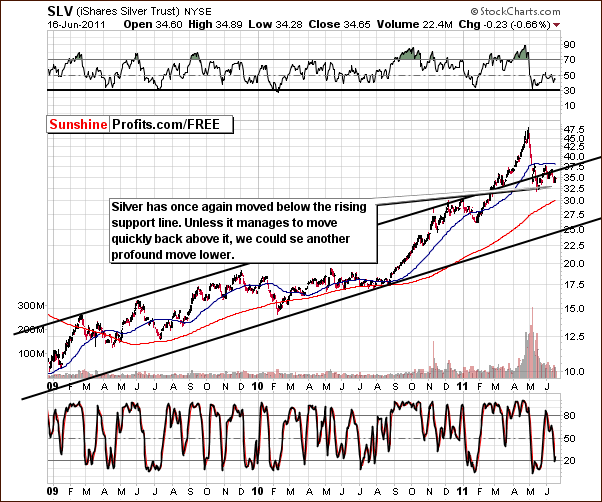
In this week’s medium-term chart for silver, we have seen yet another move back down to within the trend channel. The recent big rally appears to be over and based on this breakdown alone, declines are likely to be seen from here.
The breakdown seen several weeks ago was not confirmed. It was invalidated by a quick move up at that time but it appears that this breakdown may indeed be verified. If such is the case, further declines are very likely with downside target levels of $30 or even lower.
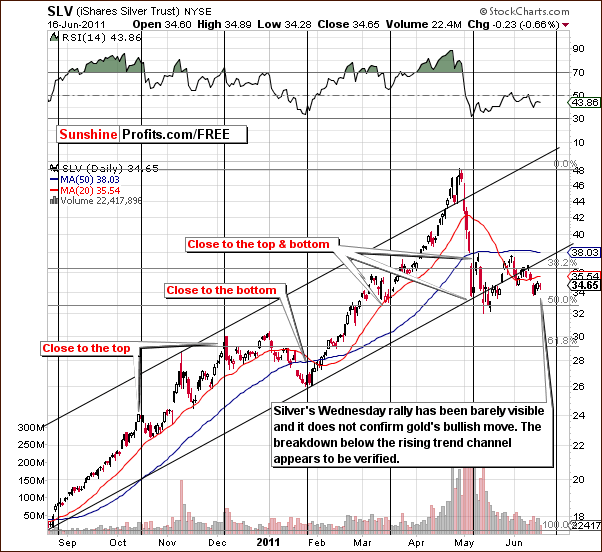
The short-term SLV ETF chart allows us to compare the recent moves of silver directly with that of gold. Note that this week’s rally for the white metal is barely visible here and is better described as a pause within the decline. Therefore, gold’s bullish move is definitely not confirmed by its sister metal.
Silver’s cyclical turning point is coming up soon. This could mean that we will see a significant decline or possibly a slight move higher for a few days and then a decline. The latter would indicate the turning point close-at-hand is in fact a local top. That would coincide with cyclical euro turning points examined earlier – local top with euro could be seen very close to a local top in silver.
Summing up, the situation remains bearish for silver. Two breakdowns have been seen recently below the rising support lines for both medium-term and short-term timeframes. Silver does not confirm the bullish move of gold and the picture here remains quite bearish for the white metal.
Gold and Silver Mining Stocks
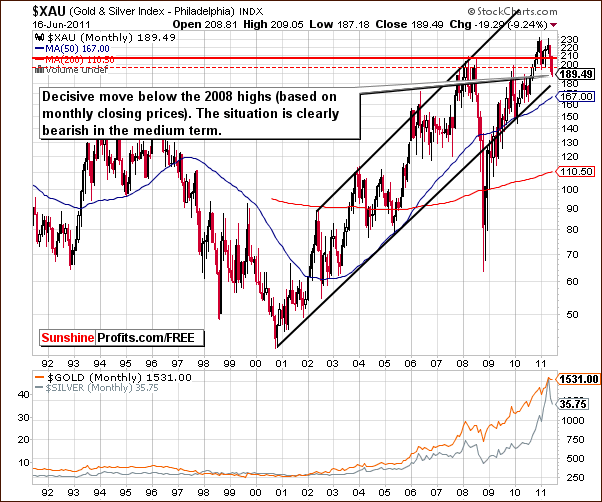
In the very long-term XAU gold and silver mining stocks index chart this week, we see a quite visible move below the 2008 highs created by monthly closing prices. This is a recent development and has also brought the index level to a new low for 2011. The situation is now considerably bearish for gold and silver mining stocks in the medium term. This is certainly worth keeping an eye on in the coming weeks.
Actually we find it ironic that gold from the non-USD perspective appears to be breaking above its previous highs while at the same time mining stocks are breaking below their previous lows.
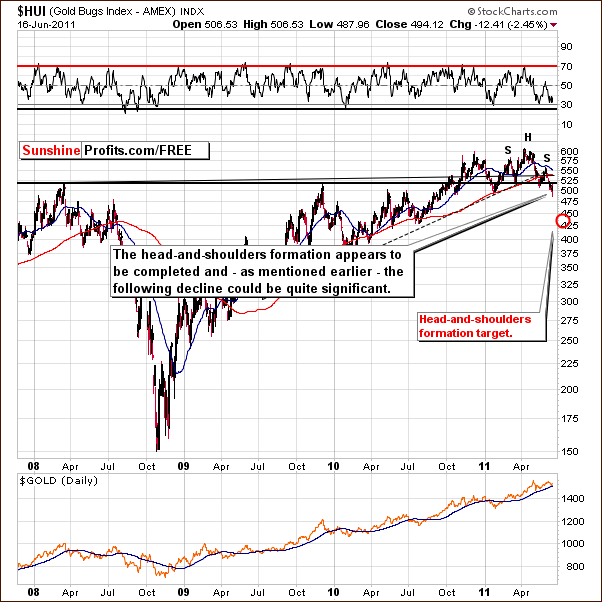
In this week’s HUI Index chart, more details emerge about the likely direction for gold stocks. The significant head-and-shoulders pattern was discussed in our Premium Update June 10th 2011. We stated that gold stocks appear to be completing the bearish head-and-shoulders pattern and if the index level moves below the level of previous lows, the completion of this pattern could lead to a considerable decline in the HUI Gold Bugs Index. It appears that the index could in fact move below the 450 level, which has not happened for nearly a year. Naturally, that would have profound negative effects for the underlying metals as well.
Now we see that this pattern has indeed been completed and the target level slightly below 450 appears to be valid. At the very least, the target level is significantly more probable than it was last week. On Thursday, gold stocks declined significantly without a corresponding decline in gold itself. This is a very clear signal that the medium term outlook from here is quite bearish not only for gold stocks but for gold as well.
Let’s zoom in to see the head-and-shoulders formation with
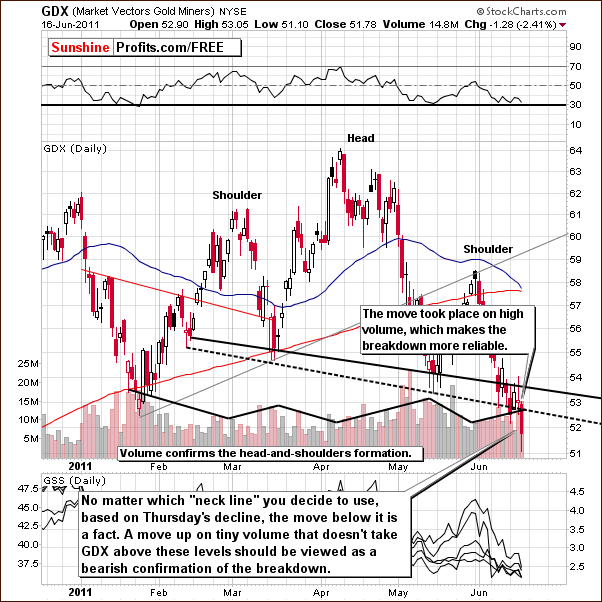
In this week’s short-term GDX ETF chart, we see that significant volume accompanied Thursday’s decline, which makes it more probable that this move will not be invalidated - yet another bearish sign for gold stocks. Speaking of volume, please note that during the whole formation, the volume was declining during rallies and rising during price declines and thus the formation is quite reliable. Moreover, since early June, all daily contra-trend rallies have been seen with low volume levels, whereas declines were accompanied by high volume. This is also a very bearish sign.
The neck levels based on both: the daily closing prices and the intra-day lows have seen breakdowns. Both have been broken on significant volume and the preceding rally was accompanied by low volume. This is a very bearish combination. If we see a move higher – up to the neck levels and this move take place on low volume, then it will serve as a verification of the breakdown and will likely make us send out another “go short” alert.
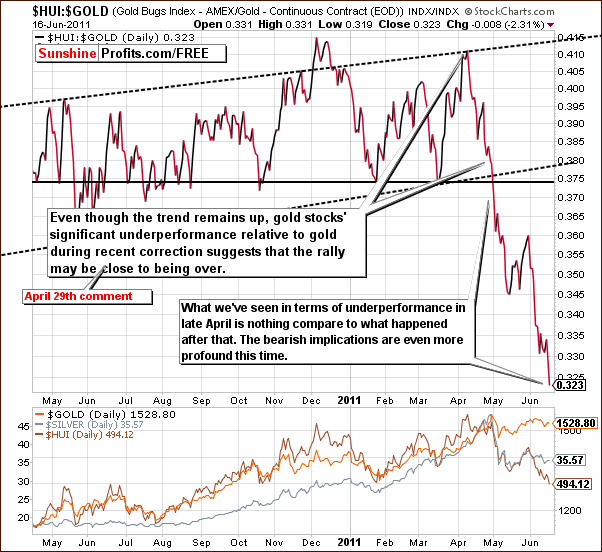
Our final mining chart shows the ratio of gold stocks to gold itself. On Thursday, gold stocks declined significantly and gold itself was pretty much unchanged. The ratio therefore, dropped even further - more than 2% on this day.
The scale of underperformance of the gold stocks compared to gold which was discussed a week ago is even greater this week and is a factor very much in play. It supports the premise that gold’s recent rally is not sustainable and gold prices are likely to reverse and decline quite soon.
Summing up, the situation is very bearish at this time for gold and silver mining stocks for the medium term. Bearish signals are seen in each chart featured in this section and the situation in the precious metals sector is simply not good.
Sunshine Profits’ Indicators
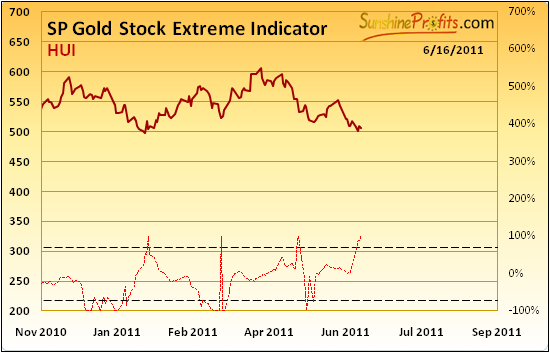
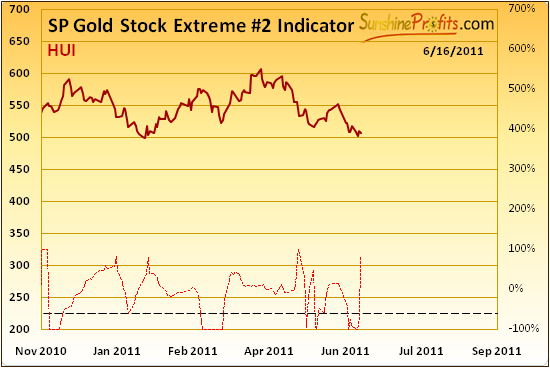
The SP Gold Stock Extreme Indicator and the SP Gold Stock Extreme #2 Indicator have both signaled extreme readings recently. The local bottom seen in the HUI Index on Thursday is not likely the end of the current decline (as discussed earlier in this update), but it seems that at least a small counter-trend rally will be seen.
Since the move has been seen below the neck level in the head-and-shoulders patterns in both the HUI and GDX charts, this small move up, could be in fact a verification of the breakdown. If index levels move back to the neck level in the pattern and then decline, this would be a very bearish factor.
Summing up, even though we could definitely see a small rally from here, we believe now is not the time to bet on higher prices in the precious metals sector. The prevailing head-and-shoulders pattern seen in a couple of this week’s charts indicate tough times ahead for gold, silver and gold and silver mining stocks in general.
Letters from Subscribers
Questions about technical analysis tend to show up in our mailbox frequently:
Thanks for the Market Alert today….I’ve come to value your projections and assessments as my #1 source of info…keep up the good work! (Thank you! We are doing our best) I do have a couple of questions about the current investment setting and whether there are unique circumstances that could defy technical patterns.
With the volatility in the stock market, the fears about the effect of the Greece debt crisis, “fukushima” in Japan, our various problems with housing, jobs and stunning national debt here in the U.S., I have to wonder if investors are increasingly looking to precious metals as a safe haven……in a way that might defy usually reliable quantitative measures?
Also, is it possible the recent detailed study and report by Standard Chartered, citing the limited supply of gold in the next few years and projecting a $5,000 per oz top, tend to drive investors into gold in a way that could defy past technicals?
Here is what we wrote in the past about the usefulness of technical analysis, and it still holds true today. Here’s a summary:
September 3rd, 2010 Premium Update:
Well, the most important fundamental that does not change over time is human psychology and emotionality of individual investors. This is something by far more stable that one, two, or even three quantitative easings are not able to change. Will China's growth cause people to stop being greedy when they see higher prices and fearful when they see them decline? Will Europe's problems cause people to act by means of cold logic only? Definitely not. Moreover, even if TA will someday cease to be useful it is highly improbable that it will happen quickly. Certainly, it is not a matter of weeks, months or years because TA's foundations are based on real mechanisms, which are inherent part of each human being.
September 16th, 2010 Premium Update:
Technical analysis techniques as historical charts only give support to probability theory. Even the best tools and signals miss their targets between 20% and 30% of the time. This is important to remember whenever any type of analysis in undertaken to forecast future movement or trends - this is why limiting one's exposure is absolutely critical.
October 29th, 2010 Premium Update:
Any analysis (fundamental, technical, cyclical, fractal, econometric model, etc.) can be suddenly overruled - but that is no reason to ignore them. At any time someone could trigger a massive rally or major selloff in any given market, provided that they have enough cash. Does that mean that we should not invest in anything as there are absolutely no sure bets?
In our view this approach is wrong because it confuses what's possible with what's probable. Instead we suggest taking what's probable (most of the time each of the systems of analyses mentioned above will be useful, and by combining them we'll get more information than we could by just using one of them) and position yourself accordingly.
Fundamentals are favorable for gold, silver and mining stocks. Dedicate a part of your capital to long-term investments. Market inevitably corrects from time to time - use charts and other tools to gain on most of them. Don't expect catching each move, as it's impossible to accomplish. Financial markets could be destroyed overnight if China dumps its dollar holdings or derivative holders worldwide default or the COMEX defaults, etc. There are plenty worst case scenarios. Be sure to own physical precious metals as well.
As far as the second question is concerned, discussion of supply and demand is appropriate when estimating the main trend - which (we definitely agree) is up. Positive fundamental situation has virtually nothing to do with a few-month corrective decline that would take gold and silver prices lower. This certainly could happen, be followed by a turnaround and a rally that could eventually make gold reach $5000.
What we would like to emphasize is that fundamental factors are not something driving markets in the short term. Generally (there might be a few exceptions), if you check fundamental reports (from newsletter writers) from 2007, 2008, 2009, 2010 and 2011 they will most likely agree that the fundamental situation was favorable for gold and silver throughout these years (and we agree). However, did the price move up without any corrections? Didn't silver plunge from above $20 to below $10? It surely did - even despite positive supply-demand situation. These are long-term factors, not the short-term ones.
The most important factors driving prices in the short term are fear and greed (emotions). Cold logic (fundamental factors)"works" in the long run. Period.
Now let's move to the second letter from one of our Subscribers.
Mr. Radomski,
I'm not a trader per se, though I'm short term bearish on silver. I'm in ZSL so I don't see any real short term strength in silver or gold. If gold and silver were little moved by Wednesday’s events in Europe, I think this is a real weak sign for both metals. So if Europe over the weekend has even a short term solution for Greece, this should hurt both gold and silver. Secondly, when the U.S. comes to a deal on the debt ceiling, and they will despite the politicking going on now, this will be positive for the U.S. dollar and the stock market; however, the risk premium in gold and silver will pop like a balloon and we'll see much lower prices. Just my thoughts, I'm interested in your opinion on this.
As far as the solution for Europe is concerned (concerning Greece), it seems that much depends on what the solution will be. If it will roughly translate to "all right, we'll print more euros - don't worry, you're safe", it will be bearish for this currency and bullish for the USD Index. At this point this is what the charts are suggesting. However, since gold has been recently positively correlated with euro (and negatively with the USD Index) it might not be bullish for gold. That is counter-intuitive as printing money should be viewed as something that would cause one to want to hedge by buying gold. However, at the same time markets could believe that this will indeed provide a "relief" to the Eurozone and this could make gold appear less attractive as gold usually thrives on fear.
As far as our thoughts on the general stock market are concerned, it seems that higher value of the USD would not be too good for US Exporters, which would translate into overall lower values for stock indices. While the short-term correlation between stocks and metals are weak at this moment, the medium-term ones are rather high, so if we would see a bigger decline in stocks, it could make metals move lower as well.
We've received a few questions about the recent interview with Jim Sinclair, as one might have viewed is as being quite contradictory to our previous Premium Update. In fact, Mr. Sinclair stated that you're out of your mind if you sell gold assets now. In short, we humbly disagree as we don't believe that 100% gold/silver ownership at all times is the best strategy (it’s not bad either) and we believe that those who use part of their capital for speculation are making a good decision. Moreover, we think that using "now" in this statement is very misleading as the interview does not provide short-term timing-related reasoning, only the long-term-investment-related one. In the following part of this section we will quote Mr. Sinclair along with our comment.
So the potential right now, right here, right at this point for an error in judgment that would set off a loss of confidence is present, clear and in all probability something that we are going to be facing well into the summer months. Yeah, gold can rally (here), contrary to the opinions of those who believe in seasonality in monetary assets.
In our view there's nothing "to believe" here. Seasonality in both monetary and non-monetary assets is a fact, and one only needs to believe in things that cannot be proven. Moreover, this is a fact that played out remarkably well this May and it has been mostly correct in June as well - we have in fact seen a decline since the beginning of the month like seasonal tendencies would suggest - and we also have seen a rally in the USD Index - again in perfect tune with the seasonal tendencies.
This is not the place to outline every proof out there about the existence of seasonality as that would take too much space and our time for writing this report is quite limited (the new website will include an extensive coverage of the seasonality phenomenon in the report accompanying our True Seasonals tool), but let us point out that if there was absolutely no seasonality whatsoever (regardless of it being monetary or non-monetary assets), we would not have the "summer doldrums" pattern, nor would we have heard of the "sell in May and go away" slogan.
The problem is so serious, the problem is so present time, the problem is so real that it has inherent in it the probability that the economy is not going to have a significant recovery for more than a decade. And the standard of living in the United States, the standard of many who are reading this now, especially those who have taken no measures whatsoever to protect themselves, who simply look at it as reading something of interest but not really acting on it, is going to be so significantly impacted as to make the middle-class or higher middle-class join the serf class. This is as serious as it gets.
...This has gone so far that there is no solution that can be applied and the only practical method is to continue to expand their (the Fed’s) monetary aggregates to continue to hold down interest rates. And hopefully kicking the can down the road until somebody else is in charge and that’s exactly what they are doing.
These are fundamental factors that are not short-term timing related. Mr. Sinclair is advocating long-term ownership of precious metals and so do we - please note that we have not suggested selling one's whole long-term position. The reason was that one should "have some gold/silver just in case" at all times - generally based on the reasons mentioned above.
Again, this has nothing to do with a speculative bet on lower prices in the short-term. Fundamental factors do not, have not, and will not drive prices on the short run. Fundamentals are by definition long-term factors affecting a given market and the fact that they are positive for the precious metals sector means that these markets will likely move much higher in the long term. It does not say anything about short-term price fluctuations.
Well let’s just assume for a moment that QE is in fact limited to June 30th and let’s assume for a moment that the central bank of the United States would take a conservative restrictive approach towards monetary policy, I would suggest to you that the stock market would peel off 4,000 points so fast you would get wind burns. I suggest that if anything like that happened exposing the balance sheets of the financial institutions, that you would have to return to QE with a vengeance, unparalleled, unprecedented in history...
Firstly, this is not a short-term bullish factor - it's acknowledging the possibility of a short-term slide. Secondly, we agree and actually we suspect that the Powers That Be really want to see some kind of slide in values of stocks and commodities only to have a justification for another QE - and we think they will succeed in getting it. If you were in Bernanke's place, would you say "OK, it didn't really work, let's pump some more money into the system one more time even though prices are skyrocketing, cross our fingers and that it will work this time" or would you prefer to say "we did a good job, QEs were effective, and we can stop that for now as we really care about foreign US bond investors. Also, we want to take care of inflationary forces and make sure that the core inflation remains stable. The situation is under control." Then after prices tumble, you could say "well, we did our best in order to protect bondholders, but it seems that we need to use our super-effective (they worked perfectly last time, right?) QEs in order to protect jobs and stimulate growth." We will get back to making sure bondholders are safe once we take care of this problem".
Sounds clever, evil and... realistic? The call is up to you.
Summary
In the USD Index, the situation still appears to be bullish although declines or some sideways movement is possible in the coming week. The situation for the Euro Index is of course the opposite with a small rally likely to be followed by declining index levels.
In the precious metals sector, an insignificant short-term rally is also likely to be followed by declining price levels. It is possible that gold and silver mining stocks will verify breakdowns below the neck level of the head-and-shoulders formation, which would very likely lead to lower prices for the mining stocks and for gold and silver as well.
It is important at this point to keep our eyes open for developments in the currency markets as well as the general stock market and the precious metals sector. We will keep you informed whenever anything significant takes place and provide you with our timely analysis and thoughts on how each event will likely impact related markets and exchanges.
One final note concerning our Market Alert June 15th 2011: The points made are still up-to-date and speculative positions in the precious metals sector do not seem warranted at this time. In addition, it seems that a significant portion of long-term investments should be out of precious metals as well, a point which was suggested last week.
Our next Premium Update is scheduled for Friday, June 24, 2011.
This completes this week's Premium Update.
Thank you for using the Premium Service. Have a great weekend and profitable week!
Sincerely,
Przemyslaw Radomski

