
As I mentioned last week, this Premium Update will be dedicated mostly to silver.
Silver
I previously mentioned the silver market only through gold, which is highly correlated to silver - at least for now. The correlation may become weaker once we advance to the third stage of the bull market. The third stage is characterized by the wide-spread participation of the (emotional) public and by the massive parabolic upswing in virtually every asset in the sector. Silver is much smaller market and when more investors wake up to the fact that there's more to the precious metals sector than just gold and that diversification is a "good thing to do", silver's price will soar.
There is also a specific psychological phenomenon that I believe will make silver outperform gold. If you ask someone which stock (the same sector, fundamental situation, etc.) has a better chance to go up 10x in value: A priced at $0.1 or B priced at $100, they will almost always reply: A. Naturally this is an illusion, from a fundamental point of view, as the nominal price shouldn't have anything to do with stock's appreciation. But - thanks to this psychological phenomenon - the nominal price does matter. Since silver's nominal price is much lower than the price of gold, silver will appear more appealing to the average investor.
This has happened in the past - please note that silver's catch-up materialized mostly in the last phase of the bull market (1970-1980).
Naturally, there is much more to the silver market than just the two aforementioned features, but I have covered them in the past (see here and here), so there is no need to go through the fundamentals of this market once again here. Instead, I would like to focus on where we are in the silver market today, and what may be waiting just around the corner.
I will begin with the very-long-term silver chart (charts courtesy of stockcharts.com).
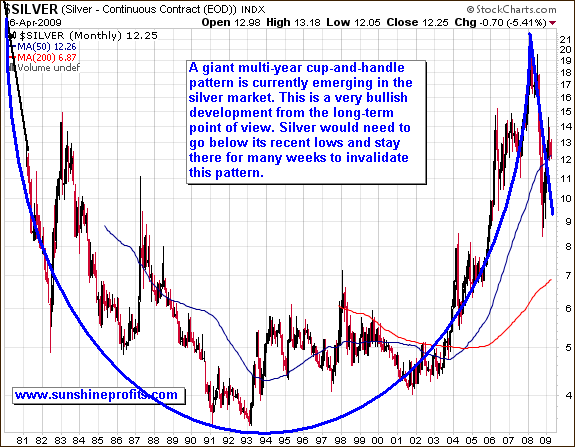
On a multi-year level, silver looks very bullish. Decent symmetry and the enormous size of the "cup" are really impressive. This pattern does not tell us whether or not silver has reached the ultimate low yet. It does not tell us, whether or not we will trade sideways for months. However, it does tell us that when this formation is complete, the following move should really be substantial.
Of course, this pattern could be invalidated, but silver would need to truly plunge (below $7 or so) and stay there for many weeks, to make this chart look bearish. I view this as very unlikely. Besides - for the secular bull market to turn into a secular bear market there must be a change in the fundamental situation on a particular market; even a powerful technical pattern is not enough to do it. The main implication that this chart has for long-term investors is that no matter how low we will go temporarily, silver will most likely bounce with a vengeance. This means that if you don't have to sell your silver in the next several months/years, then it does not matter much for you, how low will silver go temporarily. You can therefore just sit back and relax, or (even better) use a part of your capital for speculation (diversifying strategies) to make money along the way.
For more timing details we will need to zoom in.
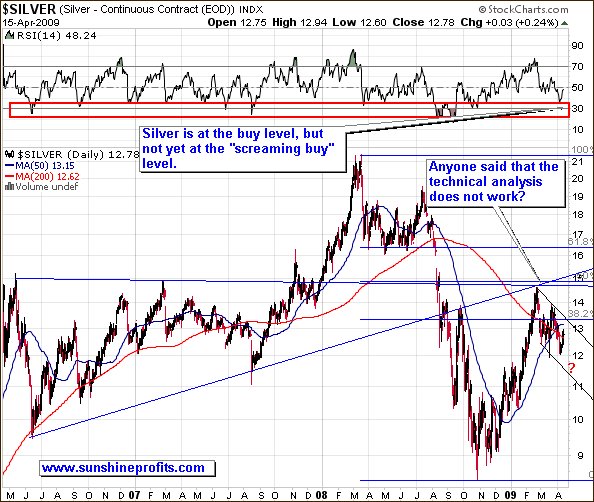
The above chart features the previous 3 years of silver prices. We had a dramatic plunge from above $19 level to below $9, after silver corrected 50% of the preceding downswing. Since this bounce has been rapid, a breather is needed before silver can climb higher. It's nothing to worry about - after a quick 60%+ move a pullback is to be expected. This is where we are today. It seems that this correction's end is near, but this chart alone is not detailed enough to make any specific calls.
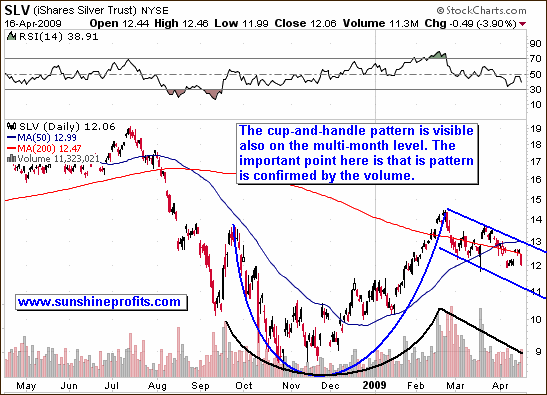
This chart gives us more detailed information. By using the SLV ETF fund as a proxy for silver, we are able to analyze the volume and see that the multi-month cup-and-handle pattern (yes, once again) is emerging. In fact, it is not only clearly visible, but it is also confirmed by the volume. On the first (multi-year) chart I was unable to analyze volume, since the SLV ETF has been introduced in 2006.
The important point is that the volume is decreasing in the "handle" part of the pattern i.e. in recent weeks. This signals that silver is not beginning a new downleg here, but is rather taking a pause, as price falls rather due to the lack of interest, than because of the fact that investors are desperate to close their positions. The declining volume can be interpreted in the following way - investors are on average waiting for a better moment to add to their positions, but are rather not exiting their positions in a rapid manner. This is exactly what I would expect to happen during a "breather", so I will proceed with presenting my best guess, as far as timing the bottom is concerned.
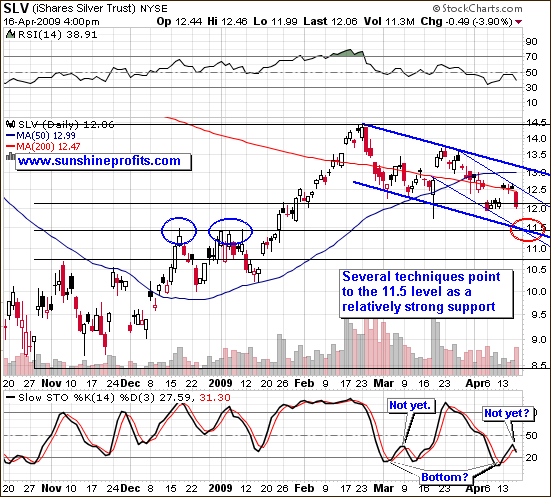
As you may see, many techniques point to the $11.5 level on the SLV chart as a solid support. Both, monthly and weekly trend channels point to the $11.5 level as an important support level, which could mean the end of this correction. The 50% Fibonacci retracement level also points to the $11.5 as an important support. Moreover, this level has already proven itself as a resistance in December 2008 and January 2009.
The Stochastic indicator has just signaled that what we have seen up to date was not the final bottom for this correction. Silver closed $11.89 on Friday, which is very close to the abovementioned $11.50 level. This means that investors, who are long-term oriented, and/or have been waiting to invest a large share of their capital in silver (this applies to other precious metals as well), may want to begin their purchases even without waiting for the Market Alert from me. With long-term capital the risk is to be out of the market, not to be in it. After all, we are in the bull market, and we are not near a top, so making long-term investments in this sector is justified.
With a short-term trade in mind, it seems that we are approaching another speculative buying opportunity. Still, I would ideally want to see a reversal on a significant volume in many precious-metals-related markets: gold, silver AND corresponding stocks. Even if price of silver and other PM-markets break through the support lines intra-day, but reverse and end the session above it (on a strong volume), I will consider this a speculative buy signal. Should that take place, I will send a Market Alert, but since volume is a factor here, I may do so near the end of the session. I've described details above, so that my alert would be a surprise for you.
There's one more thing that I would like to write about before moving to other markets. As I mentioned at the beginning of this essay, silver market is much smaller than the gold market, and as such it is more vulnerable to short-term manipulation. The same applies to big up/downswings caused by a large entity moving in or out of the market. This means that one has to be careful when applying the technical analysis to the silver market. With many small entities on the market, price spikes would be caused only by very important psychological mechanisms, and this would be very important from the "technical" point of view. If millions of small investors "voted" with their money that silver should go this or the other way, then you don't want to ignore it. However, if one entity with enormous capital thinks "hey, it seems that we'll go lower this week, so I'll short the market today, and cover next week", pushes the button and causes a brutal (yet, temporary) sell-off, then you don't really need to take this into account. The problem is that it is difficult to read from a chart if it was one big entity or millions of small investors that have sold/bought at a particular moment.
Therefore, we must approach the silver market with particular caution. The direct implication of the above analysis is that if we get a move in either direction in silver that would have critical implications (i.a. breakdown through a very important support/resistance level), but it is NOT confirmed by a similar move in other markets, there is a big chance that this move is a "fake" one. Most of the time technical analysis does work with silver, but there are times when it does not, and we must take that into account while making our investment decisions. You may want to read this reply for more details.
Gold
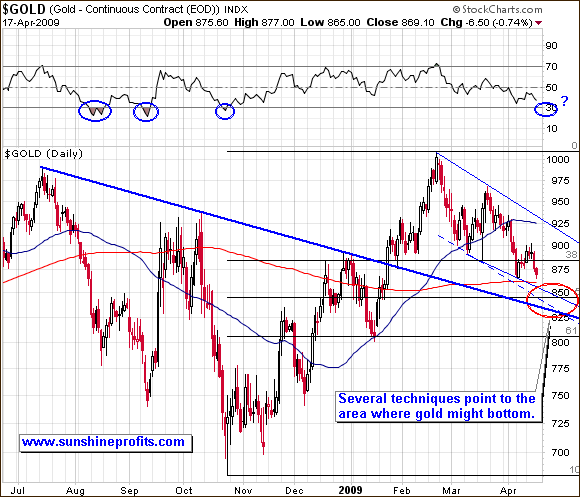
There is not much new to report about the gold market, especially given the high correlation of gold and silver and the fact that the situation on the silver market has already been covered. Generally, the situation is developing as indicated in the previous Premium Update. Based on what I infer from the silver market and from PM stocks, it seems that we may not get as low as I previously indicated - to the thick blue line. Currently, I view a drop to the 50% Fibonacci retracement level and the dashed thin line as more likely. Still, a substantial intra-day drop to the $830 level and a sharp rebound above $850 would be a very bullish signal. I will keep you updated.
Gold / Silver Ratio
I realize that many of my Readers might be interested in trading the famous gold / silver ratio, so I believe I should comment on it at least a briefly. I have written about this ratio in the past, but that essay covers only the general characteristics of the correlation between two most popular precious metals. For a quick update on the current situation, please take a look at the following chart:
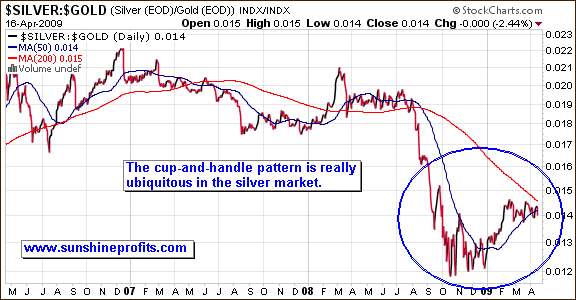
I used the silver-to-gold ratio, instead of gold-to-silver one, as I personally prefer to analyze it this way. This is the same data - it's just another way to "slice it". Silver is more volatile than gold during upswings and downswings, which causes the silver-to-gold ratio chart to be similar to the chart of silver itself. The benefit of this approach is that it is easier to spot divergences between the ratio and silver itself.
As you may see, not only has silver itself formed the cup-and-handle pattern in long- and short-term, but the same can be said about the silver-to-gold ratio. I have already written about the characteristics of the cup-and-handle formation in this update, so I don't think I need to do it once again in this paragraph. In short - this chart looks bullish for silver-to-gold ratio, and for silver. In other words, it seems that the gold to silver ratio will continue to decline in the following months.
Precious Metals Stocks
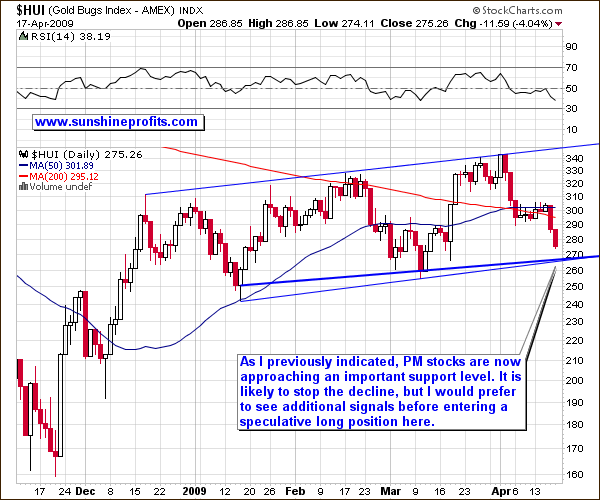
PM stocks seem to be completing the zigzag decline that I mentioned last week, but I would like this market to bottom along with gold and silver, before calling THE bottom. There is also another important factor that needs to be considered here - the general stock market.
Other Markets
I have dedicated a large part of the previous Premium Update to the general stock market, and the financial sector, as it has often proven helpful in determining the direction in which the market will head next.
Market holiday caused a temporary pullback, as indicated a week ago, but the decline was not as dramatic as I expected. Moreover, market rose in the following days and is now higher than it was when I sent the previous update. The key question here is, if we will rally from here, or was I just a week too early in expecting a local top.
The financial sector has declined very modestly and then continued to rally. Please take a look at the below chart for details.
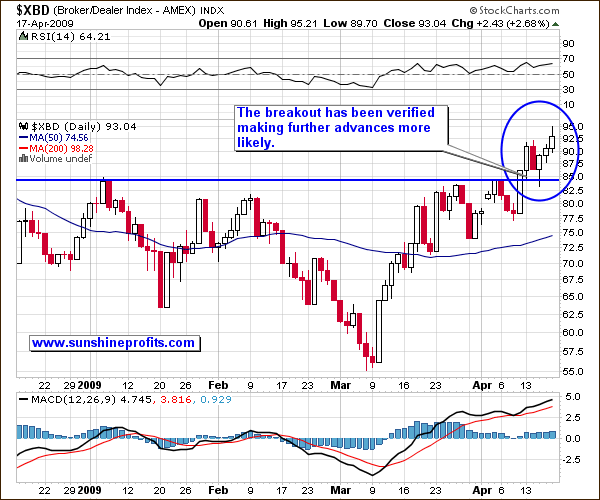
As I wrote a week ago, for the time being, if the financial sector thrives and the commodity sector lags, the probability of a quick plunge increases. For now, previously mentioned commodity stocks: RTP and BHP are trading near their recent highs, so the probability of immediate plunge is much lower than a week ago. Under those circumstances I would normally close my remaining position in the May put options on RTP and GS, but this time, I will keep them as a hedge (I will get back to his later in this update).
The general stock market itself still looks bearish. Please take a look at the following charts of DIA and SPY ETFs. DIA is the proxy for Dow Jones Industrial Average, whereas SPY is the proxy for the S&P Index.

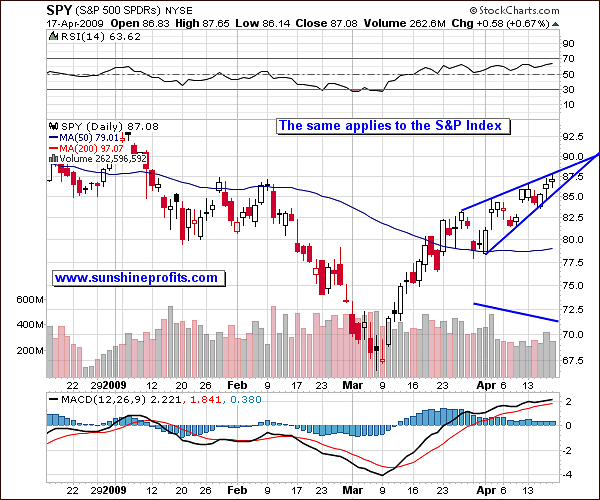
Most rising wedges break to the downside, but we cannot rule out the possibility that it will break to the upside. This may be the case especially taking into account the very recent performance of financials and commodity stocks.
Summing up, currently there are factors pointing to higher values of the general market indices, and there are factors pointing to lower values. Therefore, the situation remains unclear. The direction in which the general stock market will head in the coming weeks is one thing, but the way in which the PM sector will react to it, is also important. In recent weeks PM stocks have declined ALONG WITH the increase in the main stock indices, so it is not so obvious anymore that a decline in the DJIA and SPX would trigger similar sell-off in the PM sector.
Summary
Long-term PM Investors can add to their positions in metals, regardless of what happens in the next few days. Still, I would wait with the purchase of the PM stocks.
Short-term Speculators/Traders:
Gold and silver are approaching their "speculative buy" levels and if you are interested in trading them, you might want to place your orders now, or wait for the final confirmation from me. If we go below the $845 in gold and $11.50 in silver and bounce on a strong volume, you may want to purchase even before you receive my alert, because it may take me at least several minutes to write, test and finally send it. If the coming session is very volatile (and we cannot rule that out), these minutes could mean a several dollar move in gold, which you would rather not want to miss.
Since still I own small positions in GS and RTP May put options I will treat them as a hedge against a general stock market plunge that could drag PM sector with it. I believe that I will soon enter a speculative position in the PM market, so (taking commissions into account) I don't want to exit GS and RTP positions now, only to reenter them a few days later.
The situation is more uncertain for the PM stocks, because of their short-term correlation with the general stock market. It is unclear in which way the general stock market will head next and how will PM stocks react to its breakout or breakdown. It seems that a near bottom and higher prices afterward are more probable and that I will decide to go long soon - but not yet. I will keep you updated.
Speculative Positions
Summary of the previous transaction on April options: RTP options expired, and GS were sold for about 37% of their purchase price. These were very risky trades, so we limited our exposure. In sum, this transaction lost about 4.5% of our speculative capital.
Accumulated profits for 2009 now amount to (1 + 77.2%) * 96.5% - 1 = 71%
Other information
Premium Updates are posted on a weekly basis BEFORE U.S. MARKETS OPEN ON MONDAY.
We are sending e-mail notifications when we post new Premium Updates. If you are not receiving these e-mails, please make sure that you have added us ([email protected]) to your address book / 'safe sender list'. You will find more information here.
Thank you for using the Premium Service, have a great week!
Sincerely,
Przemyslaw Radomski

