
Since many of you enquired about the Market Alert that I sent on Wednesday, I will start this update by explaining factors that led me to sending it and make a few digressions (relevant also to the long-term investors) along the way.
As I explained in the alert itself, I didn't want to go into details back then, as it was not until about an hour before the market's close that I was sure that keeping my long positions open was not reasonable anymore. This time volume was a very important factor and it was unclear until we got close to the end of the session that the volume will indeed be so low. First hours of a session might serve as an indication of volume at that particular day. However, since there were many times, when it was the second half of the session when volume increased substantially, I wanted to make sure that what I am about to send you is based on solid signals.
Market Alert - Details
For the convenience of reading, I will quote each point raised in the Market Alert and provide an explanation below it.
Today the HUI index and XAU have reached their previous highs after a quick two-day rally. The volume, however, is very low. It is not very common for a breakout to take place after a rally on a tiny volume, and even if we do get past the resistance level, I would consider the following rally doubtful.
We don't need look far in the past to see examples where this similar signal marked the end of a particular rally. Please take a look at the chart below (charts are courtesy of stockcharts.com).
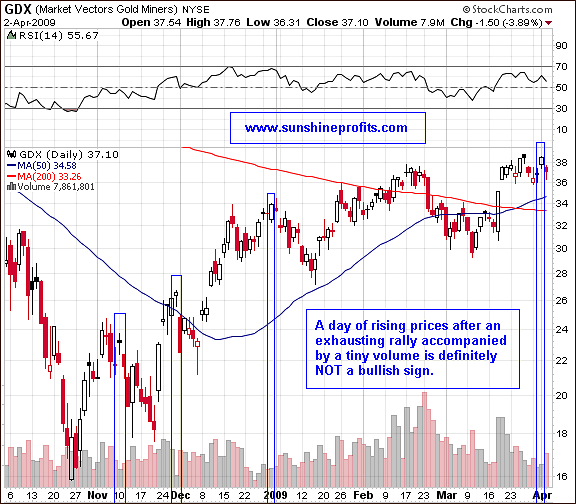
Each time prices rose after a substantial rally, but it happened on a low volume, market was reversing exactly on that day, or it was very close to the reversal day. As I explained a week ago:
It means that the buying power is drying up. (...) without fresh capital entering the market, prices cannot rise. When prices cannot rise, they will either trade sideways or slide. Since the size of the rally was impressive, the latter is more probable, as momentum traders realize their gains and make the price more vulnerable to a short-term sell-off. After such an impressive rally many investors wait for any signs of weakness to take profits off the table. If price gets to these important resistance levels and bounces just a little, it may cause these investors to get out of the market, thus intensifying the decline.
That is exactly what we have seen in the last two days. Usually, the bigger the gain and the smaller the volume are, the more reliable this signal gets. In my opinion what we've seen on Wednesday was enough to close my long position, but not necessarily convincing enough to open a short position. Opening positions against the major trend (which is naturally UP for the PM sector) is particularly risky, thus I prefer not to proceed until I'm very convinced that we will indeed go lower.
The high-quality gold/silver stocks are now lagging behind the sector, and previous laggards catch up - all of this often signals that a top is near.
In this particular situation the performance of the gold stocks is more important than the performance of silver stocks, as the latter are more correlated to the general stock market. First, let's define what I mean by a high-quality stock. In general high-quality PM stocks are gold/silver producing mining companies with strong balance sheets and geographically diversified world-class projects and are generally known in the business. Since these companies are rather diversified in many ways and are properly managed, they are a good proxy for the underlying metals and market perceives them as such. This simple analysis has several important implications and I will focus on few of them.
First of all these are mostly stocks with the highest EXPOSURE to gold/silver. This is particularly important factor for long-term investors. After all, you are in this sector for a reason, and that is probably to profit on rising prices of silver and gold. To make sure that your money are betting on what you really want them to, you might want to purchase stocks with the highest exposure to the metal itself. Of course another way to achieve similar results is by using diversification - this is one of the reasons as to why it is so important in the case of junior mining stocks.
It is convenient to measure particular mining stock's exposure to the underlying metal using the R-square parameter. I have explained the use of this statistic in the past, so I will not cover this deeply again here. In short - the R-square coefficient is also known as the coefficient of determination - in this case it measures "how much gold/silver stock's value is determined by the price of gold/silver". The R-square values vary from 0% to 100% and the closer the value is to 100%, the more exposure to gold/silver a particular PM stock has.
So... is the R-square value anything that we need to know about the stock to determine if it's worth investing in?
Of course not. We also need to take leverage into account and check if the stock moves on average in the same direction as the underlying metal.
For instance, junior companies have usually relatively low R-square values, and they are very emotion-driven, however, at times juniors offer substantial leverage that makes them appealing to investors. For example a company will have lower R-square value if it makes an impressive discovery that makes its share price soar. That would be the case because it was not the rise in the price of the underlying metal that would have caused this rally; it was the discovery itself. Additionally, the R-square statistic provides you with information that comes directly from the market. This means that by using it, you make an assumption that market's judgment about this particular stock is at least believable.
Still, for the big, senior gold/silver companies the R-square coefficient is very likely to provide investors with valuable information. After all, these stocks are mostly listed on prestigious exchanges and provide investors with very reasonable liquidity. This attracts institutional buyers, which usually have competent research teams and they position themselves in stocks with the soundest fundamental situation. This means that they will purchase stocks that I referred to as the high-quality ones. The important point here is that these investors are usually (!) rather unemotional and purchase PM stocks as a proxy for gold/silver. Therefore, they will buy stocks, when they believe that gold/silver are going higher and will sell when they think that gold/silver are going lower. This factor alone makes high-quality PM stocks more in-tune with the price of gold/silver. This means that this stock becomes more attractive to other institutional investors and so on. Summing up, sound favorable fundamental situation + high liquidity = rather high and reliable R-square values.
Apart from the R-square values, the high-quality stocks are known to rebound faster after a decline. This is visible in both: long-term and short-term, as institutional investors are rather quick to put a lot of money in a particular sector at the beginning of a new rally, and to take it out, as the rally is ending. These companies are mostly reasonably leveraged to the price of gold/silver and of course move in the same direction as the underlying metal. Naturally, these are just general rules and there are exceptions. I will get into reasoning and other uses of this phenomenon in my future updates. For the purpose of this analysis I will take Agnico-Eagle Mines Ltd. (AEM) and Kinross Gold Corporation (KGC) as examples of high-quality stocks. On the other hand, Harmony Gold Mining Co. (HMY) and Gold Fields Ltd. (GFI) will be used as examples of laggards. I'm not saying here that these companies are improperly managed, etc. I'm saying that I'm reading this information directly from the market and I believe that it is usually profitable to use this information.
Please take a look at the following charts:
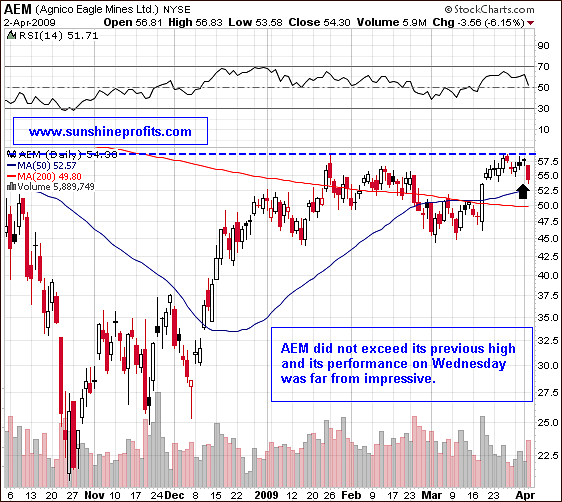
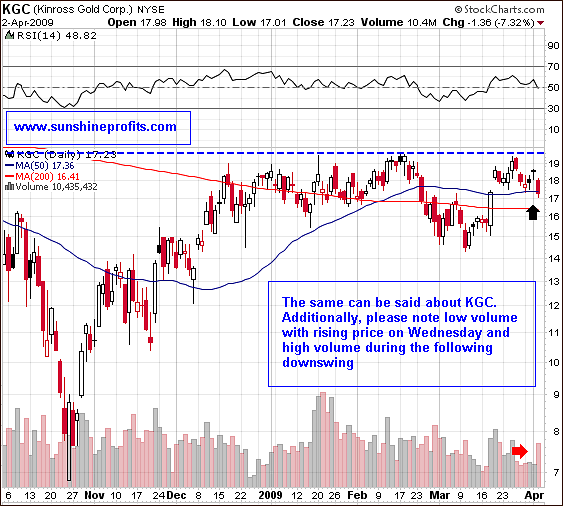
As you may see, since January these companies were definitely not outperforming the sector. This alone indicates only that we are no longer in the extreme (!) oversold territory. However, it is the performance of both stocks on Wednesday that served as the factor that led me to sending you the alert e-mail. This is especially significant, if one compares it to the performance of other abovementioned stocks: HMY and GFI.
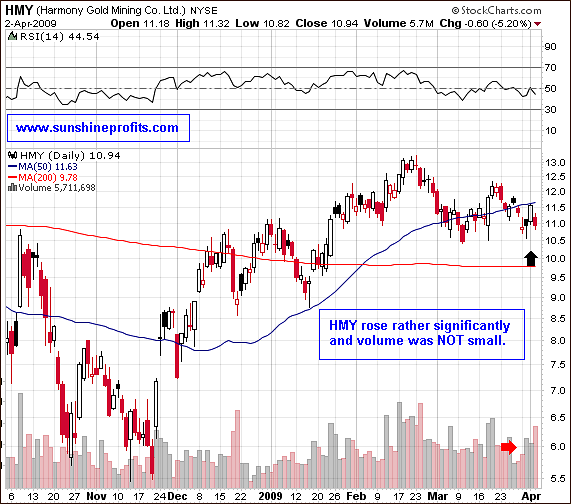
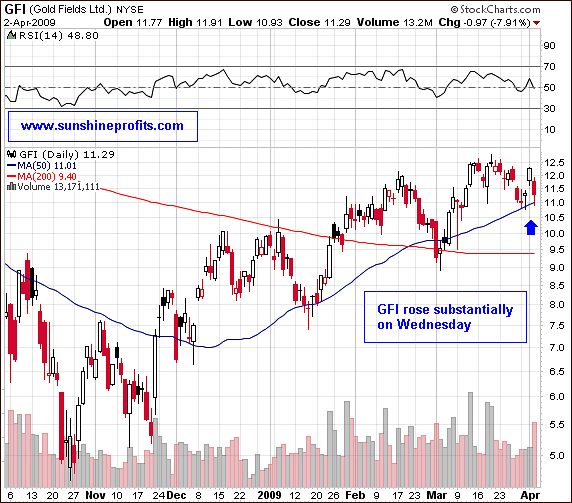
Gold Fields' and Harmony Gold Mining's share prices rose significantly. Please note that the trading volume of the latter company was not really that small. This is also a subtle clue that we might be going lower in the short term. Usually stocks lagging the sector and that are not following gold/silver closely, have good reasons for it. Smart, rather unemotional money realizes that and stays away from these companies. Therefore a large part of the volume is usually generated by emotional investors/speculators, which tend to enter the market exactly at the top or very close to it. Don't get me wrong here - there's nothing wrong with being emotional, however it is best not to follow your emotions when it comes to making investment/trading decisions.
In the latest Market Alert I also attached a link to the chart presenting gold. Its quality was rather poor, because I wanted to send you this alert as soon as possible. I believe that this was a good approach, because I have received e-mails from many investors, who did manage to close their positions on Wednesday.
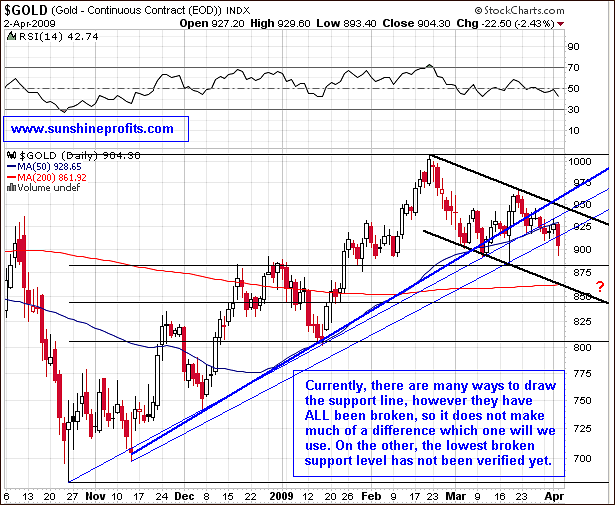
We have clearly broken below the lower border of the trend channel, no matter how one would decide to draw it. A pullback to test the lowest of rising trend lines is not out of the question and this may mean another opportunity for a quick profit by betting on declining prices - however I would need more reasons to enter a position against the major trend, than just a rise in the price of gold - I will keep you updated.
Since many of you asked me how low we could go, I have added several additional support lines to the above chart, to provide you with a rough estimation. Right now touching the lower descending black line looks probable, and this could happen a few weeks from now. That would correspond also to the 50% Fibonacci retracement level. Markets often correct half of their gains before resuming their previous trend, and we may also see it in the gold market. Please note that this is NOT a prediction, but rather my best guess here, and I'm providing it here, because many of you asked me to. I personally prefer to enter trades when I have more details regarding particular situation.
Since I already created the above chart, please note how often these Fibonacci levels have marked important support/resistance levels. That's why I use them in my analysis so often - because it works - especially on the precious metals market.
I have prepared also additional chart for the gold market - the GLD ETF chart.
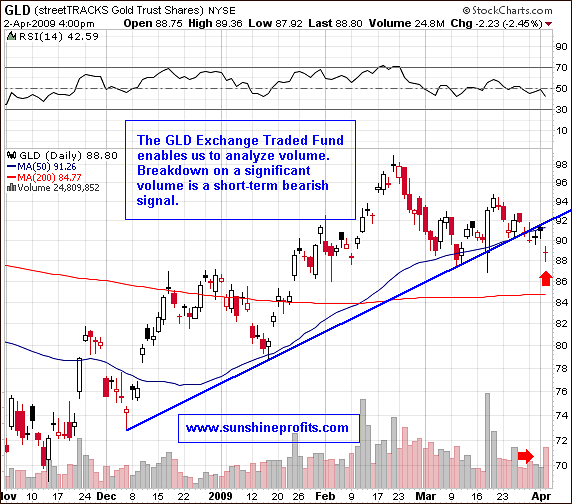
The additional factor that I find important here is the fact that gold itself has also broken below the recent trend line on a high volume. This is a "confirmation" signal, meaning that if the same breakdown took place on a small volume, I would not be so convinced that we are indeed going lower.
Gold / Dollar Situation
Several readers asked me about the fact that gold declined together with the U.S. Dollar. First of all - the natural correlation for gold and USD Index is negative. This has proven true during many years of this bull market, though from time to time particular analysts write about gold decoupling from the dollar. In a strict sense, gold cannot totally decouple from the dollar, as this is the currency it is priced in.
On the other hand, there are many more fundamental factors influencing the gold market than just the USD market, and they also need to be taken into account here. If one of these factors (precisely: the way market perceives it) influences the dollar market in the same way that it influences gold and silver, then it is possible that both: USD Index and precious metals will move in the same direction. This brings us to the conclusion - the factor that influences USD and gold in the same way (at least currently) is fear. In fact, I wrote about this irrational phenomenon last Friday:
The powerful rallies that we have just witnessed are in my view caused by the irrational flight to safety. U.S. Dollar has long been considered "the safe currency" and many central banks, financial institutions and individual investors still perceive it as such, regardless of the true fundamental situation. At some point these entities will become aware of the fact that the assets that should be purchased with safety in mind are the precious metals, not paper dollars. However, at the time being, they either don't realize how bad the dollar's fundamentals are, or they act emotionally. Most likely both reasons are true, as there are many entities on the market. Either way, the reasons for a rising USD are temporary, just as the rebound is. I'm not saying here that we will not go higher temporarily - we may, although that seems unlikely - all I'm suggesting is that this is not the change in the main trend.
I view this as highly probable that this time it is the decreasing amount of fear that led to lower prices of USD and gold. It was just a week ago, when I wrote that Gold is once again trading in the opposite direction to the USD Index (...), yet this has changed once again. It is difficult to say, when will markets stop perceiving U.S. Dollars as a safe haven, but I will monitor this situation are report to you accordingly. For now, the direct implication is that for now, signals for the USD market do not automatically translate into signals for gold/silver.
Other Markets
The silver market is still holding relatively well, but I view this as a result of the recent high correlation with the general stock market, which hasn't declined yet. The points mentioned in the previous update are still relevant today - I still consider at least a brief decline in the general stock market as the most probable outcome in the next several days/weeks. Should that be the case, I think that silver will follow gold and DJIA and also head lower. The same goes to silver stocks and also commodity stocks in general. Especially the latter (for instance: Rio Tinto - RTP and BHP Billiton - BHP) have experienced a very powerful rally and look like a correction is needed.
Summing up...
Long-term PM investors (gold, silver, PM stocks) should not be troubled by this correction and wait for signals to add to their positions.
Short-term Speculators/Traders might want to wait for additional signals before entering new positions. This regards both stock and option traders.
Summary of the previous speculative transaction:
We have just finished the trade which I suggested opening on March 18th. The alert that was sent back then, was just as quick as the one that I sent on Wednesday and I didn't give out exact position sizes regarding particular stocks. Therefore, in order to summarize this trade's performance, I will use the average - the GDX ETF. On March 18th, GDX closed a few cents above $35, so the instruction that I sent (As far as strike prices are concerned, I prefer out-of-the-money options, but those that are relatively close to the price of particular stocks at the moment of purchase) mean that the strike price that I should use here is $36.
I wrote about using 10% of one's speculative capital to purchase call options expiring in April and 17% (17% is such a weird number, why did you use it?) of one's speculative capital to purchase options. Before I continue, I would like to point out that the fact that I used options in the past does not mean that I will write trading suggestions only for option traders. On the contrary, I will strive to provide commentary relevant to speculators/traders whether they choose to use options or not.
Details for April options:
The highest price that these options achieved on that day was $2.3, so we will conservatively use this price as our entry (the update was sent close to the end of the session)
The price on April 1st closed at $3.5, but just in case someone sold little earlier let's use the conservative $3.3 as our exit price.
Total profit on this transaction is therefore: $3.3/$2.3 - 1 = 43.5%
Details for June options:
The highest price that these options achieved on that day was $4.1, so we will conservatively use this price as our entry (the update was sent close to the end of the session)
The price on April 1st closed at $5.6, but just in case someone sold little earlier let's use the conservative $5.4 as our exit price.
Total profit on this transaction is therefore: $5.4/$4.1 - 1 = 31.7%
Calculating profitability taking into account suggested position sizes:
10% * 143.5% + 17% * 131.7% + 73% * 100% (cash) - 100% (initial capital)= 14.35% + 22.39% + 73% - 100% = 9.74 %
If one stocks instead of options the profit would amount to roughly $38.5/$35 - 1 = 10%
I believe these results are not that bad for a 2-week trade.
Therefore, our speculative accumulated profits for 2009 now equal 161.5% * 109.74% - 1 = 77.2%.
Naturally, I don't claim to have a crystal ball and to be correct each and every time, but I believe that my results may serve as an indication that my service may prove worth many times more than the several-buck investment that one needs to make to use it.
Since many investors reading this update were able to read it thanks to the initial 10-day bonus that everyone got as I launched the Premium Service on March 27th, I would like take this opportunity to remind you that
Unless you take action, you will lose your access to the Premium Service in a few days
You will still receive a basic market commentary from me, but that version will not contain many (the most important) details, and you will NOT receive Market Alerts. If you find my service useful and decide to keep your access to it, your bonus (free) days will be automatically added to the new paid-for period.
In order to proceed:
1. Go to "My account / Log in" in the menu on the right side of the page
2. Edit your profile my using the "Membership" sub-menu and enter your last name and address details. There are two boxes in the "First & Last Name" row - please make sure that you enter your last name in the second box (it is most likely currently filled with -----).
3. Choose the payment system from the table in the middle of the screen and click the "Order" button.
4. If you encounter any problems along the way please do not hesitate to contact us at [email protected]
Thank you for using the Premium Service! Have a great weekend!
Sincerely,
Przemyslaw Radomski

