This week we sent out a Market Alert, short, because time was a factor. We saw gold move more than $20 lower Tuesday to about $1160. The GLD ETF was very close to the $113 level, which is our first target for the decline. We have been saying for quite some time that gold is due for a correction, so the recent declines did not catch Premium Service Subscribers by surprise.
The popular press is running stories about gold that give you the impression that the global economic problems are solved and that investors' risk appetite has returned with a vengeance. Take a look at some of the headlines:
"Gold falls to three month low as economy jitters fade."
"Gold closes at 3-month low as safe-haven demand fizzles."
"Gold drops as European worries wane."
So, economic jitters have faded, safe-haven demand has fizzled and worries have waned. That's nice. It's nice to know, in the words of one of our favorite poems by Robert Browning, that "God's in his Heaven - All's right with the world!" The Greece problem - and the fear of contagion to Spain, Portugal and Italy - has been 'solved.' The Gulf of Mexico oil leak has been ‘plugged.' The exorbitant budget deficits have ‘disappeared', governments are bent on austerity and the world appears to have lost interest in gold.
That is no sweat off our back. We believe that gold is likely to move higher in the short run, as confirmed by the RSI and Stochastic indicators. It means that when that happens it will be an opportunity to take profits off the table, or for short term traders to bet on lower values in precious metals. Of course we will get back to this issue in the following part of the update.
Gold has consistently been lower in the July-August timeframe and in many cases formed the buy-point of the year. To buy an asset when it's in a decline is counterintuitive. It's like buying a skiing jacket and boots in the middle of the summer. You have to move against the herd and buy when others are selling. Again, the situation is more complex than the above if short-term speculation is concerned, and we will get back to this topic soon.
More American Families Facing Economic Hardships
American families are experiencing real pain and it's only going to get worse, according to new analysis for the Rockefeller Foundation that shows that Americans are more economically insecure now than they have been in a quarter of a century.
Joblessness and skyrocketing medical costs are among the biggest factors, according to analysis done by a team of researchers led by Professor Jacob Hacker of Yale University. They created an economic security index, which measures the percentage of Americans who experience a decrease in their household income of 25 percent or more in one year without having the financial resources to offset that loss.
The team's findings were bleak--more and more families are facing complete economic devastation: out of money, with their jobs, savings and retirement funds gone, and nowhere to turn for the next dollar.
All of the data for 2009 are not yet in, but the research team projects that more than 20 percent of Americans experienced a 25 percent or greater loss of household income over the prior year - the highest in at least a quarter of a century. As the study points out, the typical individual who experiences a decline of at least 25 percent in household income requires between six and eight years for income to return to its previous level.
In hindsight we know all this pain was caused by the subprime mortgage mess and the falling-domino problem that allowed mortgage defaults in the United States to clog up the global financial system because of the complex connections among banks, investment companies, insurers and other firms around the world.
The cost of the recent crisis in terms of lost production and high unemployment has convinced officials, regulators and some analysts that government should do more to cool down markets that seem to be growing too fast, and in the process try to ensure that global markets don't again boom in an unsustainable way. The bad news is that they believe more regulation is the key to achieving long-term success. We humbly disagree, as we believe that excessive money supply (provided in a "regulated" manner) was the root of the problem in the first place.
"Systemic Risk" is the New Buzz Word
We know that the Fed doesn't seem to pay any attention to asset bubbles when they grow. They only flood the system with cash when bubbles burst. After the bitter experience of the past two years, there is a new term that has entered the discussion in economic and policy circles-- "systemic risk."
It is defined as the risk of collapse of an entire financial system or entire market, where systems are interlinked and interdependent. The failure of a single entity or cluster of entities can cause a domino effect of cascading failures, which could potentially bankrupt or bring down the entire system or market.
"Systemic risk" is a relatively new term that has its origin in policy discussions, not the professional economics and finance literature. According to a recent Washington Post article the "Systemic Risk" theory in gaining in stature as a way to prevent the next bubble from forming. The phenomenon is not fully understood. Also, it is not easy to tell the difference between a risky "bubble" and healthy economic expansion. Some would say that if something rises in a parabolic fashion then it is a "bubble", but that doesn't have to be the case. The thing that one needs to consider in the first place are the fundamentals. We believe it makes much sense to speak of a "bubble" if an asset is clearly above its fundamental value. Were gold, silver and mining stocks in a "bubble" lately? We would not say so.
Perhaps some Americans are counting on the day when home and retirement-fund values will start to rise again and make up for their losses. But economic policymakers around the world are looking for ways to make sure that doesn't happen, or at least not with such force that it risks the kind of bust that usually follows the boom.
In studying how to respond to the recent crisis and create a more stable system, central bankers, international officials and others have been focusing on "systemic risk." Policymakers in the United States and Europe and at organizations such as the IMF are discussing how government agencies could best intervene when markets begin to overheat. That's right - first interevene the money market by creating massive money supply and then intervene, so that it doesn't cause any problems. But it will, as the inefficiency associated with managing the markets to even bigger extent will ultimately come back with a vengeance.
Before the recent crisis, regulators assumed that markets with large numbers of well-informed people who have the ability to move money freely could reasonably assess the risks of various investments. This is simply not true because people often act emotionally, not logically and this - given loads of money being printed - creates "bubbles". This created the conditions that allowed millions of Americans to buy homes and borrow money under fast and loose credit terms. Consumers profited if they sold property at the right time, but we know of too many saddled with unaffordable mortgages or houses that declined sharply in value. The current discussion involves some of the basic principles of how markets should work in a post-crisis age and throws open a range of sensitive questions.
The legislation signed into law last week by President Obama includes a Financial Stability Oversight Council, with powers to study and move against possible sources of systemic risk in the United States. Europe is establishing a European Systemic Risk Board and the IMF has proposed a central role for itself in monitoring systemic risk on a global scale.
Some sources indicate that it is possible that we are seeing a subtle but significant shift within the Federal Reserve over the course of monetary policy amid growing signs that the economic recovery is losing steam. On Thursday, James Bullard, the president of the Federal Reserve Bank of St. Louis, warned that the Fed's current policies were placing the American economy at risk of becoming "enmeshed in a Japanese-style deflationary outcome within the next several years." Bullard is a voting member of the Fed committee that determines interest rates. His warning comes days after Ben Bernanke, the Fed chairman, said the central bank was prepared to do more to stimulate the economy if needed. As mentioned previously, we will wait to see some kind of action behind the "restrictive rhetoric" before taking it seriously.
Free Lectures on Austrian economics
We have discussed in past Premium Updates Austrian economics and how it differs from its Keynesian rival. There is an opportunity this week to listen online to lectures on free market economics taking place at the bastion of Austrian economics, the Ludwig Von Mises Institute.
To see who will be speaking, when, and on what topics, click here. Additionally, you can download lectures that have already taken place.
To see what the hot days of summer have in store for gold, silver and mining stocks let's begin this week's technical part with the analysis of the Euro Index. We will start with the long-term chart (charts courtesy by http://stockcharts.com.)
Euro and USD Indices
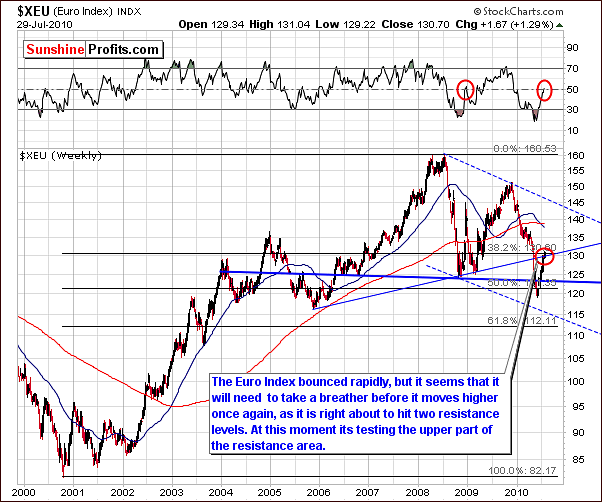
Once again, this week's long-term Euro Index chart shows that there has been little change from last week. Although we have seen upward movement of about 1.5% from where the index was at our last writing, we have seen a struggle for movement above the resistance line created by the lows of 2005 and 2008. This also closely corresponds to the 38.2% Fibonacci retracement level (of the massive 2000 - 2008 rally) and we presently see the upper border of the resistance area being tested.
During a similar period in the past - at the end of 2008, the RSI move to 50 before the euro showed any serious decline. It then moved below 40 for some time as euro tested its previous bottom. This is quite similar to what we have seen recently. The RSI actually dipped into the 20's and has now rebounded to near 50. Although the euro doesn't need to go as low as its previous low (meaning 120 on the above chart) - and we would not recommend basing such forecast based on the RSI alone - there is a possibility that we are very near a local top today with a brief correction likely to be seen in the short-term.
Close inspection of the long-term chart shows how the 38.2% Fibonacci retracement level corresponds to today's index level. This is an important point since the retracement level itself is based upon a noteworthy downswing. Let's take a look at the short-term chart below for more details.
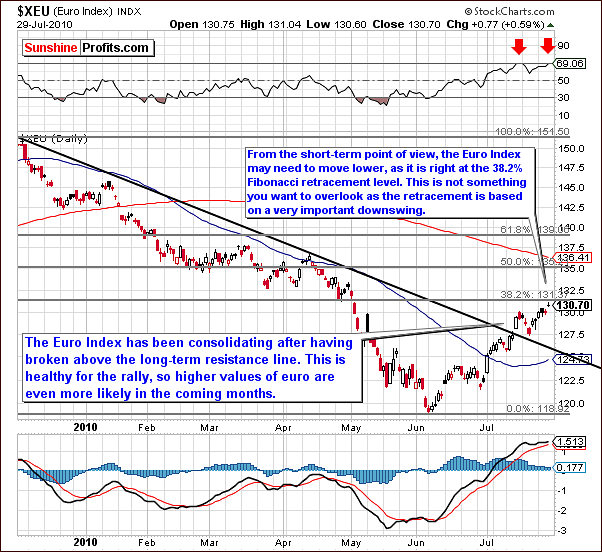
The short-term Euro Index chart confirms a movement above the Fibonacci retracement level created by the 2000-2008 Euro Index rally. This is also true for the retracement level created from the decline seen between December, 2009 and June, 2010. So, in fact we have two Fibonacci retracement levels that intersect at the same level, thus making the resistance here even stronger.
The RSI based on the daily prices is presently near 69 which corresponds to the recent local top seen in mid-July. At this time, we remain bullish for the euro over the next several months or so. A slight move lower may be seen in the short-term which will likely be coupled with a corresponding move higher in the USD Index. The currency exchange rate accounts for more than 50% of the USD Index and for this reason the Euro and USD Indices remain tightly tied in how they react to one another. The implications for gold, silver and mining stocks are positive as well.
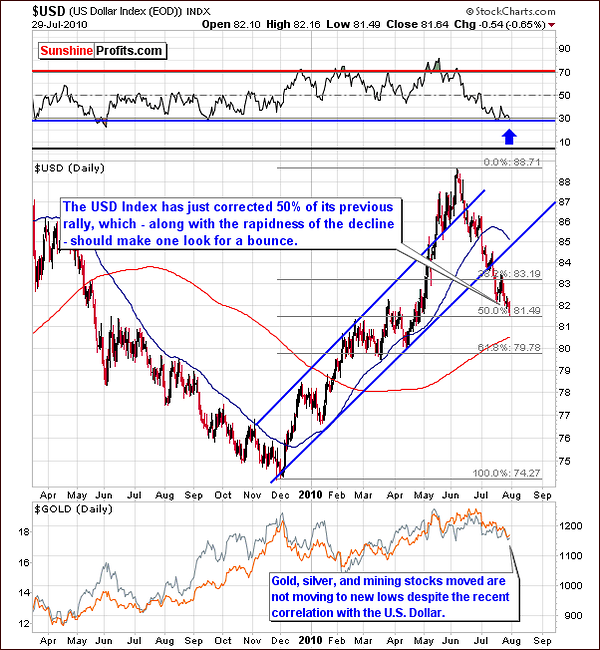
In this week's long-term USD Index chart, it can be seen that the recent move has corrected 50% of the previous rally. This is an important development when it comes to market psychology and the near-term outlook for the index. When we take into account the fact that the decline was quite rapid, it makes it somewhat possible that a bounce will be seen very soon.
Gold, silver and mining stocks have not moved to new lows in spite of the recent decline in the dollar and their previous correlation with it. No significant corrective rally has been seen since the June top and the consecutive downswing, so it is likely that we could see one very soon. Also, the RSI is very close to the 30 level, which often corresponds to local bottoms.
The main point to be made here is the strength of the precious metals sector with respect to the movement seen in the USD Index of late. For example, Thursday saw the USD Index decline while metals did not. These indicators are bullish signs for gold, silver and mining stocks and our next chart will provide a clearer picture of just what we have discussed here.
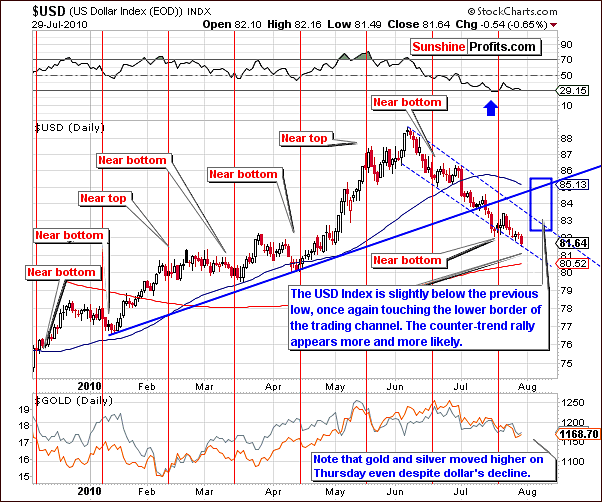
On the short-term USD Index chart this week, we clearly see a decline below levels of the previous, most recent low. This week's decline of approximately 1.25% increases the likelihood that a contra-trend rally could begin fairly soon. Gold and silver moved slightly higher on Thursday in spite of a declining USD Index and this is a show of strength on the part of precious metals in general.
The USD Index is now quite close to a support level, the lower border of the trading channel. There is likelihood that the declining days are thus numbered for this index. The contra-trend rally is more of a possibility based on these recent developments.
Concerning the precious metals sector, gold once again seems to be leading the way with upward movement in the 0.25% range seen on Thursday. For the short-term at least, there is now bullish sentiment for this sector and we will continue to watch as the situation further develops.
Summing up, it seems that the euro and the dollar may see at least slight corrections from their recent rise and fall respectively. Should the dollar rally and a corresponding decline be seen in the Euro Index, it is quite likely that gold will rally even more strongly. This could also carry over to silver and mining stocks.
We continue to be bullish for the short-term for gold, silver and mining stocks but we caution that the summer correction for the sector as a whole has likely not yet completed.
General Stock Market
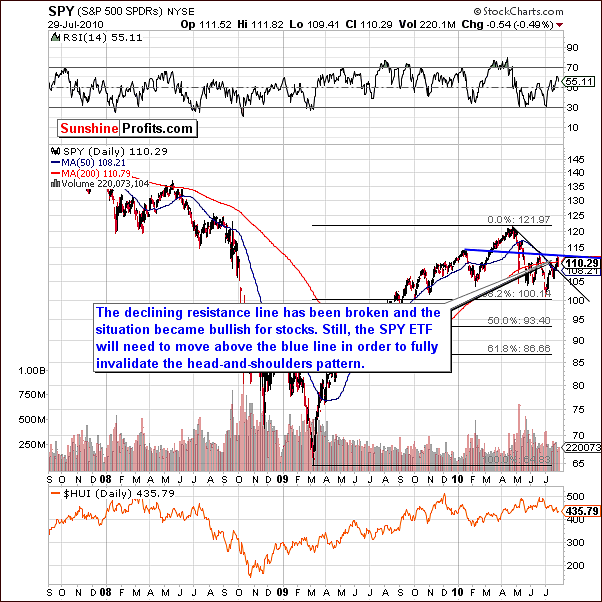
The long-term SPY ETF chart shows that the declining resistance line has been broken. This is a bullish sign for the general stock market. As we mentioned in last week's Premium Update, "The direction in which the market moves next could very well determine the short to medium-term trend. A move in either direction is likely to dictate the general direction for at least the short-term, and this move may very well be significant."
Before we can state that the bearish head-and-shoulders pattern has been definitely invalidated, we need to see a decisive move above the dark blue line in our chart, preferable a move upward with high volume. Should this occur, we would then be more confident of our bullish outlook for the near-term.
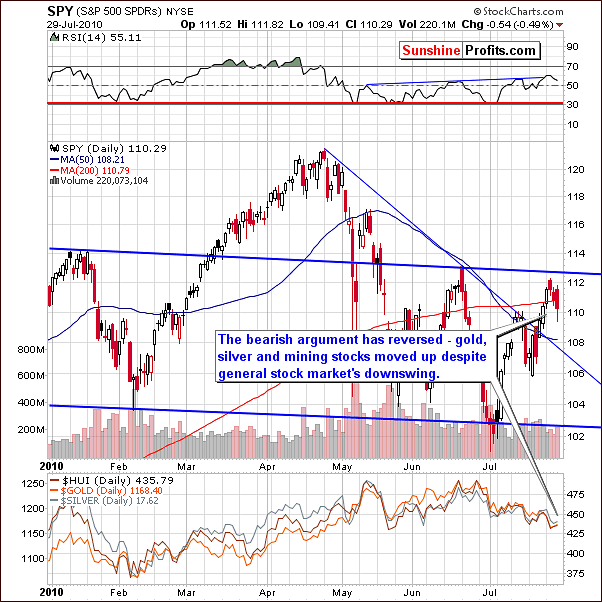
This is indeed good news for gold, silver and mining stocks. Recent moves have been consistent with general stock market increases although this is not visible in the correlation matrix which will be discussed in our next section.
Generally, that is the case because the overall trend for gold, silver and mining stocks was down, and it was up for the main stock indices. However, we still need to take into account that rallies and declines happened during the same time-frames. Of course rallies were bigger in case of stocks, and declines were bigger in case of precious metals, which is the reason for them being in the opposite trends.
In the latter part of July, slight declines in the general stock market have seemingly not impacted gold, silver and mining stocks. In fact, since our July 27 Market Alert, they have out preformed the general stock market with a small percentage increase while the market declined. This is a bullish development for gold, silver and mining stocks. Furthermore, it is quite possible that small declines in the general stock market will have little or no impact on precious metals, whereas upward moves for stocks may cause an even stronger rally for gold, silver and mining stocks. This further contributes to our current bullish sentiment for precious metals in general.
Summing up, the situation appears bullish for the general stock market but we do need a bit more information to invalidate the recent bearish pattern. Ideally, the SPY ETF will move above the 113 level accompanied by high volume. This will confirm the end of the period in which the bearish pattern continually dampened our sentiment.
Gold has been reacting in a positive manner of late and this will likely continue to influence silver and mining stocks in the short-term.
Correlations
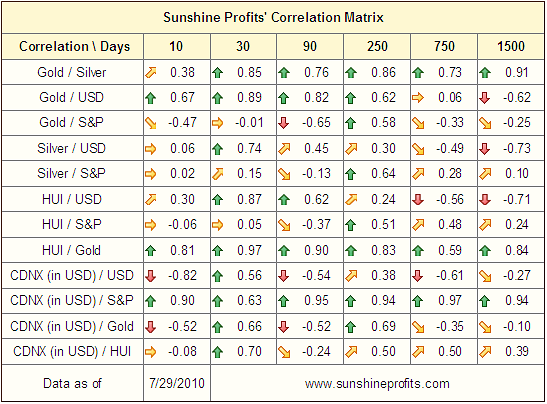
The week's correlation matrix confirms that gold, silver and mining stocks are in tune with the USD Index, which is another way of saying that gold's recent downtrend can be attributed to the strong euro. The last few days have actually seen gold prices rise while the USD Index declined. This is a show of strength for the yellow metal.
The general stock market has also had an influence on the precious metals sector, but that is not visible in the above matrix. The reason for this is that although moving in the same direction, the magnitude is not large enough to be seen in the correlation coefficients. Nonetheless, the implications are still bullish for the precious metals.
Summing up, the analysis of the correlation coefficient values confirm bullish points made above and also in our July 27 Market Alert.
Gold
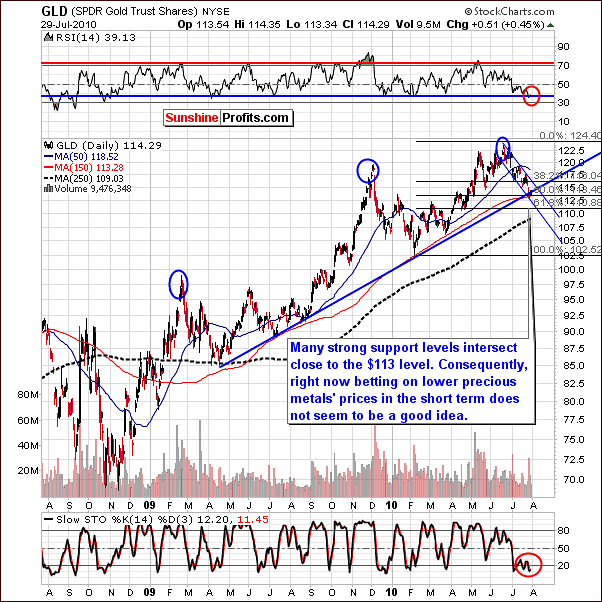
This week's long-term chart for gold is very much in line with our recent Market Alert. Gold's price has actually moved slightly higher since Tuesday and our commentaries made at that time are still valid.
Many strong support levels intersect near the 113 level: the 150-day moving average, the 50% Fibonacci retracement level based on the February to June rally, the lower border of the trading channel, and strong support as indicated by high volume levels. When gold prices decline after a prolonged downward trend and very high volume is seen, this frequently indicates the final day of declining prices. This week's chart indicates the possibility that this may well be the situation at present.
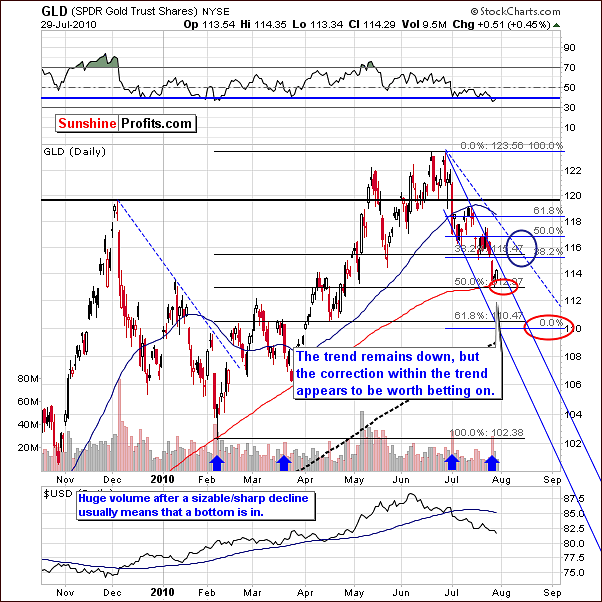
The targets which we projected in prior updates are being reached now. The first target, circled in red in the chart corresponds to the 113 level. A bottom appears to be in, and the contra-trend rally now seems likely.
Investors who were reluctant with speculative capital after reading Tuesday's Market Alert may wish to opt now for a quick trade long or add to positions already taken. The risk-reward ratio appears to be even more favorable as of today Thursday's close. The next target, marked by the blue ellipse above is in the 115-117 level for GLD ETF. Higher levels are possible, but it is too early to set higher targets at this time. We will continue to monitor the situation and advise our Subscribers as warranted.
That's an important statement so we would like to emphasized it once again - based on Friday's intra-day action it seems that we might need to raise our targets for this rally, but we need some more information to do so. We will let you know when we believe that betting on higher prices doesn't seem a profitable thing to do.
Gold-UDN (price of gold from the non-USD perspective) ratio chart
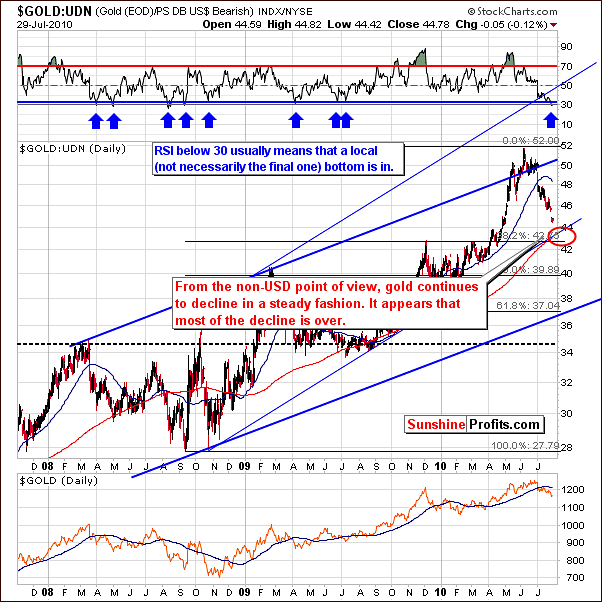
Looking at gold from a non-USD prospective we continue to see a steady decline in price. At this time however, it appears that most the decline is now over. The RSI has moved below 30 and this increases the probability that a local bottom is in. Further confirmation will likely be forthcoming and the bottom we are now close to is probably an initial local bottom and likely not the final one.
The lower section shows gold's daily price from our regular USD perspective. Please note that RSI based on the gold:UDN ratio works not only as a bottom indicator for the ratio, but also for gold itself.
Summing up, gold appears to be starting a contra-trend rally and it seems that it may be a good time to bet on higher prices in the short-term. The next likely target level for gold is $115-$117, possibly higher. Although $119.5 is a possibility, it does not appear very probable at this time. Sunshine Profits Subscribers, as always, will be kept abreast of all significant developments pertaining to the precious metals sector.
Silver
The long-term chart for silver shows that a breakout from the declining trading channel has not yet been seen. With gold prices on the upswing and its strong influence upon silver, we are likely to see this breakout soon. In addition, the $16 level has stopped many declines in the past as we have mentioned in previous updates, so once the rally is over, this might be the level that ultimately stops the following.
Silver is likely to begin a contra-trend rally and may move beyond $18 level for SLV ETF. It is possible that a move up to $18 (or based on Friday's intra-day action even higher) will then be followed by a decline back to near $16. It is important to note however that technical signals are less precise for silver than for gold.
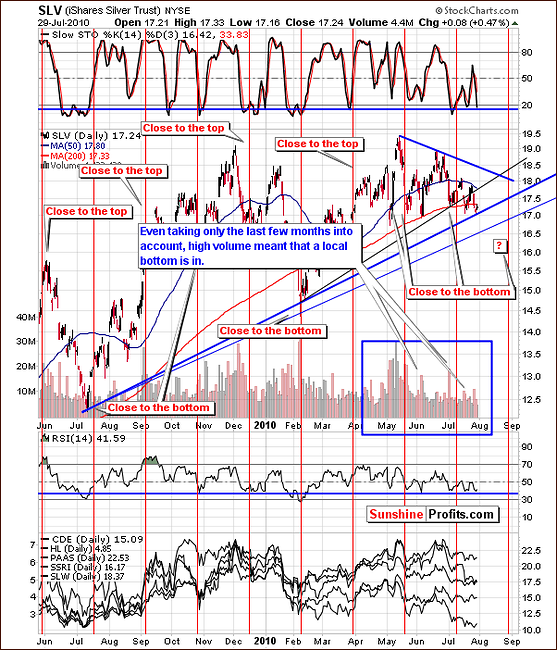
In the last few months high volume has been highly correlated with local bottoms. The above short-term chart clearly supports this statement. In addition, local bottoms are quickly followed by higher prices for the white metal. This confirms points made earlier and is the result of this week's analysis of technical signs for both metals.
Summing up, silver is likely to begin a quick contra-trend rally. Although $18 level may be reached or surpassed, it is important to remember that technical signals are much less precise and therefore target levels less accurate. It is likely however, that silver will follow gold's lead and move higher in the short term.
Precious Metals Stocks
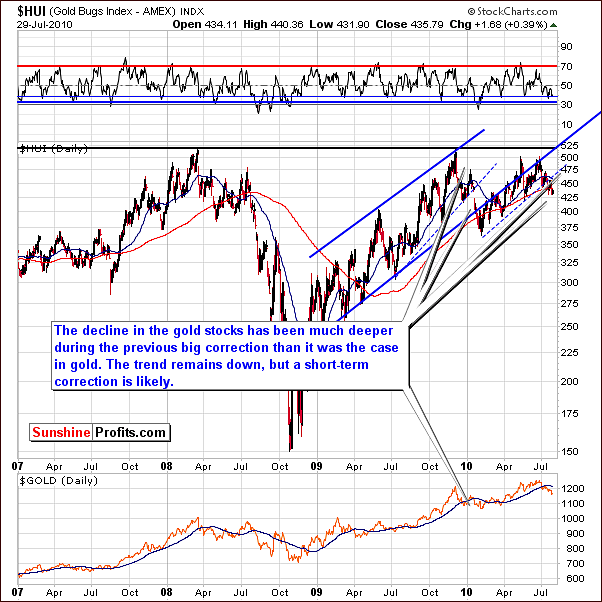
The HUI Gold Bugs Index shows that the decline for gold stocks was much steeper than was seen in the decline of gold itself. Mining stocks have continued to decline, but it does appear that the bottom is in.
The decline has indeed been sizeable. With the RSI near the 35 level and the 50-day moving average right in the middle of the current decline (please note that the HUI Index often used to the 50-day moving average and then again once again moved lower by a similar amount) it appears that a contra-trend rally could take shape very soon. It is also worth noting here that the resistance level would not be approached until a 10-15% increase has been seen. Therefore, the upside possibilities appear to be valid for the near-term.
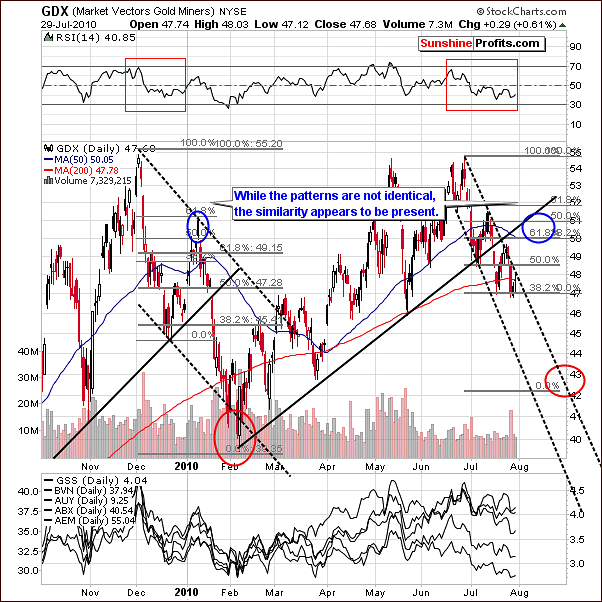
The GDX Market Vectors Gold Miners chart shows a number of interesting anomalies. The RSI pattern of late is relatively similar to one seen at the end of 2009. A decisive, albeit short rally followed, which saw an increase of nearly 10% in a period of about six weeks. This was quickly followed by a prolonged and severe decline of nearly twice the length.
Target levels for the coming rally appear to be in the 51-52 range. Recent high volume levels and the Fibonacci retracement level both support an imminent rally. Based on Friday's price action we have an additional confirmation in the form of high volume.
Summing up, signals coming from the mining stocks confirmed points made earlier in this update. It appears likely that a short-term rally will be seen soon followed by more declines.
Other Charts
Additional confirmations come from the analysis of several other charts. Please take a look below for details.
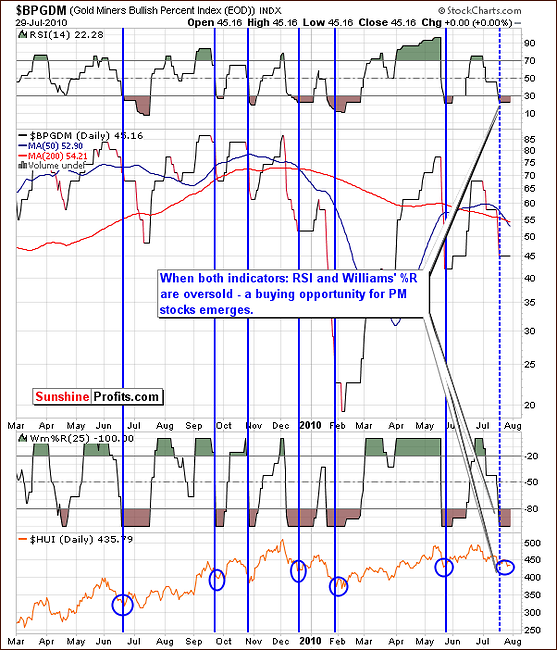
The Gold Miners Bullish Percent Index proved to be a reliable way to confirm tops or buying opportunities. The Williams' %R and RSI together provide additional insight. The message in the above chart is that we are close to a bottom though not necessarily the ultimate bottom. This can be called buy opportunity territory. However, given virtually every other factor mentioned in this update, it seems that the bottom is in.
The particularly interesting confirmation comes from the analysis of the GDX:SPY ratio.
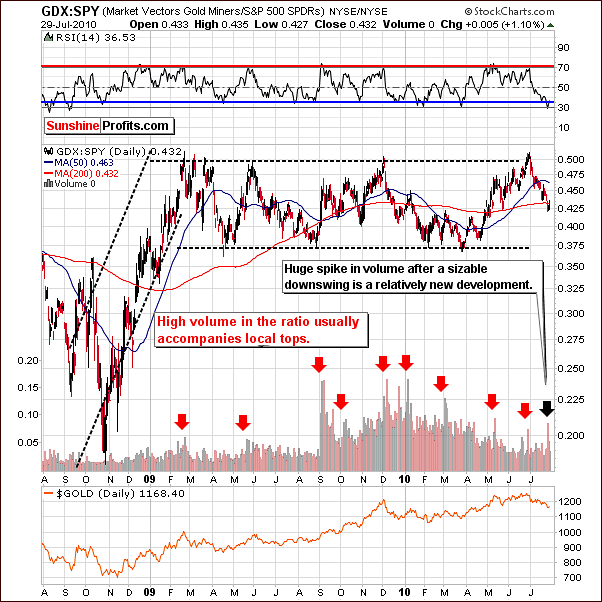
The GDX:SPY ratio provides us with sell-signals if certain criteria are in place. These are: high volume levels, RSI close to 70, and ratio encountering resistance level.
At the present time, we have seen high volume and this has usually accompanied local tops. However the RSI is not in or close to the overbought range and the ratio is near a support level not a resistance level.
Actually the RSI is presently in a buying range. High volume accompanying possible local bottoms is truly a new development, however all of these signals clearly suggest that "something is in the works", and since we've seen a prolonged decline, it seems that it signals a turnaround. The RSI and the ratio are indicating that it is possible a local bottom has been reached.
Other Information
This week we received several questions from our Subscribers (thank you) and in this section we would like to include answers to two of them (we will address other ones on the following updates.)
The first question is about options.
Which stocks options should I invest in with small capital, when the market gives us an opportunity to do so. A lot of these gold miners have very little option volume and huge spreads between the bid and ask. Do you know which ones would have larger volume and tighter bid and ask prices?
Generally, in this situation it seems that the GDX ETF should be appropriate. The volume is relatively big, the ETF is diversified among many miners so the company-related risk is much smaller, the spreads are small, and there are many strike prices to choose from. An additional benefit is that we almost always include a GDX chart in our updates. In case you are wondering, which stock price you should use, then we strongly encourage you to take a look at our Pyramid Optimizer tool.
One of the things that it does is that it compares trades based on a stock alone, the at-the-money option type and the most profitable option type. In some cases it will just reassure you that using at-the-money options is a good way to go. On the other hand - it may suggest combining several types of options in order to multiply your gains (it will suggest doing so only for the most favorable circumstances, though.)
Another question (actually, a few separate questions) was about the frequency of our trading signals. Generally, there are two rules that we follow. The first is that we send them as often as possible. The second is that we send them only when it is highly probable that they will be correct, as we don't want to sacrifice quality for quantity. These are the only rules. We don't try to catch one trade per month or so. We don't want to tell the market what it should do. Instead, we watch, monitor, analyze and when situation is favorable, we let you know. This means that there can be weeks or even months without any direct signals from us if we believe that the risk/reward ratio is unfavorable and there can be times when we suggest entering one trade right after another (like this time - going long after closing short position).
Summary
Gold, silver and mining stocks have reacted positively to small weaknesses seen in the USD Index and the general stock market. This, along with other technical details more than confirm points made in the latest Market Alert.
In other words - the counter-trend rally that we mentioned in the alert is now even more likely to materialize than was the case just a few days ago. While we still believe that this was not the final bottom for the summer months, this counter-trend rally appears to be worth betting on with one's speculative capital. The target for gold is around the $116 - $117 level for the GLD ETF ($1,190 - $1,200 for spot gold), $18 for the SLV ETF ($18.40 for spot silver), and $50.5 for the GDX ETF (460 for the HUI Index).
As mentioned in the Gold section - it is quite likely that the above targets (especially the ones for gold and silver) will be increased, however it will depend on the way that these markets respond to euro's decline and if the latter does indeed materialize. We will keep you updated.
This completes this week's Premium Update.
Thank you for using the Premium Service. Have a great weekend and profitable week!
Sincerely,
Przemyslaw Radomski


