
We hope many of you took long positions in gold as per our recent recommendations in both the Premium Updates and Market Alerts and enjoyed seeing the price of gold rise above $1,200 an ounce on Wednesday for the first time in nearly two weeks. Wall Street began August with a broad surge early this week, fueled by positive news about bank earnings in Europe and a survey that said American manufacturing was stronger than expected in July.
This was in synch with a beaming, optimistic Op-Ed article written by Timothy F. Geithner, Secretary of the Treasury in this week's New York Times with the cheerful title: "Welcome to the Recovery."
"We have suffered a terrible blow but we are coming back," wrote the sanguine Geithner.
Although the "devastation wrought by the great recession is still all too real for millions of Americans who lost their jobs, businesses and homes... a review of recent data on the American economy shows that we are on a path back to growth," he wrote. Geithner proclaims that the actions the government took to stimulate the economy "helped arrest the freefall, preventing an even deeper collapse and putting the economy on the road to recovery."
Geithner backs up his statement with last week's data on economic growth that show that large parts of the private sector continue to strengthen. "Business investment and consumption - the two keys to private demand - are getting stronger, better than last year and better than last quarter. Uncertainty is still inhibiting investment, but business capital spending increased at a solid annual rate of about 17 percent."
Geithner Against Tax Cut for the Rich
On Thursday Geithner rejected suggestions that Congress extend the tax cuts for those making over $250,000 a year until the economy recovers. In a speech at the Center for American Progress, Geithner said global investors would see the extension as a sign that the U.S. was not serious about deficit reduction. Extending the tax cut for even one year would require the government to borrow an additional $30 billion. "Borrowing to finance tax cuts for the top 2 percent would be a $700 billion fiscal mistake," Geithner said. Some economists said any tax increase while the economy is struggling is a bad idea and have argued for the delay.
In his OpEd piece Geithner jots off a happy list of good news.
• Exports are booming because American companies are very competitive and lead the world in many high-tech industries.
• Private job growth has returned - not as fast as we would like, but at an earlier stage of this recovery than in the last two recoveries. Manufacturing has generated 136,000 new jobs in the past six months.
• Businesses have repaired their balance sheets and are now in a position to reinvest and grow.
• American families are saving more, paying down their debt and borrowing more responsibly. This has been a necessary adjustment because the borrow-and-spend path we were on wasn't sustainable.
• The auto industry is coming back, and the Big Three - Chrysler, Ford and General Motors - are now leaner, generating profits despite lower annual sales.
• Major banks, forced by the stress tests to raise capital and open their books, are stronger and more competitive. Now, as businesses expand again, our banks are better positioned to finance growth.
• The government's investment in banks has already earned more than $20 billion in profits for taxpayers, and the TARP program will be out of business earlier than expected - and costing nearly a quarter of a trillion dollars less than projected last year.
Obama to the Rescue
Geithner says that new data shows that this recession was even deeper than previously estimated and it was the economic rescue package that President Obama put in place was the factor responsible for turning the economy around.
The combined effect of government actions taken over the past two years - the stimulus package, the stress tests and recapitalization of the banks, the restructuring of the American car industry and the many steps taken by the Federal Reserve - were extremely effective in stopping the freefall and restarting the economy.
Geithner's statements are backed up by a report released last week by Alan Blinder and Mark Zandi, advisers to President Bill Clinton and Senator John McCain, respectively which concludes that government action delivered a powerful bang for the buck, and that the bank rescue on its own will turn a profit for taxpayers. The report is titled "How the Great Recession was Brought to an End."
In the introduction to their 23-page report, they say that the U.S. government's multi faceted and bipartisan response to the financial crisis included some of the most aggressive fiscal and monetary policies in history. They point out that almost every one of these policy initiatives remain controversial with critics calling them misguided, ineffective or both.
The debate over these policies is crucial because, with the economy still weak, more government support may be needed, as seen recently in both the extension of unemployment benefits and the Fed's consideration of further easing.
The U.S. economy has made enormous progress since the dark days of early 2009... From the perspective of early 2009, this rapid snap back was a surprise. Maybe the country and the world were just lucky. But we take another view: The Great Recession gave way to recovery as quickly as it did largely because of the unprecedented responses by monetary and fiscal policymakers.
A stunning range of initiatives was undertaken by the Federal Reserve, the Bush and Obama administrations, and Congress. While the effectiveness of any individual element certainly can be debated, there is little doubt that in total, the policy response was highly effective. If policymakers had not reacted as aggressively or as quickly as they did, the financial system might still be unsettled, the economy might still be shrinking, and the costs to U.S. taxpayers would have been vastly greater.
Geithner concedes that the U.S. has a long way to go to address the fiscal trauma and damage across the country. He admits that there are problems.
"We must also cut the deficit over the next few years and make sure that America once again lives within its means," he says without explaining how. Nor does he mention the fact that the budget deficits are a staggering 1.4 trillion.
These are considerable challenges, but we are in a much stronger position to face them today than when President Obama took office. By taking aggressive action to fix the financial system, reduce growth in health care costs and improve education, we have put the American economy on a firmer foundation for future growth. And as the president said last week, no one should bet against the American worker, American business and American ingenuity.
Although we certainly don't want to bet against the American worker or against American ingenuity we still don't forget that total U.S. debt as of July 28th was approximately 93% of annual GDP, or a staggering $13.258 trillion. Foreign ownership of U.S. Treasuries has grown to 48%, from 29% a decade ago. The BRICs now account for nearly a third of the foreign ownership, with China by far the biggest holder. Having foreign countries own so much of American debt should give Geithner pause. It is a huge risk and makes the U.S. vulnerable to governments whose interests don't necessarily coincide with its own. Employment is still some 8 million below the pre-recession peak and unemployment remains above 9%. (Take a look at this frightening and amazing website that monitors the U.S. debt.)
As Binder and Zandi said in their report, no one can know for sure what the world would look like today if policymakers had not acted as they did. As far as they are concerned, "laissez faire was not an option; policymakers had to act. Not responding would have left both the economy and the government's fiscal situation in far graver condition."
What is not being considered in the abovementioned analysis, is the future state of the economy if this crisis is "solved". The problem with "printing the problem away" is with the long-term consequences, which is connected with the root of the problem - too low interest rates held at these low levels for too long. Consequently, they result in dangerous price bubbles, which have to burst eventually taking many other things with them (GDP, jobs). The excessive lending only added more fuel to the fire. The super-effective stimulus is most likely going to do that as well, but this negative effect may not be directly visible in the next few years. This would mean several more years of the "we did the right thing - hooray to the low interest rates and stimulus packages!" mantra, which would lead to much deeper problems in the future. This means that people making decisions today are willing to sacrifice tomorrow's prosperity for a smaller (compared to the size of future problems) gain today. Is this ethical?
As we said once before, history will be the judge.
To see how history will judge next week's action in gold, silver and mining stocks let's begin this week's technical part with the analysis of the Euro Index. We will start with the long-term chart (charts courtesy by http://stockcharts.com.)
Euro and USD Indices
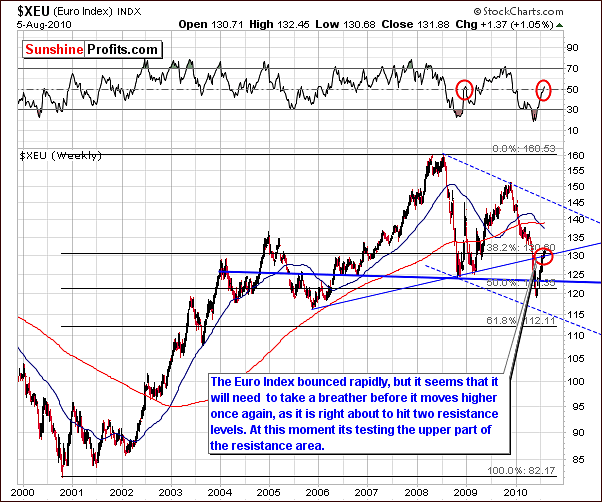
The long-term Euro Index chart this week again showed little movement. The increase was slightly less than 1% above last week's level as the struggle for movement above the 38.2% Fibonacci retracement level continued.
In last week's Premium Update we stated that "Close inspection of the long-term chart shows how the 38.2% Fibonacci retracement level corresponds to today's index level. This is an important point since the retracement level itself is based upon a noteworthy downswing".
In short, our comment made last week still holds true as the Euro Index continued its slow climb. The short-term chart however, does show some changes this week as we will see in our next section.
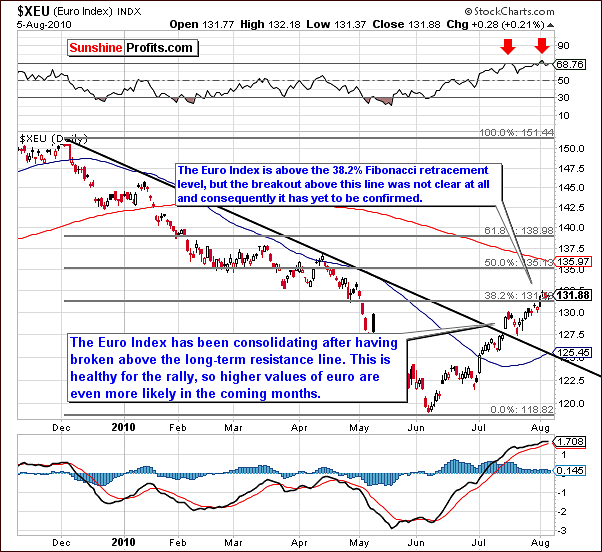
The short-term Euro Index chart this week clearly shows movement above the 38.2% Fibonacci retracement level. We must refrain at this time, however, from calling this a breakout. First, the index is only a very small amount above this level, certainly not large enough to be called significant. Several consecutive closes above it without a decline would allow this breakout to be confirmed. It would also be confirmed by a sharp move up.
For the short-term we remain skeptical towards a continuation of the rally in the Euro Index until we see confirmation of a breakout or consolidation. The latter still appears more probable.
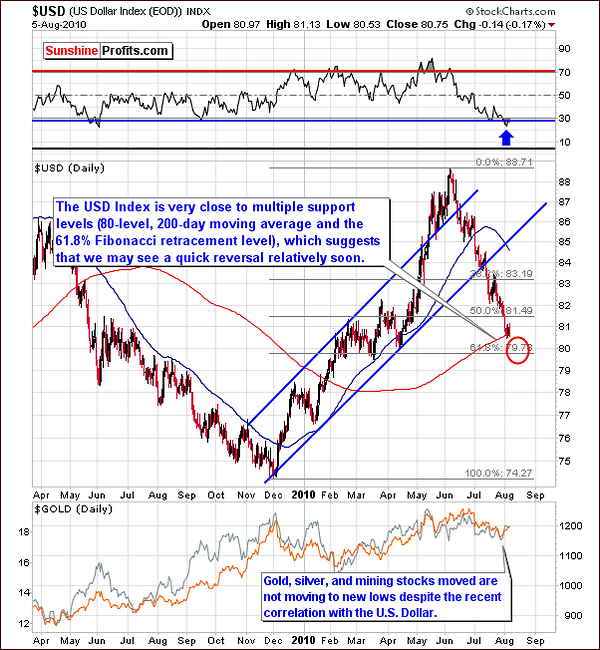
In this week's long-term USD Index chart, the opposite is true from what we have seen in the Euro Index chart. Here, the decline appears to be over at first glance. The RSI, showing a second bottom, confirms this. What this means is that it's likely we will see a bottom very soon, if it is not already in.
Support levels are in place and will likely have a significant impact in the near term. The 61.8% Fibonacci retracement level, a classic support is very likely to stop this decline if the USD gets that low. Also, the 80-level is an important psychological factor that proved to be a strong support for many years. Note that since surpassing the 80-level in early February, several moves back to this line have been met with a show of support. The line has held on at least three occasions.
Concerning precious metals, this week saw increases across the sector despite the USD Index declines. It's important to note that the rally this week in gold, silver, and mining stocks was without any positive influence from the dollar (or negative from euro). This is bullish news for precious metals and we will discuss further developments in a later section of this update.
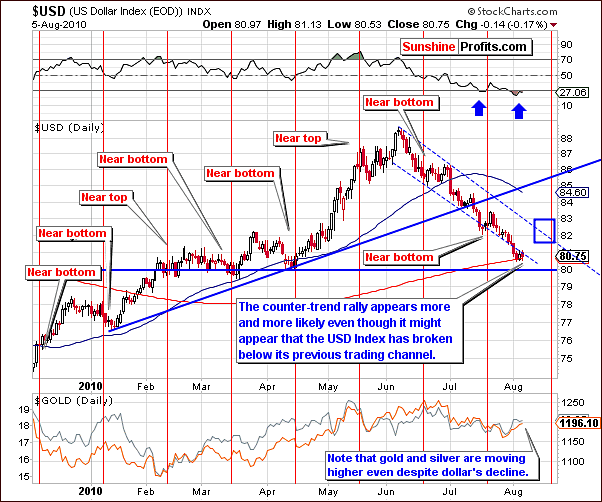
The short-term USD Index chart shows us the details of what has happened recently as well as displaying a minimum target level for late August. The RSI is presently showing an oversold situation and this frequently corresponds to the start of a rally.
The blue rectangle in the chart shows a target in the 82-83 range and this truly should be considered a minimum target. The decline, which we have seen for the past two months, has been quite sharp without any significant corrections. For this reason, the coming bounce could be extreme and may provide FOREX traders an opportunity to profit by investing in USD vs. the euro, for example.
On a final note, the end of August coincides with yet another cyclical turning point as noted by the vertical red lines in the short-term chart. What this means is that we are likely to see a local top or bottom in about three weeks.
With a present appearance of being at or near a bottom, it is quite possible that this late August turning point will in fact be a local top. Once again, our indicators and other technical signs lead us to the opinion that the target level of 82-83 may be quite conservative.
It is a tough call right now to state the probable impact upon precious metals (more on that in the correlations section below). Strength was shown this week as gold, silver and mining stocks were able to rise without USD influence. It seems that a very close watch will be required to identify the upcoming influence of any movement in the USD Index. Ultimately, this could determine the direction of the precious metals sector in general and further details will be provided to our Subscribers as the situation unfolds.
Summing up, the euro and the dollar are both in critical territories presently and a strong move may very well be seen by one of these currencies. This in turn will have obvious impact upon the other and will then allow for a better understanding of likely impacts upon gold, silver and mining stocks.
As we stated last week, the short-term appears to be bullish for the precious metals in general but caution is warranted during these uncertain times with respect to major currencies. Much will be learned in the coming days.
General Stock Market
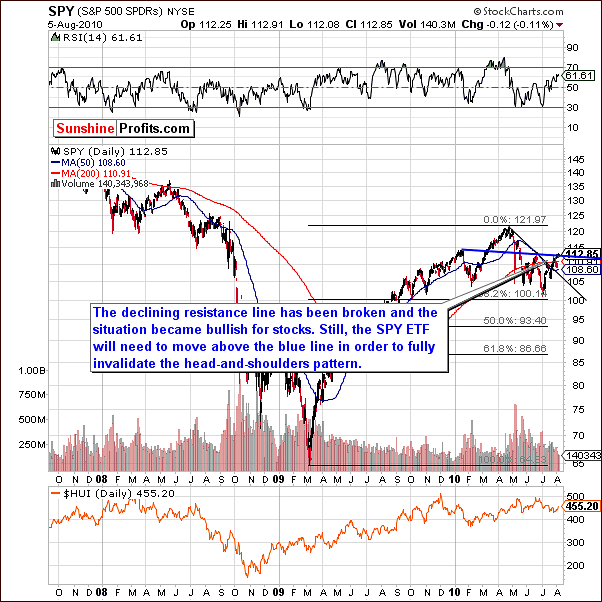
The long-term SPY ETF chart this week is not significantly different from what we presented in last week's Premium Update. We continue to monitor signs confirming that the bearish head-and-shoulders pattern has indeed been invalidated. This week's signs do not support any continuation of this pattern, but we are still awaiting a decisive move above the $113 level to put away any thoughts about this pattern. The coming week will likely provide much more insight as to short-term market direction and a final decision on the status of the bearish head-and-shoulders pattern.
This week's short-term chart clearly shows a period of sideways movement with low volume in recent days (since the beginning of August). This short consolidation period has, however, created a small flag formation in our chart. The movement from the $112 level to $113 is the specific area where this formation is seen. The possibility exists in that the next move will again be in the range of three dollars and could take the SPY from $113 to $116.
This possible local top at the $116 level will likely be followed by a correction back to $112 or $113. Verification of this as a support level would then be tested. Note, however, that this is pure speculation and we are not advising any move be made to profit at this time - gold, silver and mining stocks provide better opportunity for this.
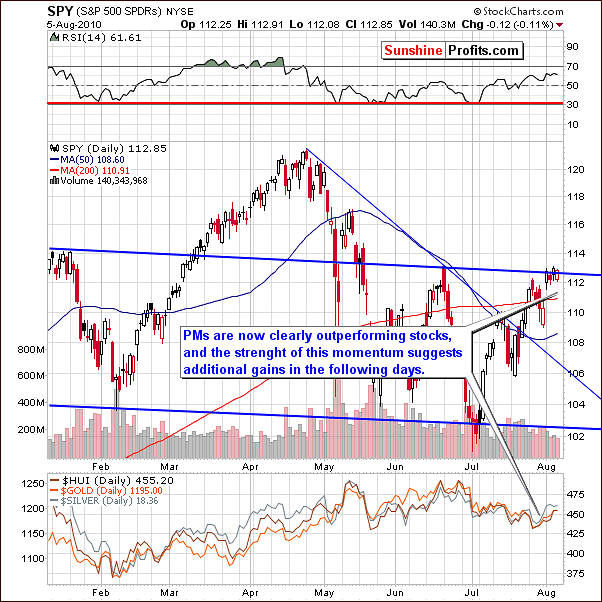
Precious metals are clearly outperforming stocks at present. Any show of strength by the general stock market could result in further strength for the precious metals sector. Furthermore, percentage gains for gold, silver and mining stocks may very well be greater than those in the general stock market. This is all dependent, of course, on the direction taken by the main stock indices in the coming days.
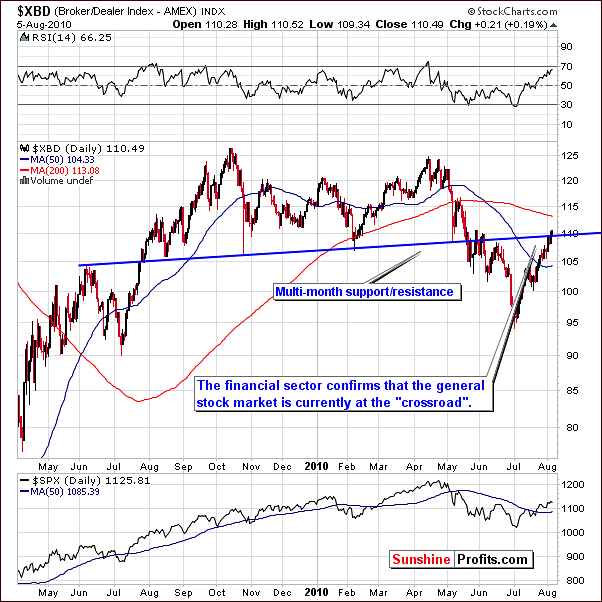
The XBD (Broker Dealer) Index checks the pulse of the financial sector. This week we see confirmation of stocks' present critical level. The multi-month support/resistance level is an obvious factor and will play a strong role in days to come. Perhaps stock values will increase dramatically for the next weeks or even months. It is possible however; that we will first see a downswing in the general stock market and this will obviously have great impact on gold, silver and mining stocks. Constant monitoring is required in these uncertain times. Sunshine Profits is ready for the task.
Correlations
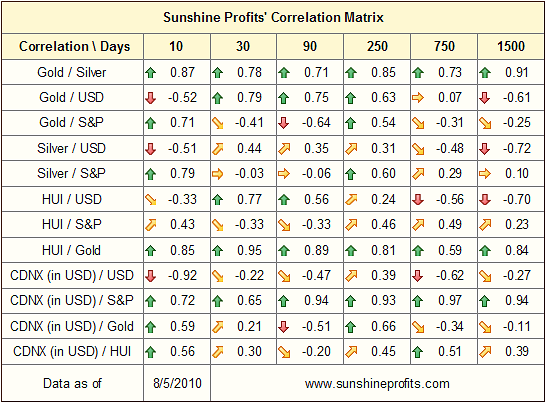
This week's correlation matrix shows only a small amount of critical information as the 10-day column to a considerable extent contradicts the 30-day one. Should this persist for several more days (meaning gold, silver and mining stocks rising along with the general stock market and against the USD Index, we could see the precious metals market top along with dollar's bottom.
Summing up, there has been a complete turnaround regarding the correlation recently between the gold, silver and mining stocks and the general stock market / USD Index. Further gains seem to be likely if the general stock market trends upward. The difficult call at this time is to project metals market trends in a period of general stock market decline. It is just too cloudy a situation to comment on at this time but, rest assured, Sunshine Profits will monitor this closely as the situation develops over the next week. Subscribers will be kept informed with a Market Alert when warranted.
At this point it seems that the precious metals market could become negatively correlated with the USD and then top when the dollar bottoms - just like it was many times in the past, especially prior to 2006 when gold was mainly USD-weakness-driven.
Speaking of gold, let's take a look below, as we have prepared particularly interesting charts for your this week.
Gold
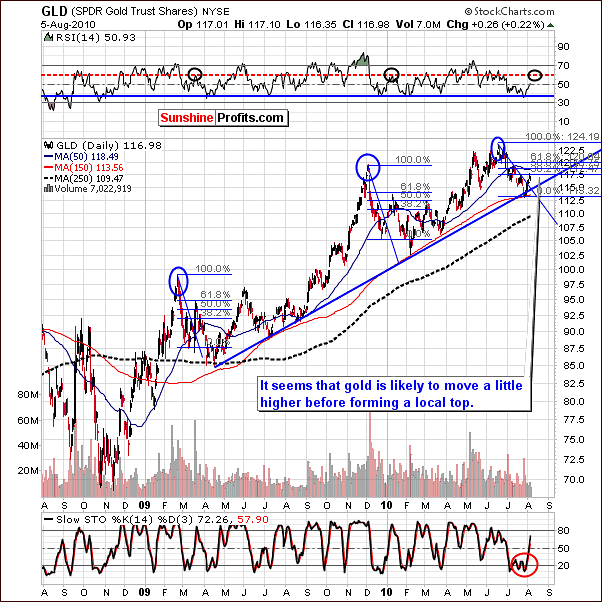
This week's long-term gold chart shows much promise. The target for the next local top has been moved upward since last week. The reason for this is due to a study of normal rallies following steep declines.
Late last year gold moved to the declining resistance line and after breaking above it rallied more or less by the same amount. Using this analogy, further price increases are quite possible for gold in the near term (based on the Thursday's closing price).
The 61.8% Fibonacci retracement level may or may not be reached and a conservative target level would be in the 50% range (update: which was reached on Friday, as indicated in the previously sent Market Alert). The RSI confirms what we have stated previously as it is presently near the 50-level and normally moves close to 60 before the local top is reached.
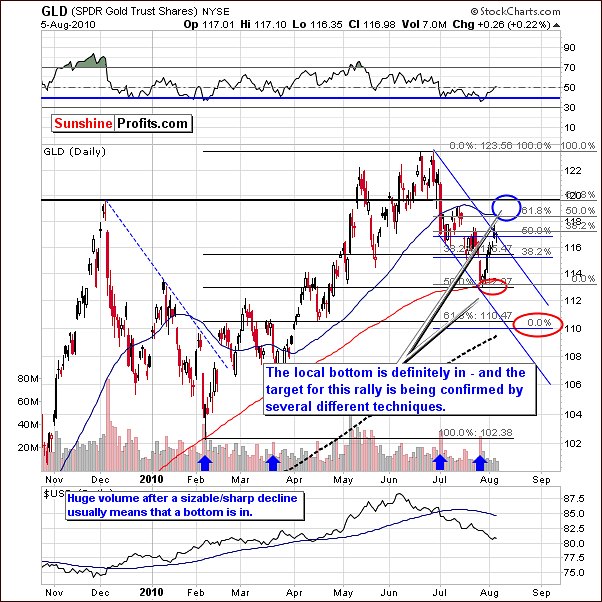
In the short-term chart this week, multiple Fibonacci retracement levels are factors. The near-term target levels have been revised and now stand at $118.5 - $120 for a local top. The 50% and 61.8% Fibonacci retracement levels have been used to project these target levels.
A target of $118.5 would be obtained by using the previous local top as a resistance level along with a 50-day moving average. Based on the Thursday's closing price there was a strong possibility that if gold rallies to this $118.5 level, we would suggest exiting long positions rather than pushing too far trying to reach for more and this is precisely what we've done in today's Market Alert. At this level, our view is that the risk-reward ratio would begin to turn against investors.
Of course, short positions could be taken, should the 120 level be attained after exiting the market. In this situation, profits could possibly be made as gold prices would decline. We will let you know when we believe it is a good idea to make a bet on lower prices of gold, silver, or mining stocks.
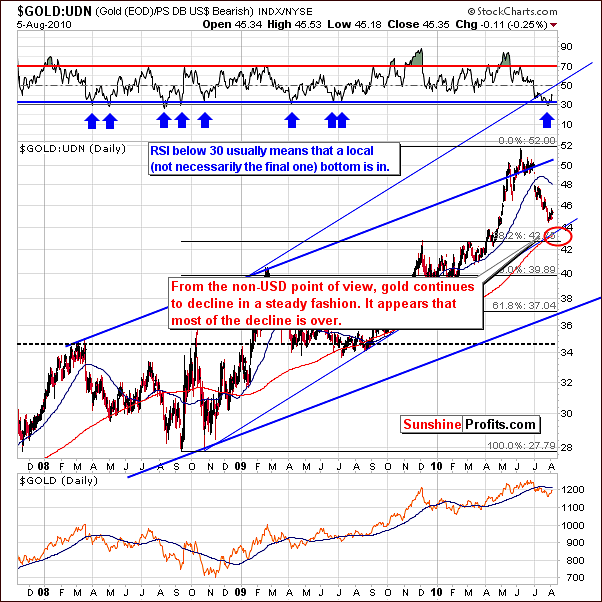
Looking at gold from a non-USD prospective we have seen a slight increase over the past week. The reason for this is that gold, of course, rallied and the USD Index declined which lead to higher prices in non-USD currencies such as sterling, the euro and the rupee, but the increase was less visible than it was the case from the USD perspective.
Should the dollar rally sharply soon and gold decline, we could see another small decline on the chart above. With gold moving in the opposite way to the USD, its volatility decreases substantially from the non-USD perspective.
Summing up, gold prices are likely to move a bit higher before reaching a local top, however, as stated in the Market Alert earlier today:
It seems that this rally may take the precious metals sector even higher ($15 for gold or so), but that's not that far when one compares it to the risk of not being able to close the long position at all in the next few days if the market moves lower immediately.
Silver
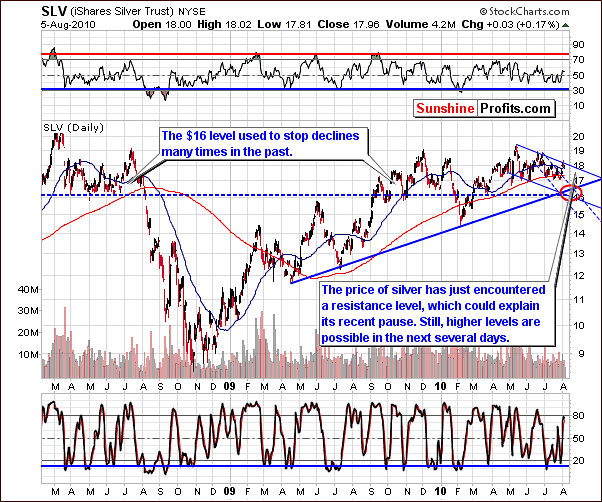
In the long-term chart for silver, we see a reflection of what we saw in earlier gold charts. Although silver has paused slightly in recent days, investors should not be overly concerned as there have been good reasons for this. Several important resistance lines have been reached and it's very natural for a rally to take a breather for a short period of time. Higher levels appear to be possible for the white metal in the coming days. However, based on the Friday's price action, it does not appear to be worth betting on these additional increases in price of silver.
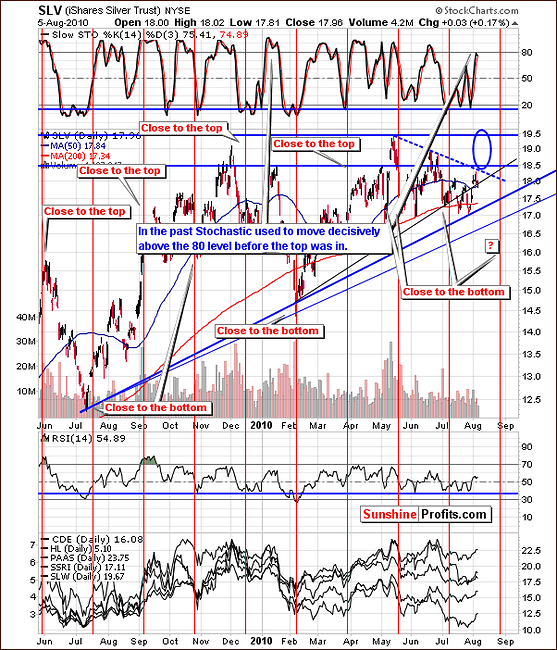
The short-term chart this week shows a target area which may at first seem quite wide. This is due to the fact that technical analysis is currently less precise for silver than it is for gold and mining stocks. The Stochastic Indicator at the top of the above chart has not yet broken through the 80 level. This has been the sign of a local top no less than 6 times this year so it is likely in view of this tool that higher prices are yet to be seen.
Summing up, silver investors may very well keep their eye on gold in the coming days and weeks watching for its inevitable reversal. At this time, it appears that exiting long positions in silver will be best advised at the end of gold's rally. Based on Friday's price action (not visible on the chart above), and the following Market Alert we know that betting on even higher silver prices in the short run may not be a profitable thing to do.
Precious Metals Stocks
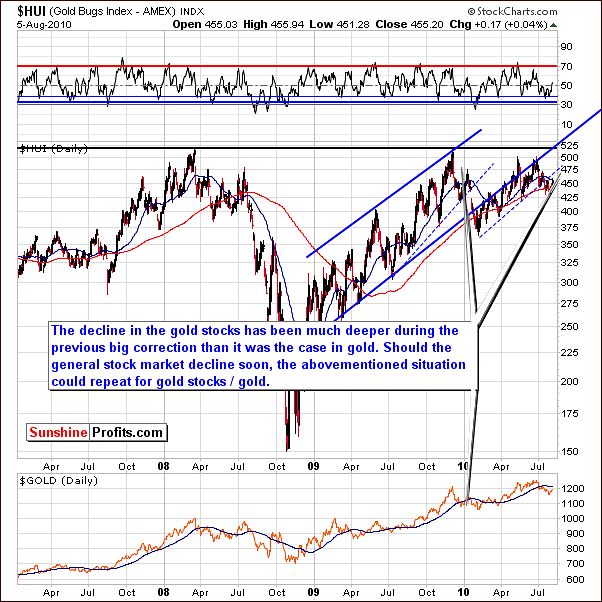
The HUI Gold Bugs Index shows very little change this week. Prices did rise a bit since our last update but this is not visible on the long-term chart. Earlier this year, mining stocks declined to a much greater extent than did gold itself. This phenomenon could very well be seen again soon.
Much depends on what happens in the general stock market. If an upswing takes shape, mining stocks may not fall more than gold and silver will. If, however, stocks fail to break through the resistance line presently in place, mining stocks may actually see a decline of even greater magnitude than that of gold. Of course, short positions could possibly be taken in such a scenario to create a new profit opportunity.
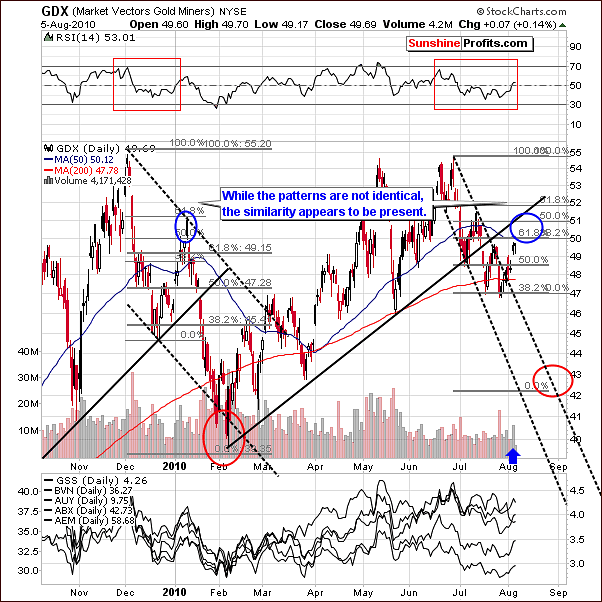
The GDX Market Vectors Gold Miners chart this week shows a short-term target range of $50 - $51.5. This is more or less the area where price of the GDX ETF would correct between 50% and 61.8% of the preceding decline. Consequently, the target for the next local top is a bit less than 2% above Thursday's closing level and is likely to be reached quite soon.
One bullish indicator is that volume levels have been consistently higher when prices rise as opposed to when they decline. At quick glance, this seems to be the case in most, if not all of the past 7 or 8 highest volume trading days since late June. Apparently, buyers are waiting to buy as opposed to the situation where sellers are waiting to sell. The latter case would have high volume days occurring along with declining prices.
The chart below provides additional confirmation of the abovementioned points.
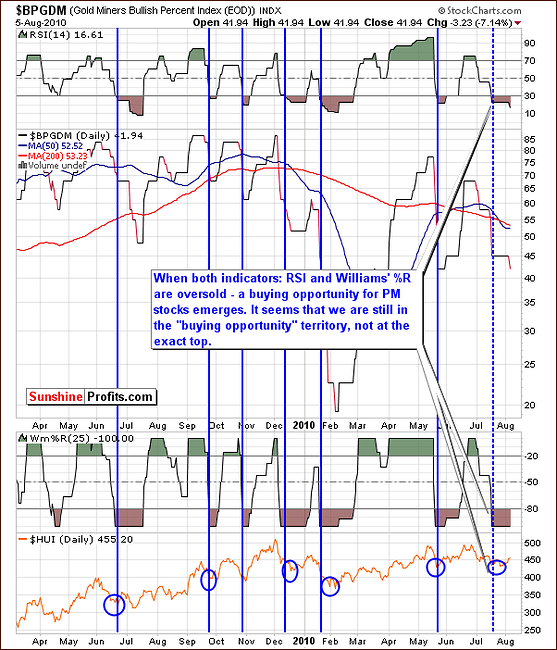
As we stated last week, the Gold Miners Bullish Percent Index is a reliable way to analyze current trends. The Williams' %R and RSI together provide additional insight. This week we see that we continue to hold in buy opportunity territory. Based on Thursday's closing price it seemed that we have not yet reached the top and remained more oversold than overbought. It seems a good time to bet on higher prices in the short-term, however that is no longer the case (speaking in speculative terms of course).
And as stated last week, "this indicator has proven to be very accurate in the past."
Summing up, signals coming from the mining stocks indicate that the short-term rally still seems likely to be followed soon thereafter by more declines. The under- or outperformance of the metals will, however, be dependent on the direction of the general stock market during the weeks ahead.
Juniors
As stated in the Key Principles section, the list of top juniors will be updated approximately every 4 weeks, so this is the Update that should contain the revised version of the list. However, before providing you with details, we would like to comment on this sector's performance in general.
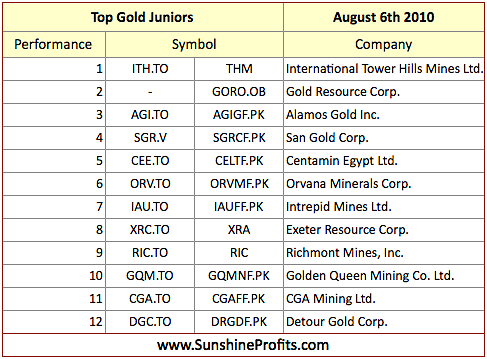
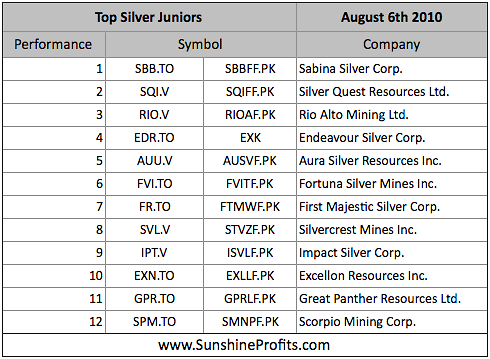
Once again, there are virtually no changes since the last month, meaning that the stocks that were strong (on a comparative basis) last month are still holding relatively well. Therefore, if you've been taking our rankings into account when selecting junior stocks to your portfolio, it seems that you will not need to make significant adjustments this month. The fundamentals didn't change significantly.
On a general note, juniors have been outperforming senior gold stocks in the past few weeks, which confirms our previous observation (also visible in the correlations matrix above) - namely, that the junior/senior ratio is highly correlated with the general stock market. This means that the question if one should favor juniors over senior mining stocks (for instance AEM, GOLD, GG) depends on what one believes is going to happen next on the general stock market.
As mentioned earlier the main stock indices are currently at the crossroads, which means we will need to wait and see how the situation plays out. Please note that our SP Junior Long-Term Indicator has been suggesting holding juniors since June.
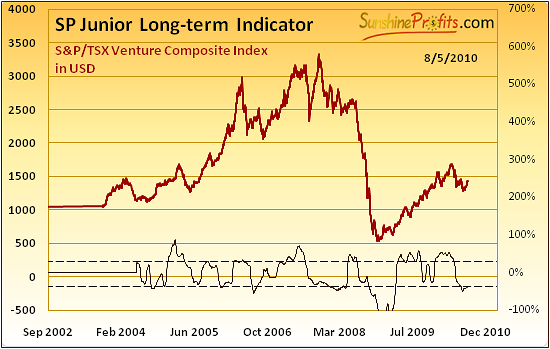
The buy signal (for juniors; switch from senior stocks) is given, when indicator is below lower dashed line and starts to rise (the indicator has been falling for 3 consecutive days and rises on the following day).
The sell signal (for juniors; switch to senior stocks) is given, when indicator is above higher dashed line and starts to fall (the indicator has been rising for 3 consecutive days and falls on the following day).
Other Information
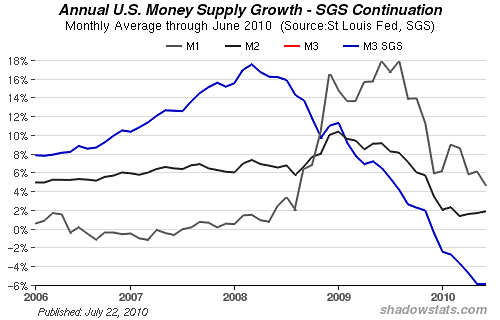
Two of the questions that we've received in the past weeks were about gold's performance under deflationary scenario. Generally, there are two opposing theories - one says that gold will fall just like every other asset during a deflation, while the second suggests that gold - being the ultimate form of cash - will thrive during a deflationary scenario. Let's begin by defining a deflation as a decrease in the general price level caused by a decrease in the money supply. The M3 money supply does indeed decline at this point.
In order to check arguments of both sides (is deflation bullish or bearish for gold) we should keep in mind the simple fact that we live in the world of fiat currencies - not backed by gold. Gold's value rose in the past during deflationary scenarios, as it was in fact cash. This is not the case right now, so this argument will not hold true under normal circumstances. However, it might become important during very serious financial turmoil periods, when the idea of fiat currency system will be widely questioned. We are far from this point in our opinion.
So, does gold go down in a big way? Not really. Given the current political environment, it seems that any deflationary scare will result in "stimulus packages", "quantitative easing" and other forms of injecting money into the economy, inevitably resulting in higher gold prices. Besides there can be other factors that could contribute to gold's rally - not only the increase in the money supply - for instance war tensions.
Of course, the negative M3 growth at this point may suggest temporarily lower prices, but that is in tune with what we've already written in this update. We don't think that it would mean the end of the current bull market in the precious metals - not until gold reaches $3000, or most likely $5-6000 or so (in today's dollars).
One question that we've received this week was about Kinross Gold (KGC) as it took a large hit on merger with Red Back Mining for $7.1 B. The question was if this is a buying opportunity. In short - in our opinion that doesn't seem like a buying opportunity for KGC (meaning that it doesn't seem to indicate that KGC would outperform very soon). Generally, most mergers/acquisitions fail to provide the outcome that the buying party was expecting, and market knows that. In this case it meant a decline for KGC. Another general rule here is that after a negative shock (like it was the case here) price of a given security still tends to move in the direction of the initial move for some time. Yes - this is against the "return to the mean value" theory, but this is how things usually work. First - a continuation of the initial move, and only after several weeks/months we see the "comeback to the average value" phenomenon In this case, it would mean KGC's underperformance relative to other stocks, so if you are holding it you might want to sell it now, and buy other stocks once the summer decline is close to being over. We suggest using our Leverage Calculators from the Tools section when selecting gold and silver stocks.
We have also received a question about the fact that money appears to be flowing out of the precious metals sector. We were informed that this article suggests that money is flowing OUT of GDX and GLD! The question is if we agree with the author and if so what are the implications for taking positions in GLD and/or GDX or GDXJ.
In our view there is nothing to be overly excited about regarding the money outflow. It is a natural thing to observe that the money flows out of a given market (here: ETF) during a downswing, as people are selling their holdings thus causing prices to decline. Consequently, we don't find this observation very meaningful at this point, and we believe other factors (mentioned in this update) are much more important.
As far as the GLD:GDX or HUI/Gold ratio (they are also mentioned in the abovementioned article) is concerned (which are different ways to describe the relative performance of mining stocks vs. gold), we have checked their performance and found that there are more useful ways to interpret them. These observations have been applied to one of our indicators (from the Premium Charts section).
Another question that we've received was if we used futures for trading. The reply is no, we prefer to use options, and we have provided our reasoning in the Key Principles section.
We have received a few more questions this week, but we will deal with them in the following Premium Updates.
Summary
The USD Index seems poised to rally and the general stock market is truly at the crossroads. The long-term trend for the precious metals and corresponding equities remains up, but it seems that we are very close to be reaching a local top. At this point betting on higher prices in the precious metals sector in the short-run does no longer seem justified from the risk/reward perspective, and neither does opening short positions.
It might be the case that we will soon see have a good shorting opportunity (for instance by buying put options), but we don't recommend doing so yet. We will let you know should we change our mind regarding that matter.
This completes this week's Premium Update.
Thank you for using the Premium Service. Have a great weekend and profitable week!
Sincerely,
Przemyslaw Radomski

