

Briefly: In our opinion, small (50% of the regular size of the position) speculative short positions in gold, silver and mining stocks are justified from the risk/reward perspective at the moment of publishing this alert.
On the surface, everything regarding the current situation in the precious metals market seems to be in order. Gold, silver and mining stocks have been rallying almost without a pause for many days and the low volume seems to be natural for this time of the year. Yet, there is something disturbing below the surface of the market that most investors are not aware of. Actually, it’s more than one thing.
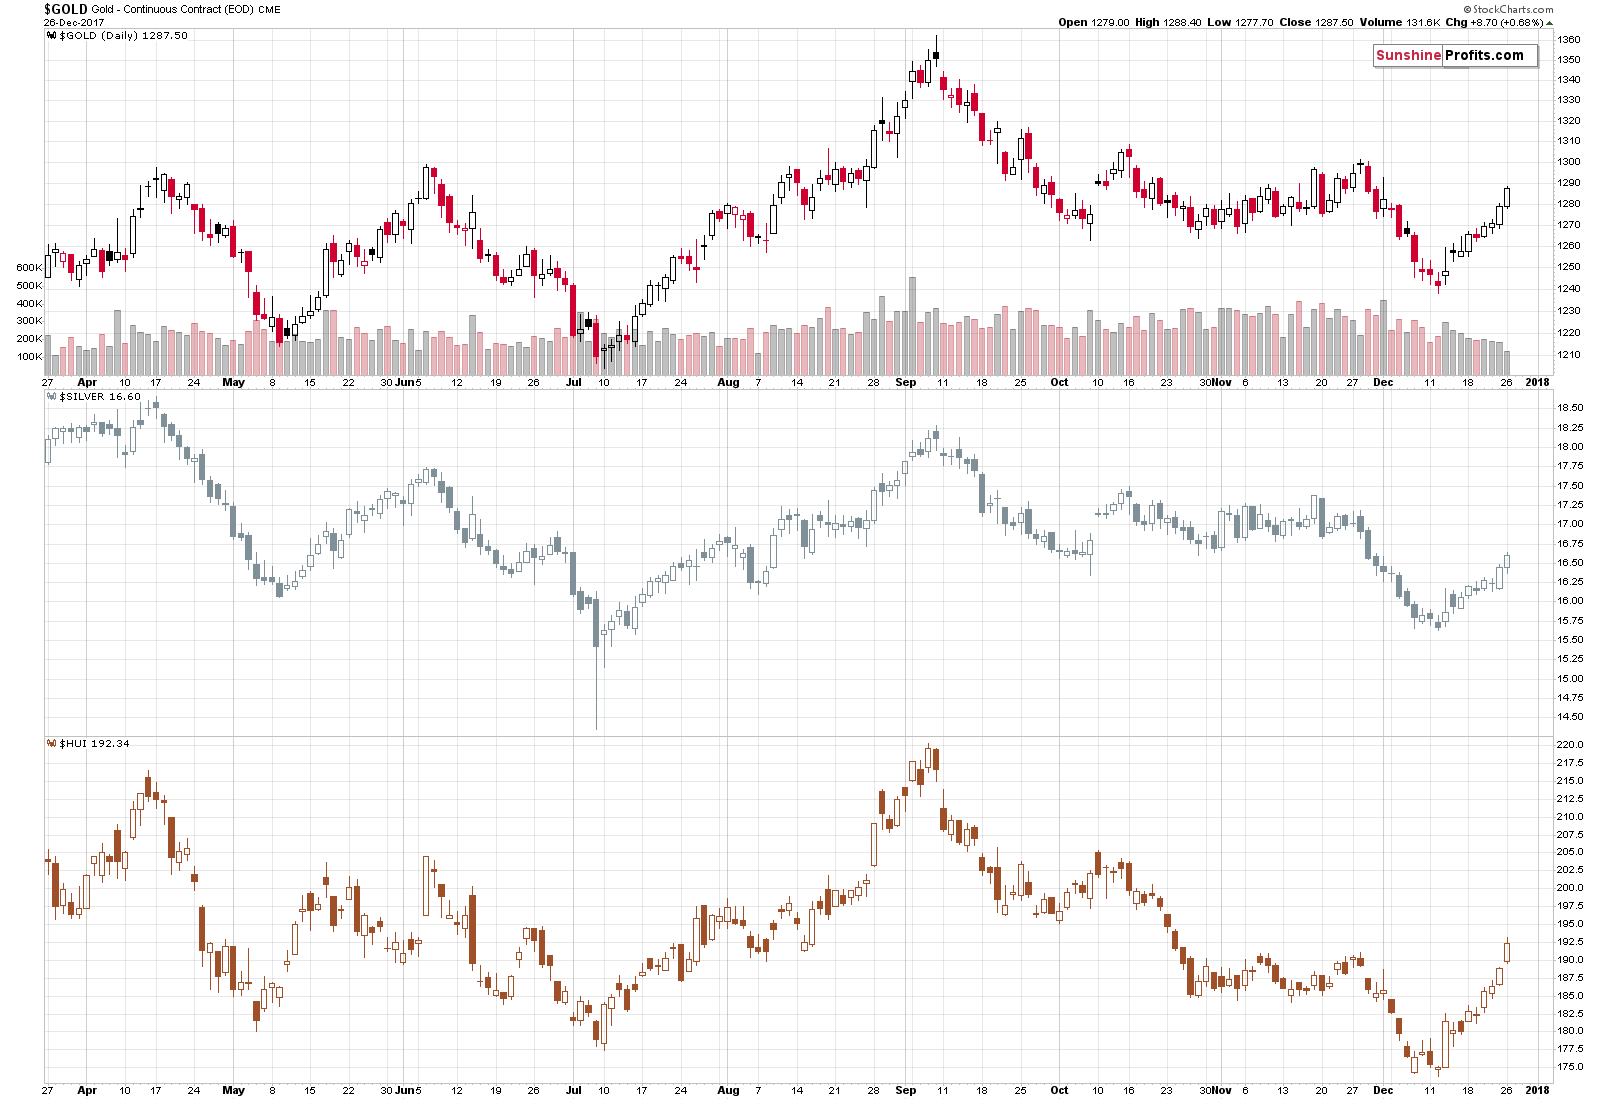
Let’s start with the charts that are popular, beginning with gold (chart courtesy of http://stockcharts.com).
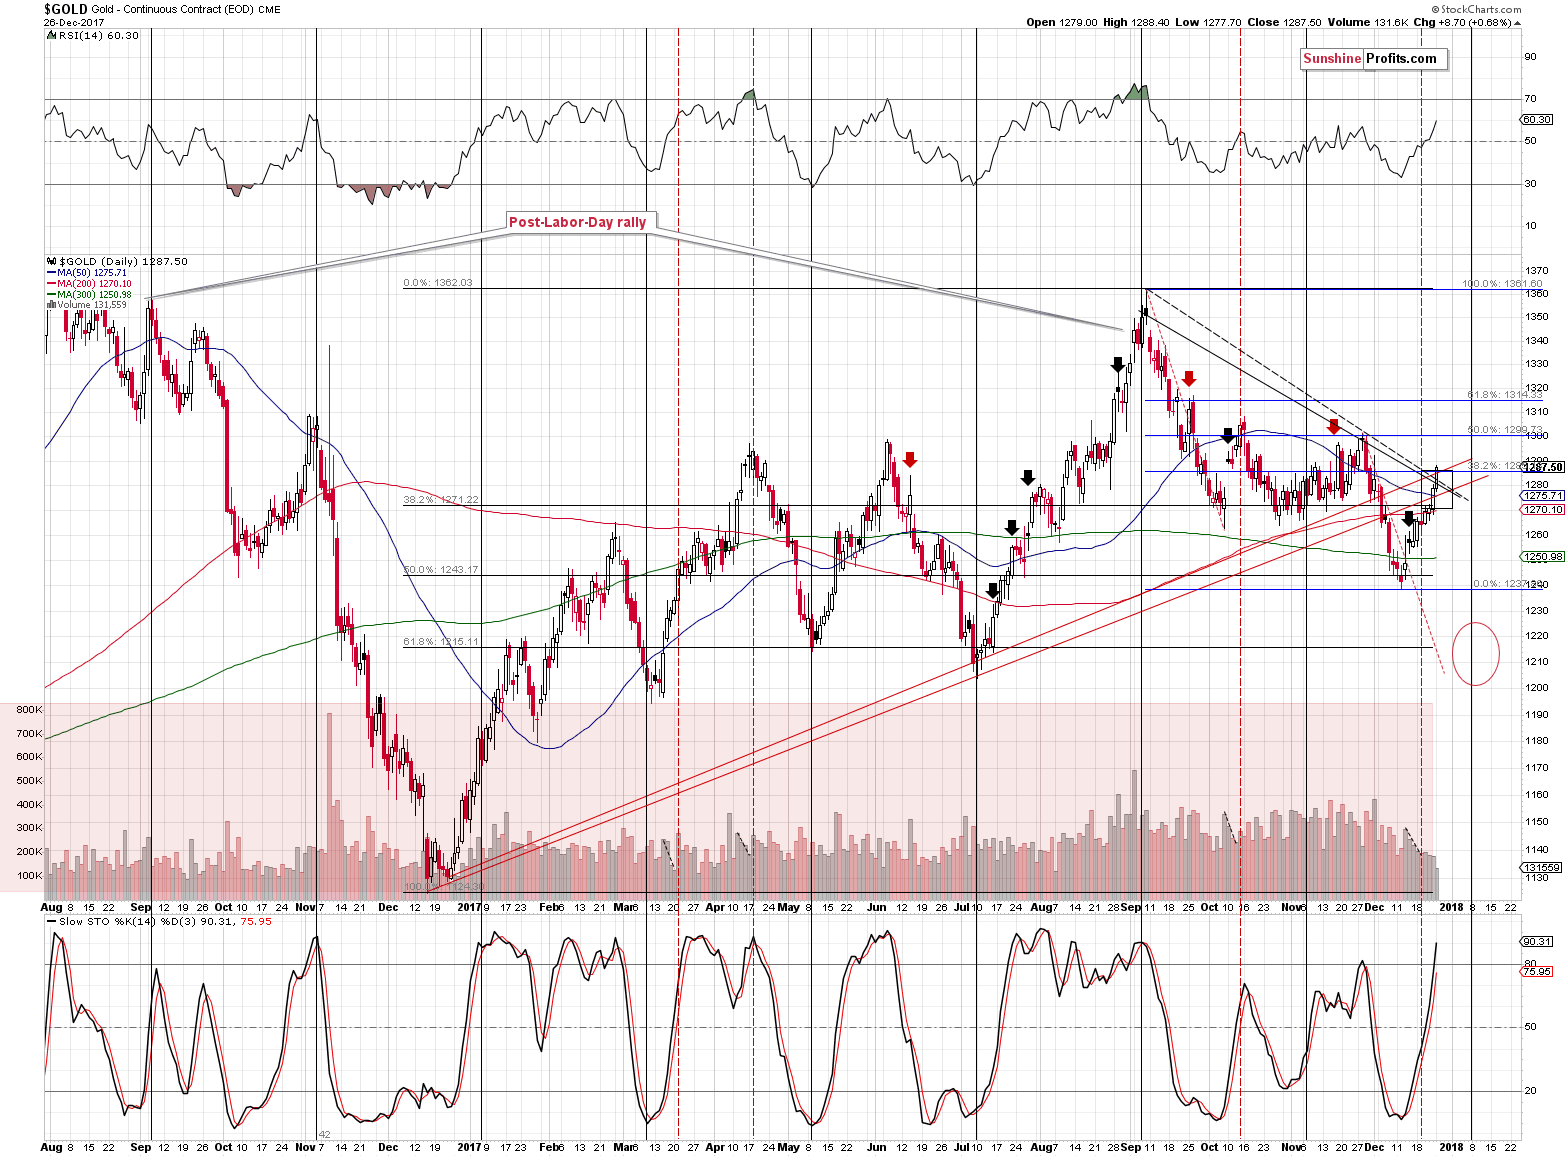
Gold moved higher, just like it was likely to, and the upper part of our target area was reached, just like we expected it to. There was a tiny breakout above it, but nothing spectacular and nothing that’s confirmed.
In the previous regular alert, we wrote the following:
So, is the rally ending?
Ending – perhaps. Ended – most likely no.
The upper part of the target area is where most resistance levels coincide and since we haven’t seen any meaningful bearish confirmations, gold is likely to move higher in the short term. These resistance levels are:
- The rising red resistance line based on the previous major lows in terms of the daily closing prices.
- The declining black resistance line based on the September and November tops in terms of both: intraday and closing prices.
- The 38.2% Fibonacci retracement based on the September – December decline.
Moreover, the upper part of the target area (above $1,280) is slightly above the 50-day moving average and in the previous two months gold reversed and started to decline only after it moved a bit above this MA.
These levels were reached, so a top here or nearby is quite likely.
The volume level that accompanied yesterday’s upswing was very small, but it’s not something surprising given the time of the year. Last year, gold also moved higher on low volume and that was the start of the rally, not its end.
Still, given all the medium-term bearish signals that we’ve been describing in the past weeks, it seems that volume might still serve as a bearish sign here. Not a strong one, but still, something worth keeping in mind.
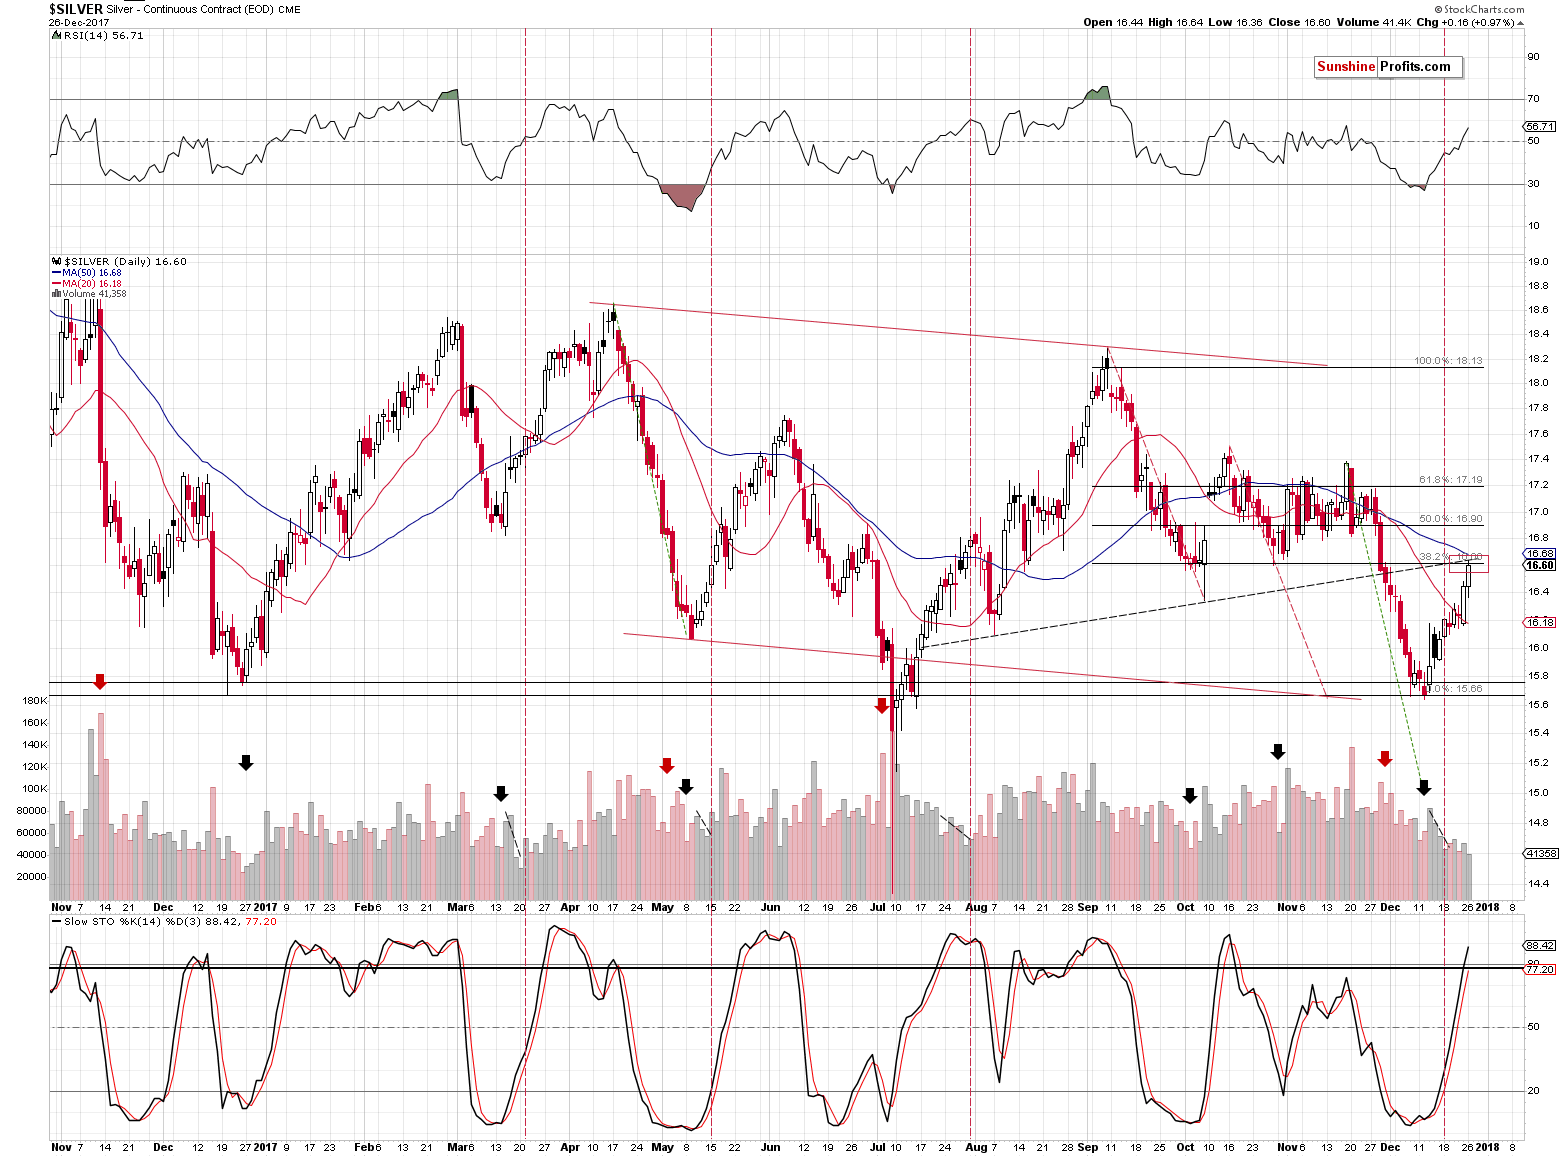
Silver moved to its target area as well. In fact, yesterday’s intraday top formed right in this area. Does this indicate that the top is in? Yes, but is it the confirmation from the silver market that we’ve been waiting for? Somewhat.
As a reminder, we’ve been waiting for silver to outperform gold and – in particular – mining stocks on a very short-term basis. Did we see this happen recently? In a way – yes. The last two trading days took silver higher and the entire size of the rally was quite significant compared to the gains that we saw in the previous several days.
In terms of closing prices, between December 12 and December 21:
- Silver moved from $15.668 to $16.239 (3.64%)
- Gold moved from $1,241.70 to $1,270.60 (2.33%)
- The HUI Index moved from 174.97 to 186.34 (6.50%)
In the last two trading days:
- Silver moved from $16.239 to $16.60 (2.22%)
- Gold moved from $1,270.60 to $1,287.50 (1.33%)
- The HUI Index moved from 186.34 to 192.34 (3.22%)
Dividing the percentage gains in the past 2 trading days by the previous gains, we get the following:
- 2.22 / 3.64 = 61%
- 1.33 / 2.33 = 57%
- 3.22 / 6.50 = 50%
So, silver did rally most significantly in the past two days on a relative basis, but the strength of the outperformance was moderate (just a little stronger than gold). Based on our experience, it’s an early warning sign, not a confirmed sell signal.
At the moment of writing these words, silver is up by 5 cents in today’s pre-market trading, while gold is up by $0.60, which means that silver’s outperformance continues. Is the top forming? It could certainly be the case, but it could also be the case that silver will outperform some more before turning south.
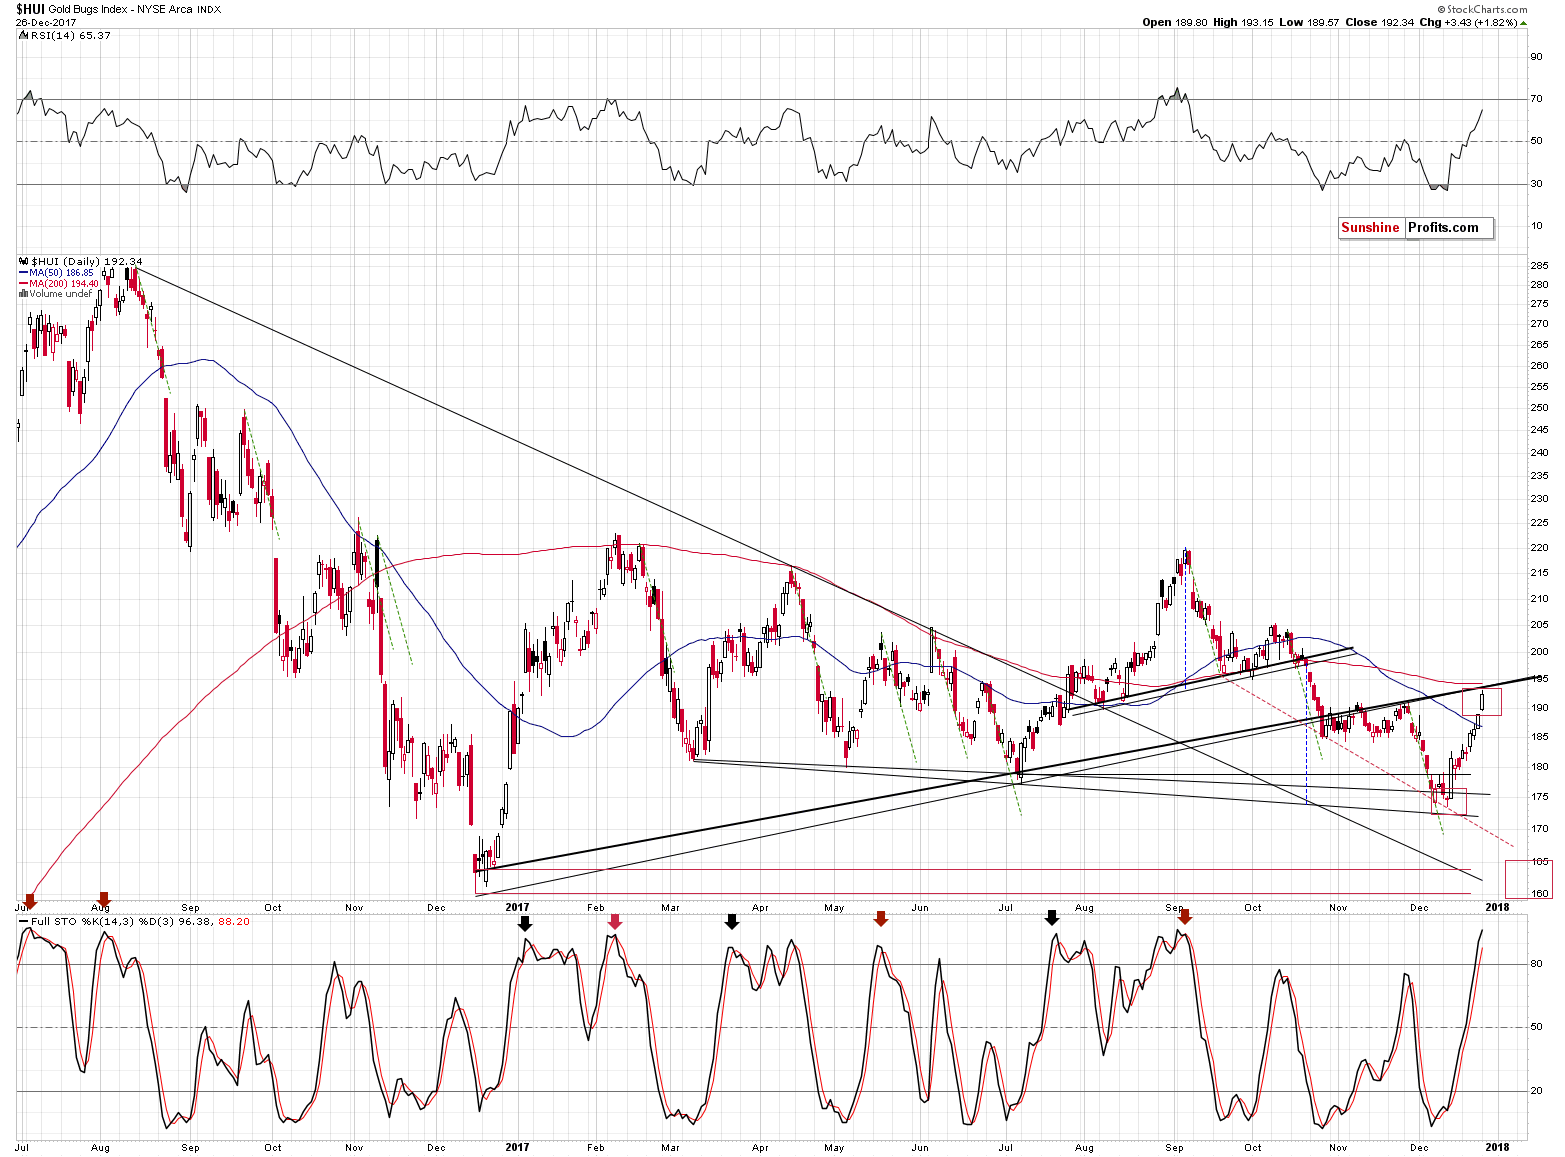
Gold stocks moved higher and are very close to reaching our target of 194. In the previous regular alert, we wrote the following:
There’s another thing that’s worth keeping in mind. In June and July and, to some extent, also in the second half of September, when the HUI Index moved above the 50-day moving average, it moved higher sharply. If miners repeated such a sharp move today or in the following days, they could reach the 194 target level.
The above remains up-to-date. The 194 level and its proximity are still likely to stop the rally, especially that the RSI and Stochastic indicators are close to flashing their sell signals. The latter hasn’t happened yet, so the above chart confirms our previous comments – the top seems to be just around the corner.
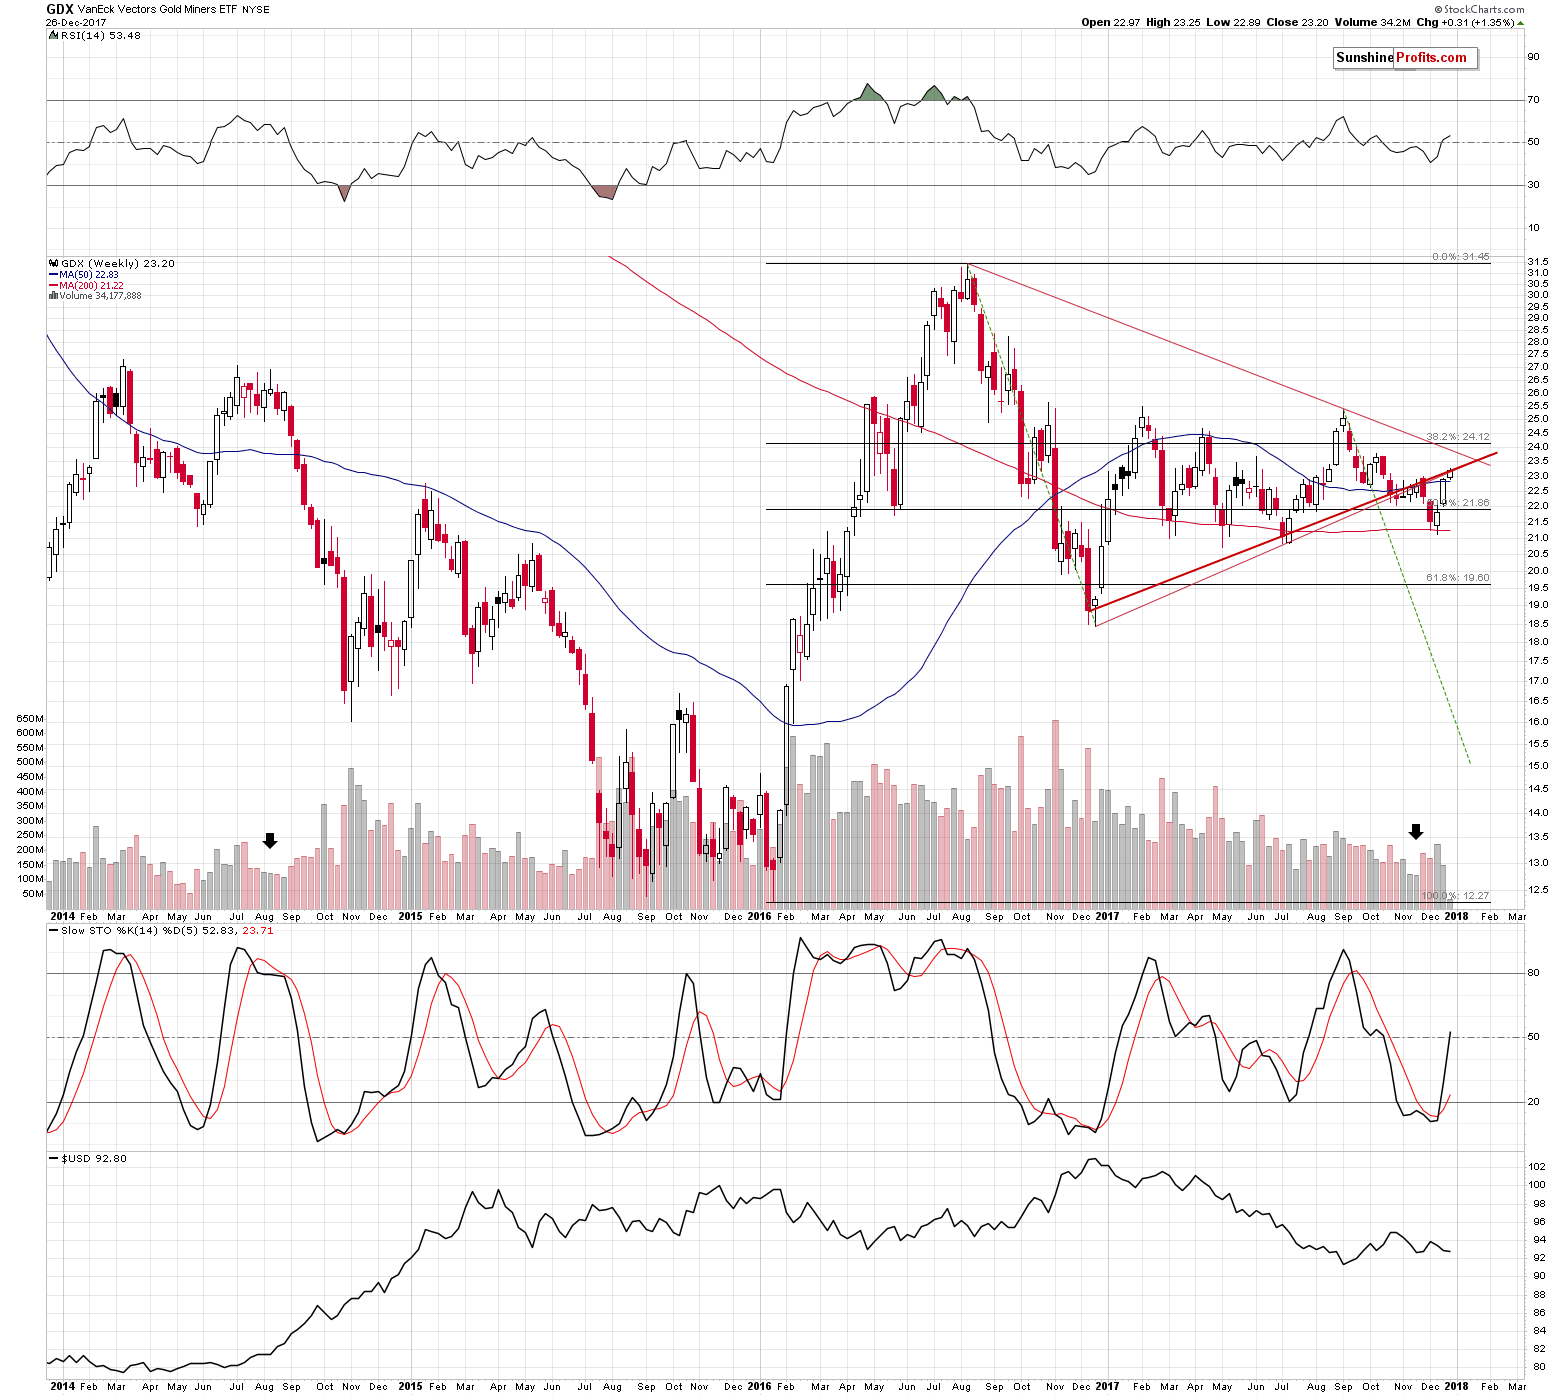
From the weekly point of view, the rising resistance line is in play as well. The week is not over yet – there are three more sessions to go. This means that we could see a temporary move above it and then a decline back below it, without the line being invalidated as resistance. In fact, such a reversal would not be a bullish development, but a bearish one.
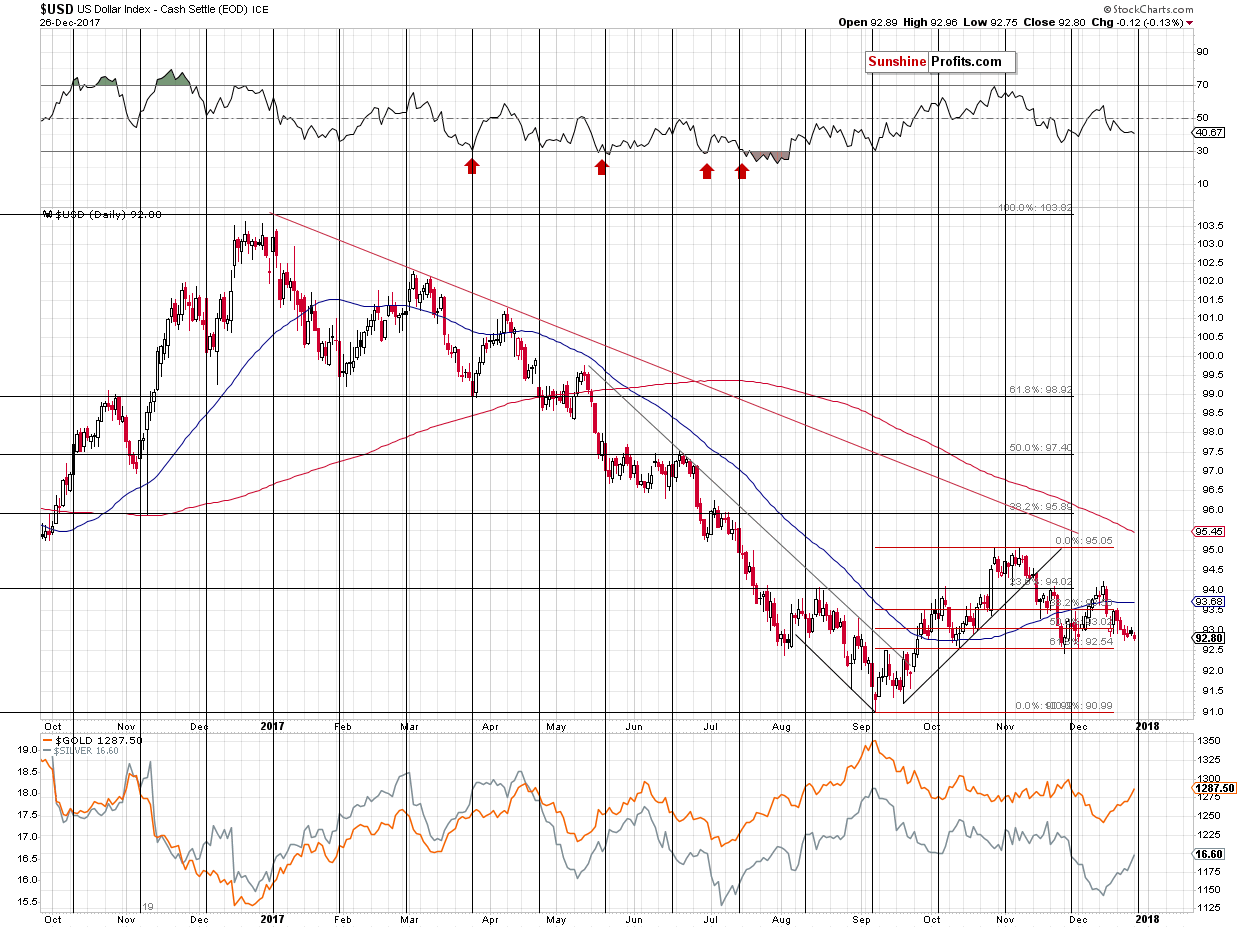
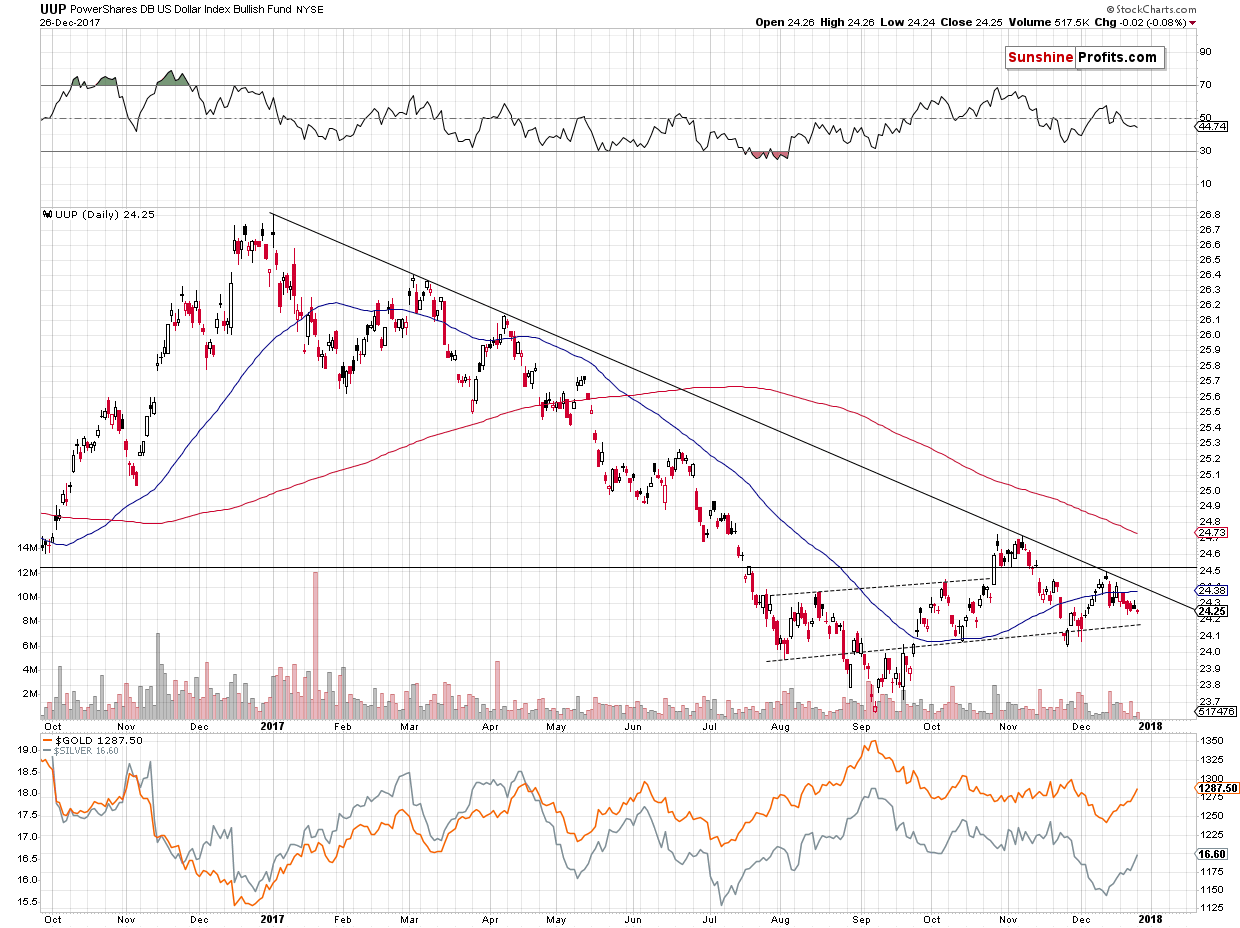
The analysis of the USD Index and its proxy (the UUP ETF) confirms our previous analysis. The USD moved lower today – to about 93, which corresponds to about $24.18 in the case of the UUP. That’s the rising dashed line, which might provide support. Consequently, the bottom might already be in or at hand. If it’s not, then the previous bottoms provide the next likely target. That’s between $24.04 and $24.1, so it’s still relatively close.
With the bottom in the USD being in or at hand, it seems that the top in the precious metals market is in or at hand as well.
The above analysis includes what’s often discussed in various places on the Internet. Well, maybe except by the mass financial media, where it is rarely the case that anything important is truly analyzed.
What we discuss below is what’s generally below the investment surface. It’s the things that people usually don’t write about because they are not aware of these relationships or that they don’t care enough to analyze them thoroughly. We do.
The first of the little-known things is that analogy to the 2013 decline in terms of the monthly price changes.
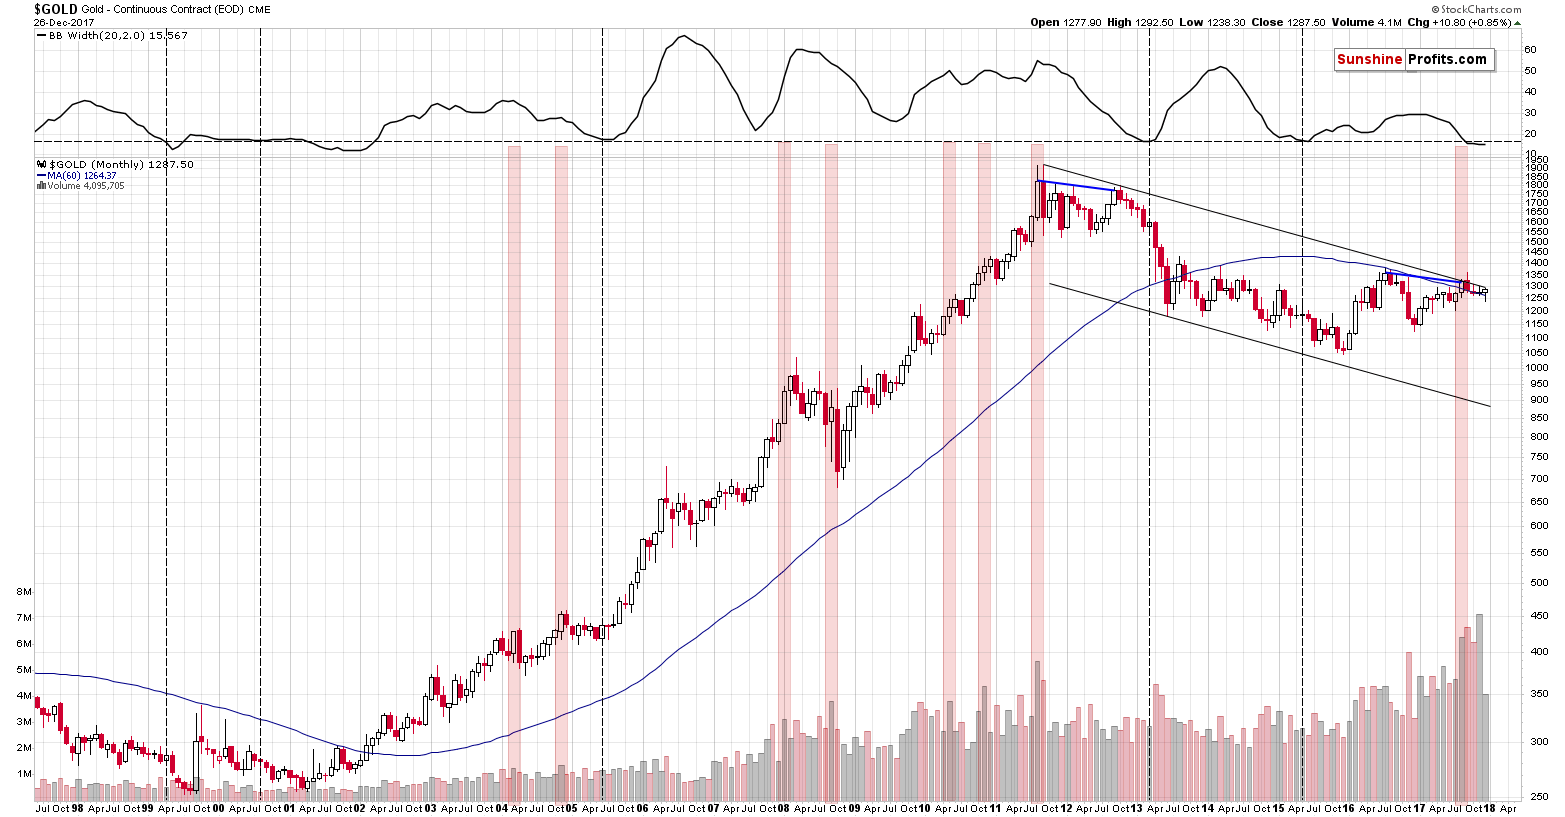
We described the analogy multiple times, but the key thing about the analogy is still right in front of us. The long-story-short version is this: the blue lines that connect the two key tops before the slide are analogous and their follow-up action is very similar as well. This makes it likely for the 2013 decline to be repeated either to the letter or on an approximate basis.
There was only one up month during the 2012 – 2013 decline and it was right before the most volatile and powerful part of the slide. This December is an up month so far, so unless gold declines shortly, we will have a very strong bearish indication for the following weeks. There are only three sessions left until the end of the year, so the above seems quite likely.

The next thing that’s rarely monitored is gold’s price in terms of the Japanese yen. Even if it is monitored, then the dynamics of the RSI indicator plotted on it are never or almost never discussed.
Gold very often moves in tune with the Japanese yen. We even received a few messages in the past years saying that analyzing gold is pointless as all it does is track the yen. On a side note, the above chart shows that between 2009 and the 2011 top, gold was much more than that.
Whenever gold doesn’t move in tune with the USD/JPY rate, the price of gold in terms of the Japanese yen changes. It recently changed significantly and the question is: “What can we infer from this kind of movement?”
Indicators are useful in many cases, including for making comparisons between price moves. Without them it would be more difficult to discuss similarities. In the current case, the RSI is after a sudden increase from below 30 to almost 70. There were only several such cases in the past decade. Two cases were seen after a multi-year rally while gold was rising within a relatively steep uptrend. We marked those cases with grey rectangles – they are not very similar to what happened recently. Gold has been trading sideways for a few years an it’s after a breakdown below the medium-term support line.
Consequently, the areas marked with red rectangles are much more similar as they were accompanied by similar developments. In these cases, gold was just finishing its corrective upswing. Sounds familiar? Exactly, that’s exactly what all the other charts are indicating.
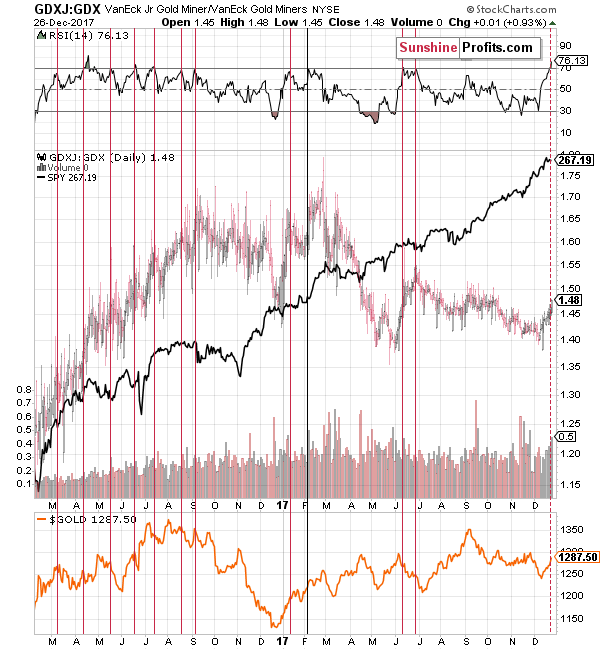
The juniors/seniors ratio is also something worth monitoring. It doesn’t flash any signals most of the time (the previous one was in June), but when it does, it usually says something important. Just like was the case previously, we’ll use the RSI indicator to emphasize similar situations.
The vast majority of times when junior mining stocks outperformed senior mining producers and the RSI moved above the 70 level were shorting opportunities. In some cases, these were very short-term opportunities (April 2016, January 2017) and in other cases bigger declines followed (September 2016, June 2017). Either way, the implications were bearish, but rather imprecise.
The RSI indicator is currently at 76, so the “shorting opportunity” signal is already flashing. However, since the signal is imprecise, it simply serves as a confirmation of what we already wrote above. Namely, that the top seems to be just around the corner and while it might be in, it’s far from certain.
Summing up, the medium-term outlook for the precious metals market remains bearish as confirmed by multiple factors, and based on the most recent short-term factors it seems that the corrective upswing in gold, silver and mining stocks is either over or close to being over. Consequently, it seems that moving back to the short side of the market is already justified, but since the very short-term outlook is still quite blurry, we are only opening a small speculative short position at this time. We are opening it at all, because the risk of missing the most volatile part of the downswing seems already too significant.
On an administrative note, due to your Editor’s Holiday- and year-end travel plans there will be no regular Gold & Silver Trading Alerts on January 2nd. In other words, this week the alerts are posted on Wednesday, Thursday and Friday, and following that, the next Alert will be posted on Wednesday, January 3rd.
However, since the situation in the precious metals is tense, we will be monitoring the market and if anything urgent happens, we’ll send you a quick message with our comments.
As always, we will keep you – our subscribers – informed.
To summarize:
Trading capital (supplementary part of the portfolio; our opinion): Short positions (50% of the full position) in gold, silver and mining stocks are justified from the risk/reward perspective with the following stop-loss orders and initial target price levels:
- Gold: initial target price: $1,218; stop-loss: $1,322; initial target price for the DGLD ETN: $53.98; stop-loss for the DGLD ETN $40.98
- Silver: initial target price: $14.63; stop-loss: $17.62; initial target price for the DSLV ETN: $33.88; stop-loss for the DSLV ETN $21.78
- Mining stocks (price levels for the GDX ETF): initial target price: $19.22; stop-loss: $26.14; initial target price for the DUST ETF: $39.88; stop-loss for the DUST ETF $19.78
In case one wants to bet on junior mining stocks' prices (we do not suggest doing so – we think senior mining stocks are more predictable in the case of short-term trades – if one wants to do it anyway, we provide the details), here are the stop-loss details and initial target prices:
- GDXJ ETF: initial target price: $27.82; stop-loss: $38.22
- JDST ETF: initial target price: $94.88 stop-loss: $37.78
Long-term capital (core part of the portfolio; our opinion): No positions (in other words: cash)
Insurance capital (core part of the portfolio; our opinion): Full position
Important Details for New Subscribers
Whether you already subscribed or not, we encourage you to find out how to make the most of our alerts and read our replies to the most common alert-and-gold-trading-related-questions.
Please note that the in the trading section we describe the situation for the day that the alert is posted. In other words, it we are writing about a speculative position, it means that it is up-to-date on the day it was posted. We are also featuring the initial target prices, so that you can decide whether keeping a position on a given day is something that is in tune with your approach (some moves are too small for medium-term traders and some might appear too big for day-traders).
Plus, you might want to read why our stop-loss orders are usually relatively far from the current price.
Please note that a full position doesn’t mean using all of the capital for a given trade. You will find details on our thoughts on gold portfolio structuring in the Key Insights section on our website.
As a reminder – “initial target price” means exactly that – an “initial” one, it’s not a price level at which we suggest closing positions. If this becomes the case (like it did in the previous trade) we will refer to these levels as levels of exit orders (exactly as we’ve done previously). Stop-loss levels, however, are naturally not “initial”, but something that, in our opinion, might be entered as an order.
Since it is impossible to synchronize target prices and stop-loss levels for all the ETFs and ETNs with the main markets that we provide these levels for (gold, silver and mining stocks – the GDX ETF), the stop-loss levels and target prices for other ETNs and ETF (among other: UGLD, DGLD, USLV, DSLV, NUGT, DUST, JNUG, JDST) are provided as supplementary, and not as “final”. This means that if a stop-loss or a target level is reached for any of the “additional instruments” (DGLD for instance), but not for the “main instrument” (gold in this case), we will view positions in both gold and DGLD as still open and the stop-loss for DGLD would have to be moved lower. On the other hand, if gold moves to a stop-loss level but DGLD doesn’t, then we will view both positions (in gold and DGLD) as closed. In other words, since it’s not possible to be 100% certain that each related instrument moves to a given level when the underlying instrument does, we can’t provide levels that would be binding. The levels that we do provide are our best estimate of the levels that will correspond to the levels in the underlying assets, but it will be the underlying assets that one will need to focus on regarding the signs pointing to closing a given position or keeping it open. We might adjust the levels in the “additional instruments” without adjusting the levels in the “main instruments”, which will simply mean that we have improved our estimation of these levels, not that we changed our outlook on the markets. We are already working on a tool that would update these levels on a daily basis for the most popular ETFs, ETNs and individual mining stocks.
Our preferred ways to invest in and to trade gold along with the reasoning can be found in the how to buy gold section. Additionally, our preferred ETFs and ETNs can be found in our Gold & Silver ETF Ranking.
As a reminder, Gold & Silver Trading Alerts are posted before or on each trading day (we usually post them before the opening bell, but we don't promise doing that each day). If there's anything urgent, we will send you an additional small alert before posting the main one.
=====
Hand-picked precious-metals-related links:
Gold touches over three-week high, palladium hits 17-year peak
The pots of gold at the east edge of London
=====
In other news:
World stocks rise as metals surge mitigates iPhone X woes
Everything You Need to Know About Global Markets in 2018
Copper Rallies to Three-Year High as China Plant Halts Output
Oil hits 2-1/2 year highs on Libyan pipeline blast
Cboe files to list multiple bitcoin ETFs
=====
Thank you.
Sincerely,
Przemyslaw Radomski, CFA
Founder, Editor-in-chief, Gold & Silver Fund Manager
Gold & Silver Trading Alerts
Forex Trading Alerts
Oil Investment Updates
Oil Trading Alerts

