

Briefly: In our opinion, full (200% of the regular size of the position) speculative short positions in gold, silver and mining stocks are justified from the risk/reward perspective at the moment of publishing this alert.
During yesterday’s session, we saw the final interest rate decision during Janet Yellen’s term as Fed’s Chair. The rates were kept intact, just as the markets expected. Gold, silver and miners were up, but just a little. Does it mean that nothing changed? No. It means that something is about to start.
The reason is that even though theoretically the markets were not nervous about the interest rate decision, the investors and traders were unwilling to commit any significant capital on any side of the trade before the tensions waned. That’s exactly what happened as we are already after the rate decision. The markets are now free to move in tune with their key trends.
The precious metals market moved a bit higher yesterday – does it indicate a change in the bearish outlook? No, and the below charts will show you why. Let’s start with the HUI Index (chart courtesy of http://stockcharts.com).
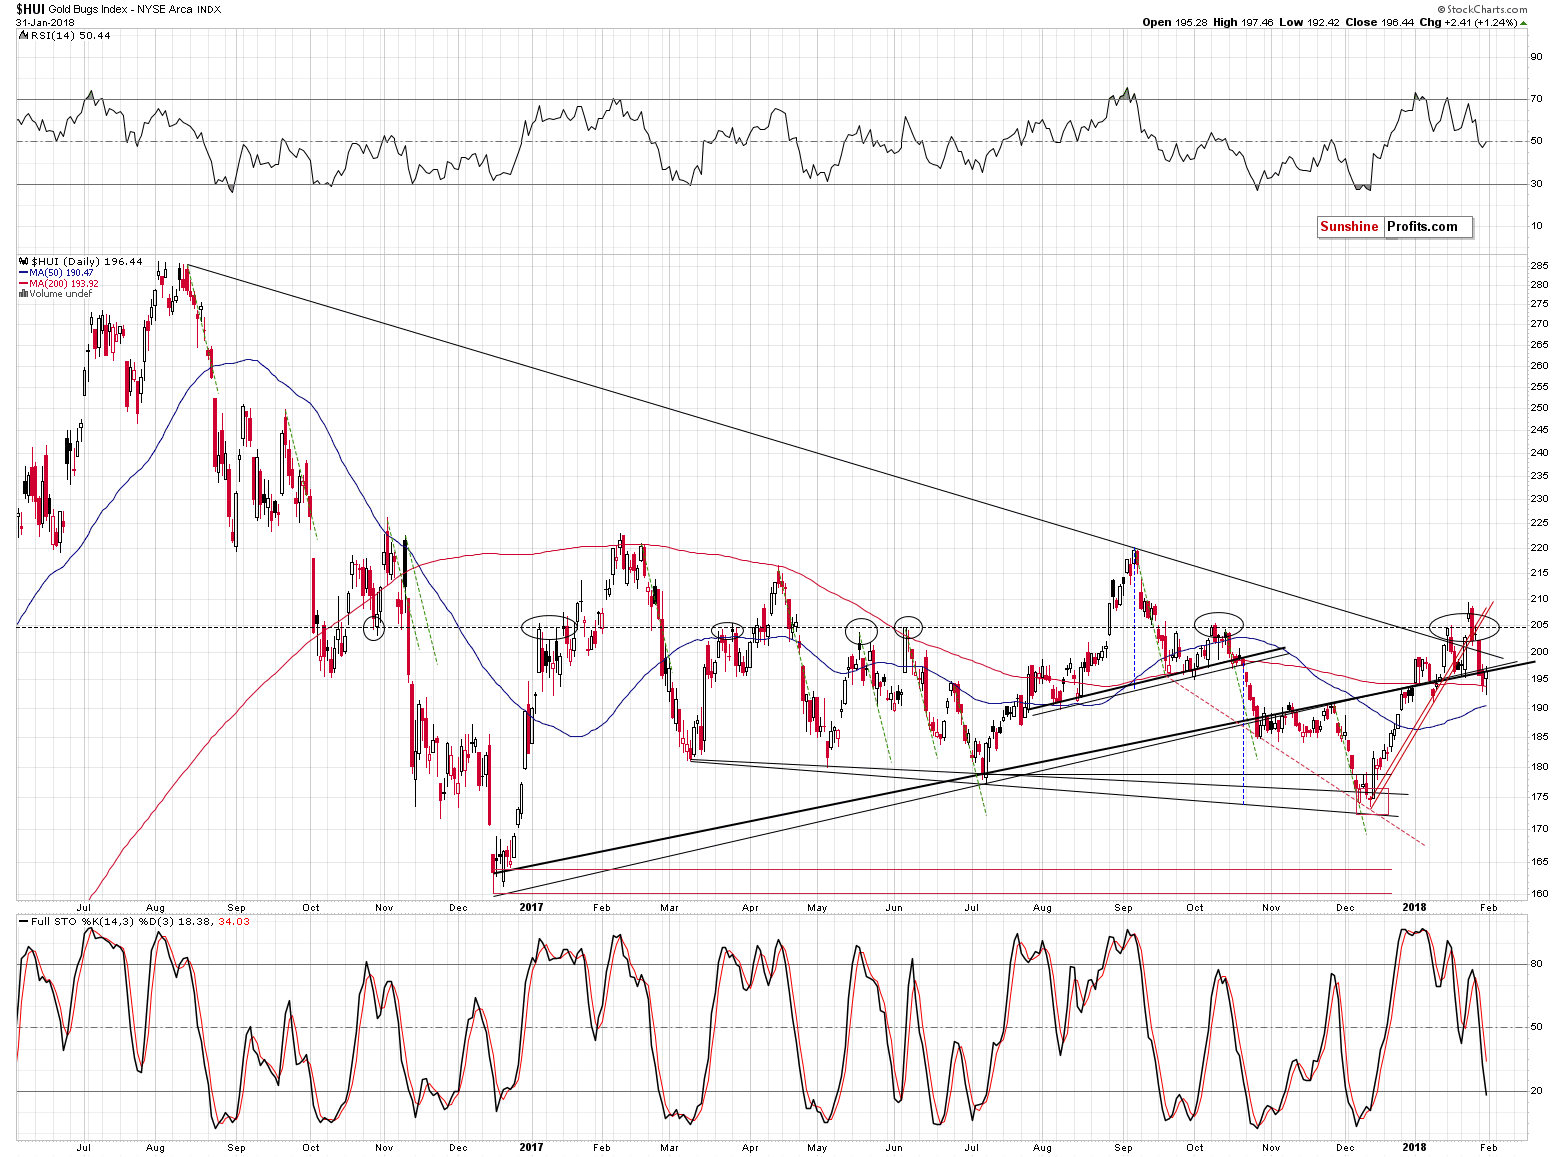
Gold miners have recently broken below all important nearby support levels that could be broken:
- The mid January high.
- The early January high.
- The late January low.
- The 205 level (invalidating the breakout).
- The declining, medium-term resistance line (invalidating the breakout).
- The rising, medium-term resistance / support line.
- The rising short-term (red) resistance / support line.
The HUI Index moved higher by 2.41 yesterday and it changed… Absolutely nothing:
- HUI is still below the mid January high.
- HUI is still below the early January high.
- HUI is still below the late January low.
- HUI is still below the 205 level (invalidating the breakout).
- HUI is still below the declining, medium-term resistance line (invalidating the breakout).
- HUI is still below the rising, medium-term resistance / support line (actually it closed at the lower of them, but since the previous close had been below it, it means that the breakdown was not invalidated).
- HUI is still below the rising short-term (red) resistance / support line.
Consequently, the bearish implications remain in place and the next big move is likely to be to the downside.
Yesterday’s session took form of a bullish reversal hammer candlestick, which could generate a daily or a 2-day rally, but we don’t expect more than that from it. Again it’s a “could”, not a “is likely to”.
In previous alerts, we also emphasized that it was not the decline in gold stocks by itself that was so bearish. It’s the gold stocks’ relationship with gold that’s important.
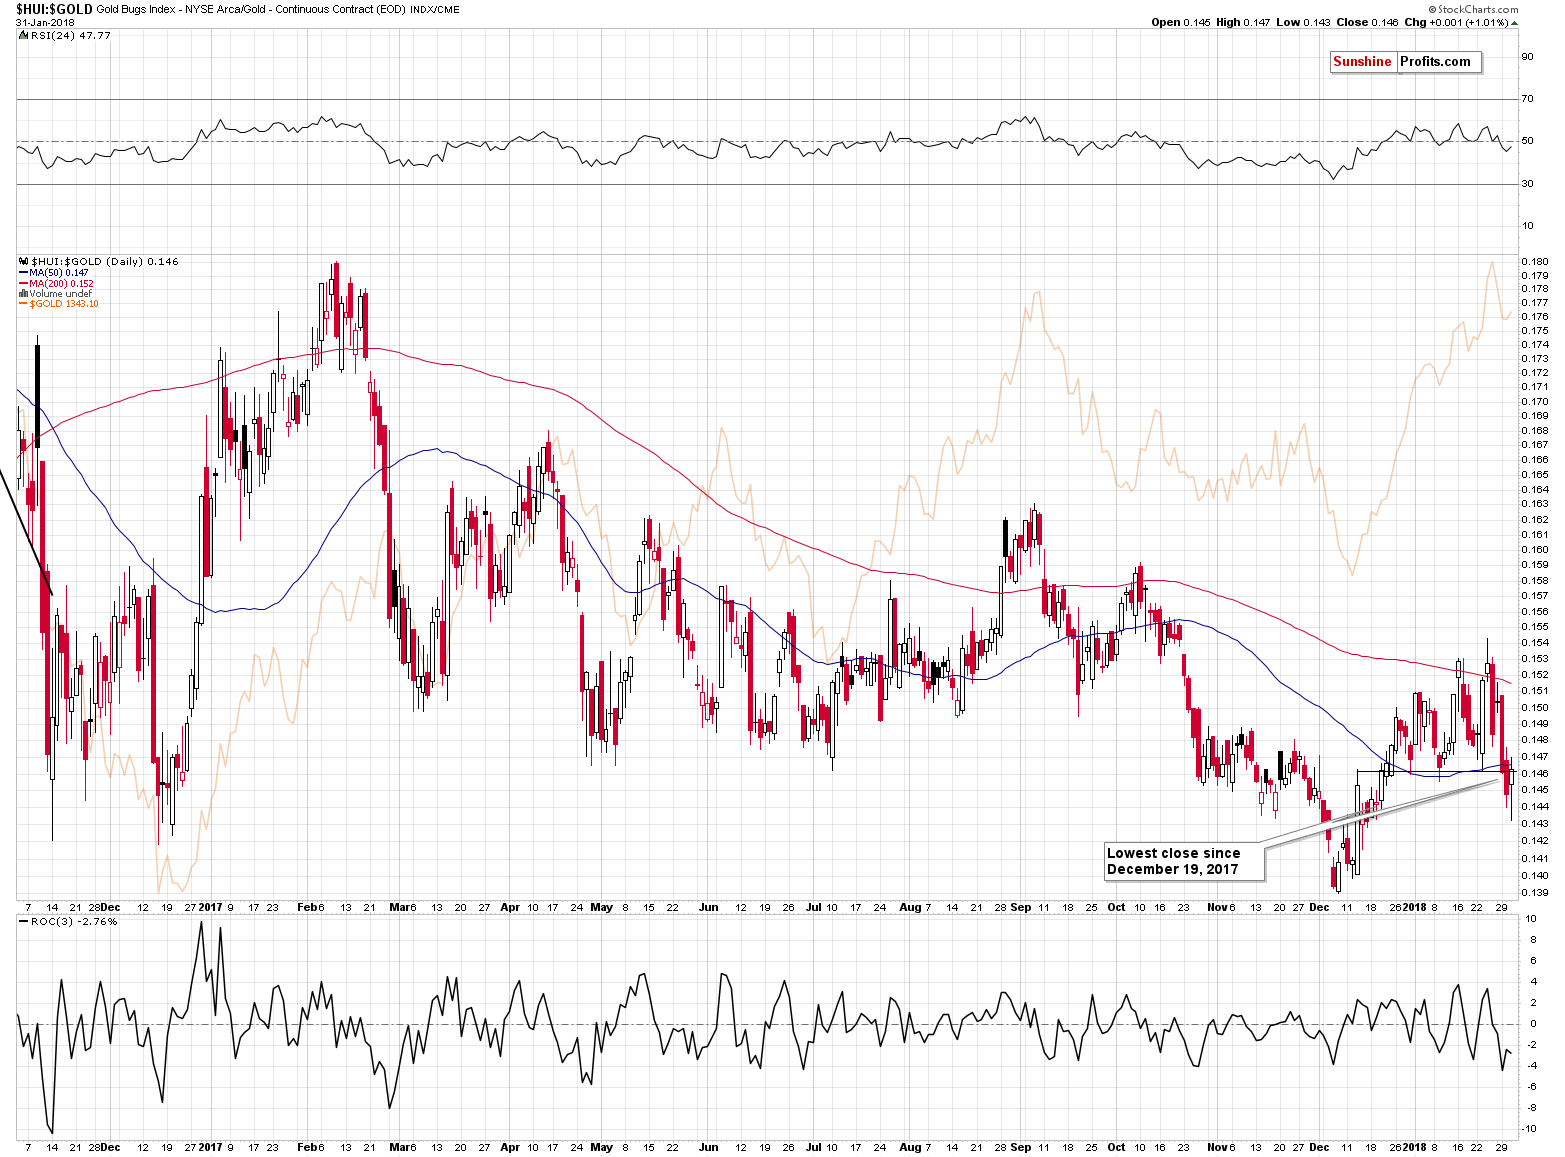
Gold stocks didn’t clearly underperform yesterday, but they didn’t outperform strongly either (silver did, though). Putting yesterday’s move higher in the HUI to gold ratio into perspective shows that it was simply a corrective upswing that erased the previous day’s decline, but nothing more than that. It was not a big rally that would change the overall trend.
It doesn’t seem to have any bullish implications also when compared to what happened in the first half of September 2017. After the initial decline in the ratio and in gold itself, we saw a few small daily upswings in the HUI to gold ratio. They were not followed by any meaningful rallies, so we don’t expect to see ones shortly either.
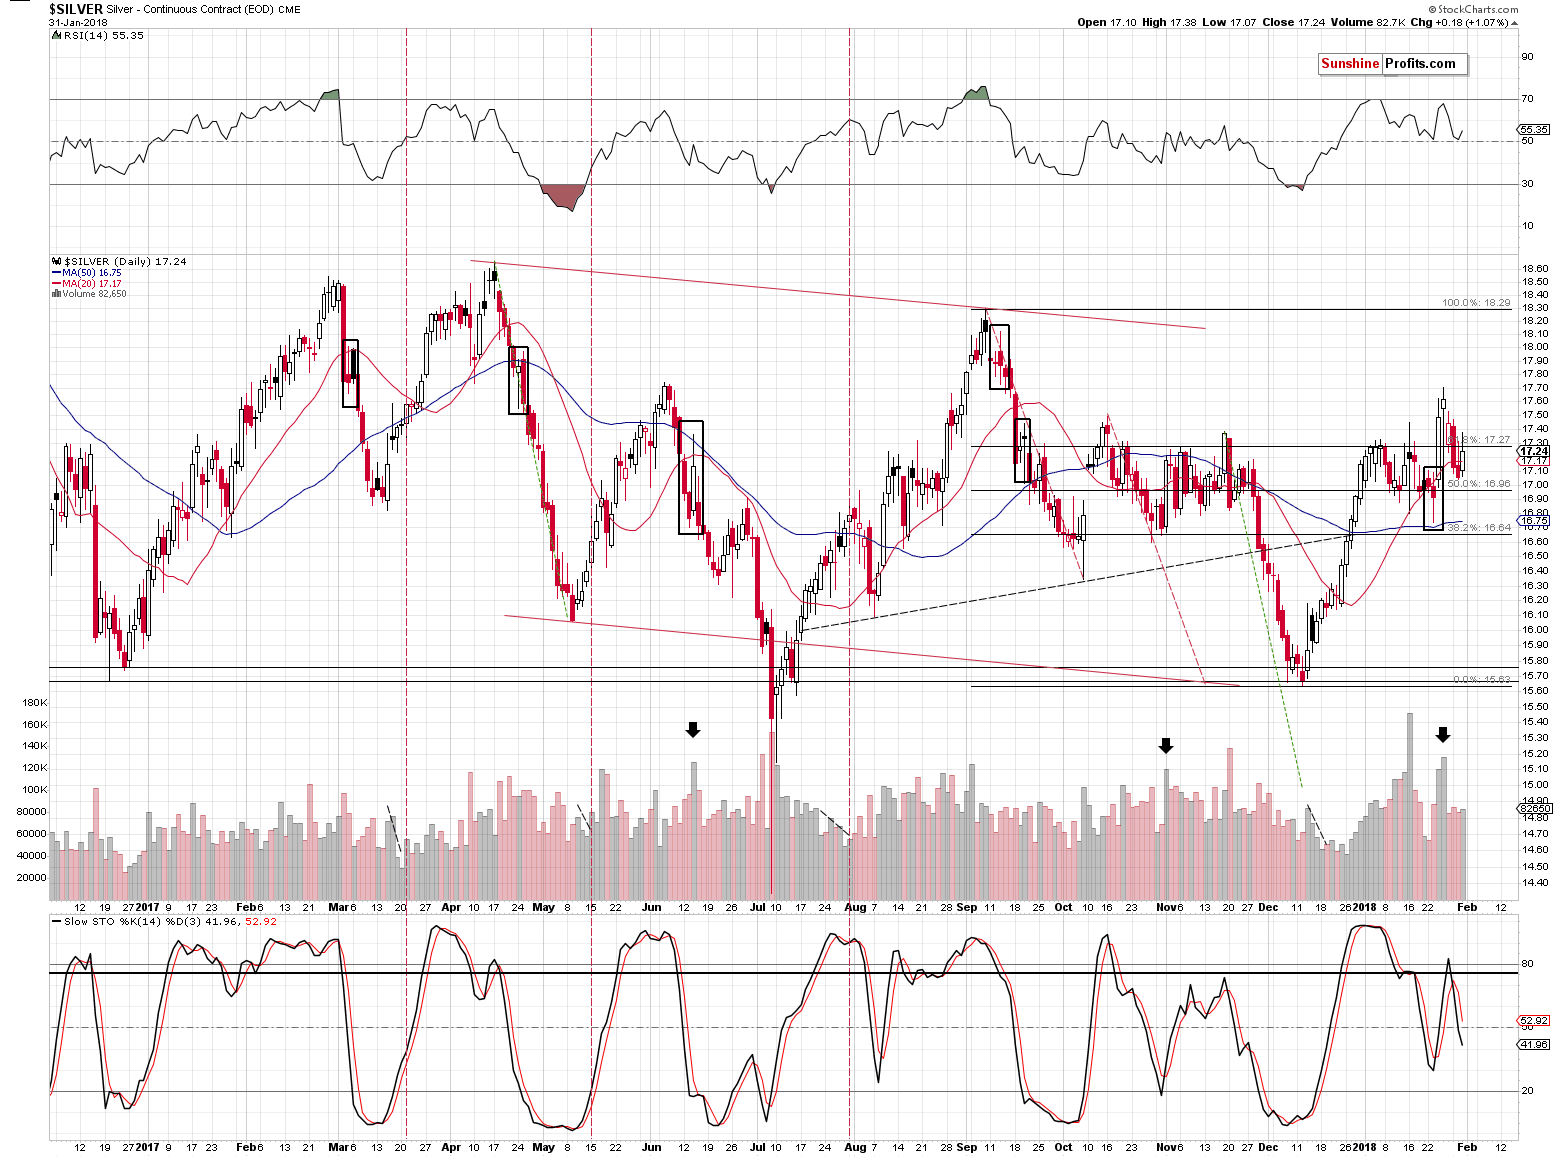
Out of the entire precious metals sector, silver’s upswing was the most visible one, especially if we factor in the intraday move to almost $17.40. As we have emphasized many times before, and as you’ve probably seen for yourself many times before, silver tends to outperform right before the decline starts. Consequently, the above type of reaction is not a bullish sign, but a bearish one.
Moreover, please note that the sell signal from the Stochastic indicator remains in play.
Is gold’s short-term picture just as bearish?
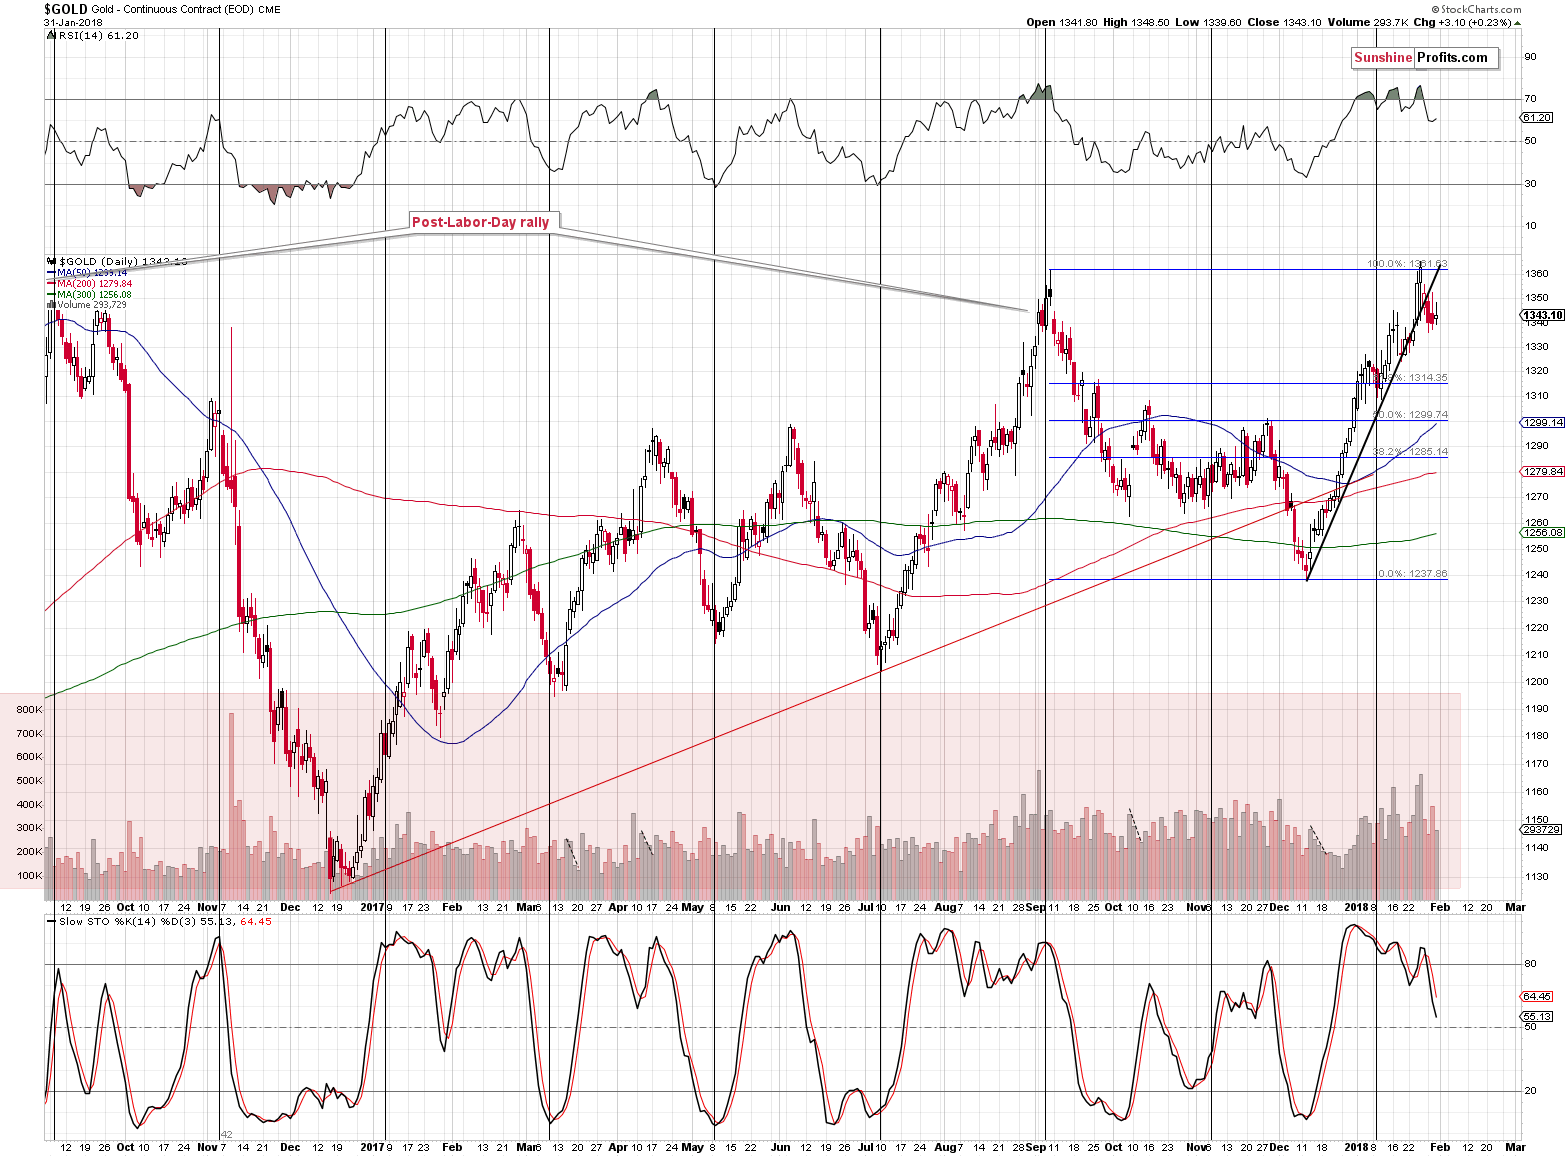
Yes. In yesterday’s alert, we wrote the following as a reply to the above question:
It’s starting to be. The yellow metal’s price moved higher during yesterday’s session, almost touching the previously broken rising support line and ended the session lower after giving up all the earlier gains. The breakdown is almost verified. Almost, because – based on our experience – it’s best to wait for 3 consecutive closing prices before saying that a breakdown is confirmed. Still, the failed attempt to move higher is a good indication that the breakdown will be confirmed and that lower prices will follow.
Even though gold ended the session a few dollars higher, it was not enough to take the yellow precious metal back above the rising support / resistance line. The short-term breakdown was therefore confirmed.
The sell signal from the Stochastic indicator remains in play in the case of gold as well.
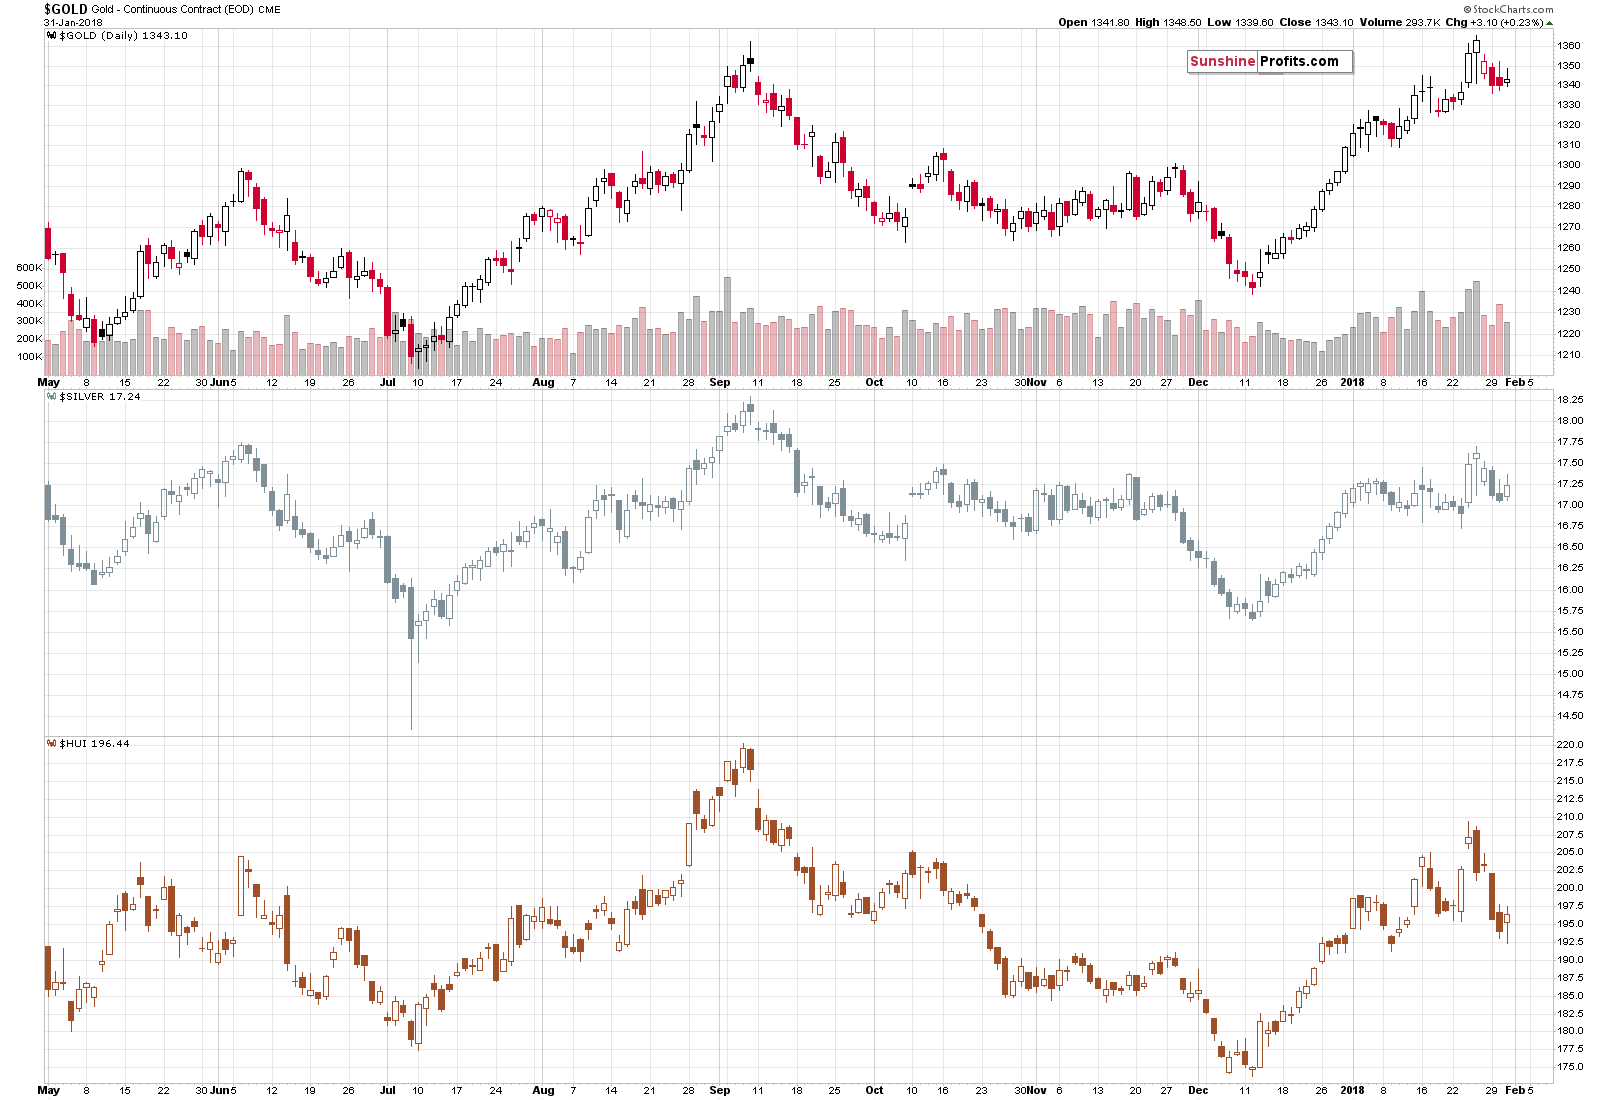
Before summarizing, we would like to emphasize the current monthly change in the price of gold.
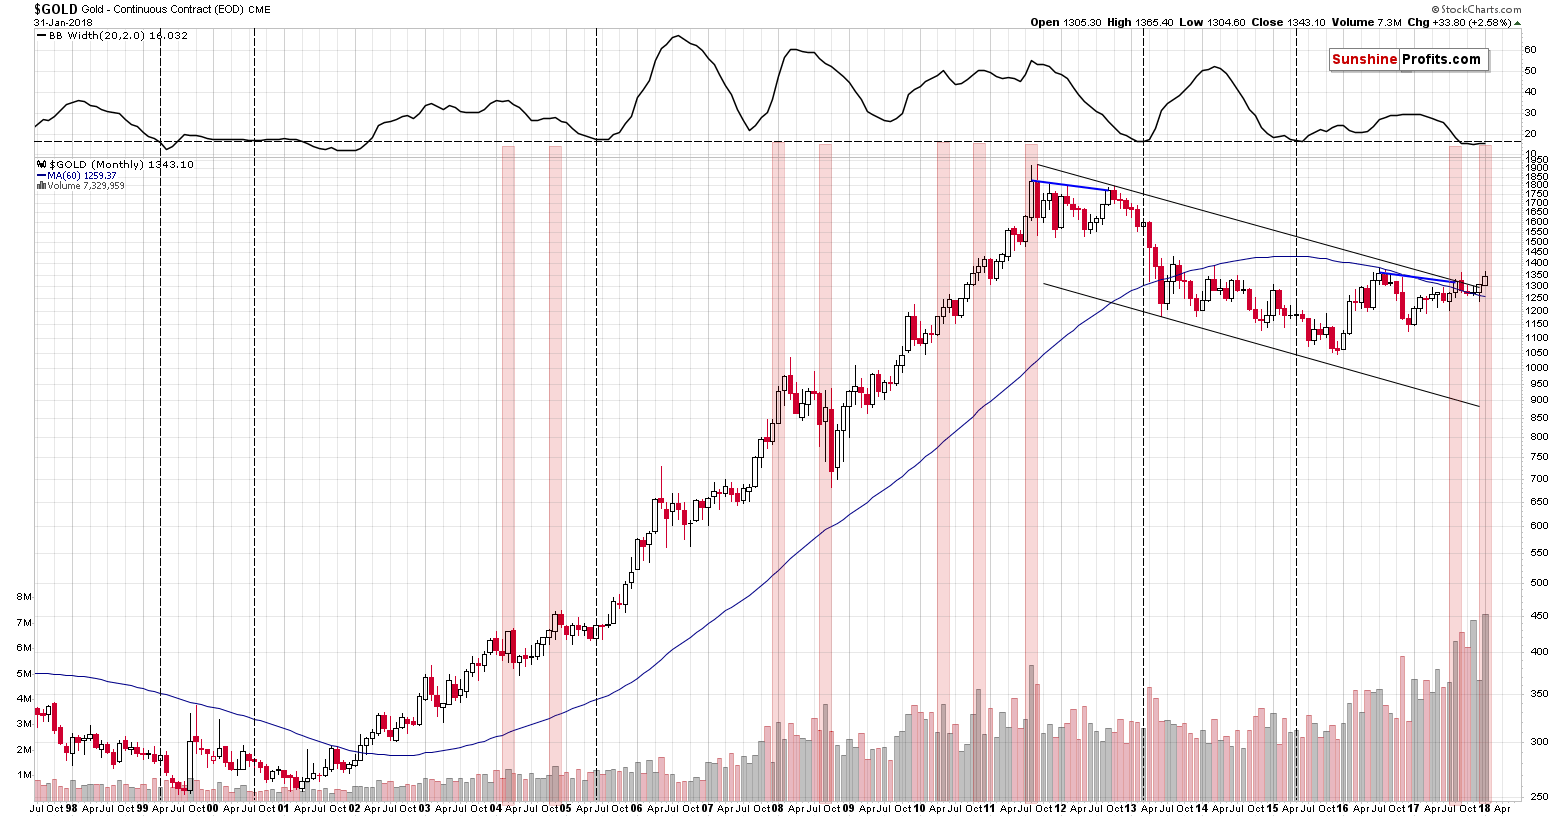
In January, gold was up not only on high volume. It was up on record-breaking volume. Sounds extremely bullish, doesn’t it? That’s what the textbook interpretation of a rally on high volume is. But, in the same textbook, somewhere at its beginning – in the first section – we have a discussion of the key rules that govern all the smaller rules. People are usually quick to jump to the most actionable stuff and miss the bigger context. In this case, the rule that is often forgotten is that history tends to repeat itself. Not necessarily to the letter, but to a considerable extent. The textbook gives hints as to what to look for (price / volume formations), but the key rule should never be forgotten. Essentially, the classic formations are guidelines that end the analysis for beginning investors and that start the analysis for professional ones.
Can this move / formation be trusted? The beginner will usually not ask this question, while a professional will always doubt.
Let’s doubt gold’s monthly rally on record-breaking volume.
We’ll proceed by checking what really happened to the price of gold when it moved higher during a given month on record-breaking volume. We marked those cases with red rectangles on the above chart.
Out of 8 previous cases… Gold declined in the following month(s) in 8 cases. Yes, in all of them. November 2017 may seem to be an exception, but back then gold was higher by so little, than it can’t be compared to other “true” rallies. In January, the price increase was clearly visible, so the analogy to the previous record-breaking months applies.
Consequently, based on the textbook’s key rule, the gold market is about to move lower based on the record-breaking volume, even if it appears counter-intuitive at first sight.
Summing up, the USD’s recent epic turnaround along with gold’s extraordinary weakness relative to the USD’s last week’s intraday decline along with multiple bearish confirmations paint a very bearish picture for the precious metals market for the following weeks. The situation was very bearish for PMs based on the above, but the record-breaking weekly volume in gold took the bearishness to a new – even more extreme – level. The monthly volume served as a confirmation of the above.
Yesterday’s small upswings in gold, silver and mining stocks didn’t invalidate anything, while silver’s temporary strength can even be viewed as a bearish sign. The outlook remains bearish.
As always, we will keep you – our subscribers – informed.
To summarize:
Trading capital (supplementary part of the portfolio; our opinion): Full short positions (200% of the full position) in gold, silver and mining stocks are justified from the risk/reward perspective with the following stop-loss orders and initial target price levels:
- Gold: initial target price: $1,218; stop-loss: $1,382; initial target price for the DGLD ETN: $53.98; stop-loss for the DGLD ETN $37.68
- Silver: initial target price: $14.63; stop-loss: $17.82; initial target price for the DSLV ETN: $33.88; stop-loss for the DSLV ETN $20.88
- Mining stocks (price levels for the GDX ETF): initial target price: $19.22; stop-loss: $26.14; initial target price for the DUST ETF: $39.88; stop-loss for the DUST ETF $15.78
In case one wants to bet on junior mining stocks' prices (we do not suggest doing so – we think senior mining stocks are more predictable in the case of short-term trades – if one wants to do it anyway, we provide the details), here are the stop-loss details and initial target prices:
- GDXJ ETF: initial target price: $27.82; stop-loss: $38.22
- JDST ETF: initial target price: $94.88 stop-loss: $37.78
Long-term capital (core part of the portfolio; our opinion): No positions (in other words: cash)
Insurance capital (core part of the portfolio; our opinion): Full position
Important Details for New Subscribers
Whether you already subscribed or not, we encourage you to find out how to make the most of our alerts and read our replies to the most common alert-and-gold-trading-related-questions.
Please note that the in the trading section we describe the situation for the day that the alert is posted. In other words, it we are writing about a speculative position, it means that it is up-to-date on the day it was posted. We are also featuring the initial target prices, so that you can decide whether keeping a position on a given day is something that is in tune with your approach (some moves are too small for medium-term traders and some might appear too big for day-traders).
Plus, you might want to read why our stop-loss orders are usually relatively far from the current price.
Please note that a full position doesn’t mean using all of the capital for a given trade. You will find details on our thoughts on gold portfolio structuring in the Key Insights section on our website.
As a reminder – “initial target price” means exactly that – an “initial” one, it’s not a price level at which we suggest closing positions. If this becomes the case (like it did in the previous trade) we will refer to these levels as levels of exit orders (exactly as we’ve done previously). Stop-loss levels, however, are naturally not “initial”, but something that, in our opinion, might be entered as an order.
Since it is impossible to synchronize target prices and stop-loss levels for all the ETFs and ETNs with the main markets that we provide these levels for (gold, silver and mining stocks – the GDX ETF), the stop-loss levels and target prices for other ETNs and ETF (among other: UGLD, DGLD, USLV, DSLV, NUGT, DUST, JNUG, JDST) are provided as supplementary, and not as “final”. This means that if a stop-loss or a target level is reached for any of the “additional instruments” (DGLD for instance), but not for the “main instrument” (gold in this case), we will view positions in both gold and DGLD as still open and the stop-loss for DGLD would have to be moved lower. On the other hand, if gold moves to a stop-loss level but DGLD doesn’t, then we will view both positions (in gold and DGLD) as closed. In other words, since it’s not possible to be 100% certain that each related instrument moves to a given level when the underlying instrument does, we can’t provide levels that would be binding. The levels that we do provide are our best estimate of the levels that will correspond to the levels in the underlying assets, but it will be the underlying assets that one will need to focus on regarding the signs pointing to closing a given position or keeping it open. We might adjust the levels in the “additional instruments” without adjusting the levels in the “main instruments”, which will simply mean that we have improved our estimation of these levels, not that we changed our outlook on the markets. We are already working on a tool that would update these levels on a daily basis for the most popular ETFs, ETNs and individual mining stocks.
Our preferred ways to invest in and to trade gold along with the reasoning can be found in the how to buy gold section. Additionally, our preferred ETFs and ETNs can be found in our Gold & Silver ETF Ranking.
As a reminder, Gold & Silver Trading Alerts are posted before or on each trading day (we usually post them before the opening bell, but we don't promise doing that each day). If there's anything urgent, we will send you an additional small alert before posting the main one.
=====
Latest Free Trading Alerts:
The World Gold Council published its gold market outlook for 2018. Will gold continue its January rally or should we expect declines?
Four Key Trends for Gold Market in 2018
S&P 500 index gained 0.05% on Wednesday, as it fluctuated following its Monday-Tuesday move down. For now, it looks like some relatively flat correction within a short-term downtrend. We will probably see more uncertainty ahead of quarterly earnings releases and tomorrow's monthly jobs report release.
Stocks Went Sideways, No Quick Reversal Means Trouble
=====
Hand-picked precious-metals-related links:
PRECIOUS-Gold dips ahead of U.S. nonfarm payroll data
PRECIOUS-Gold dips on outlook for U.S. rate hikes
U.S. Mint American Eagle coin sales fall from prior year
China's gold consumption rises 9.41 pct in 2017
Russia's Nornickel says palladium output may fall in 2018
=====
In other news:
Former Fed Chair Alan Greenspan Sees Bubbles in Stocks and Bonds
The risks of an economic 'hard landing' are rising in the US
Euro zone manufacturing boom rolls on into new year: PMI
China reasonably comfortable with sharp yuan gains, for now - sources
Goldman Sachs Felt Rushed by Quick Rollout of Bitcoin Futures
=====
Thank you.
Sincerely,
Przemyslaw Radomski, CFA
Founder, Editor-in-chief, Gold & Silver Fund Manager
Gold & Silver Trading Alerts
Forex Trading Alerts
Oil Investment Updates
Oil Trading Alerts

