

Briefly: In our opinion, full (150% of the regular size of the position) speculative short positions in gold, silver and mining stocks are justified from the risk/reward perspective at the moment of publishing this alert. We are moving the stop-loss level for gold higher and (if applicable) re-opening the short position in it.
Gold and silver futures moved slightly higher yesterday, but the GLD and SLV ETFs closed the session lower and the same goes for both the GDX ETF and the HUI Index. Have we just seen the top?
In short, it seems likely. Like yesterday, let’s start today’s analysis with mining stocks (chart courtesy of http://stockcharts.com).
In yesterday’s alert, we commented on the above chart in the following way:
Gold stocks indeed broke above the rising support lines, but since that was only one close above them, the breakout is unconfirmed. There are several reasons to think that it will not be confirmed without even considering the apex-based reversal or gold’s cyclical turning point.
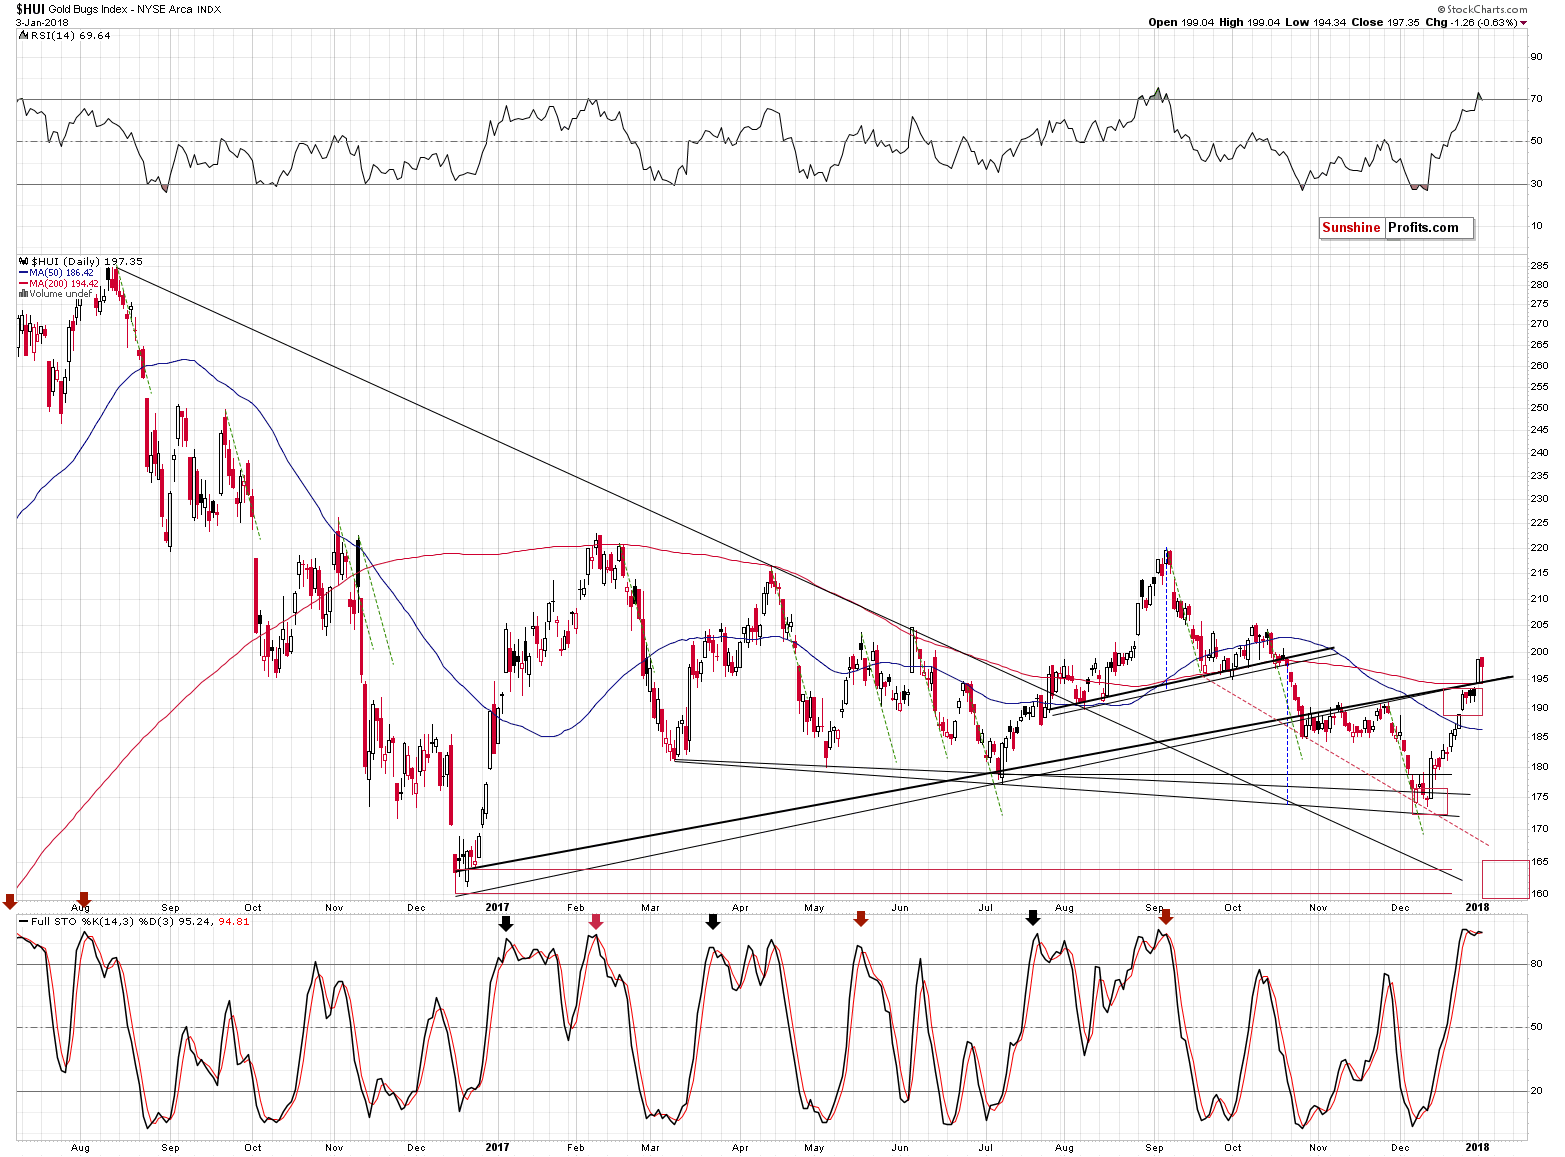
The two things that we would like to discuss with regard to the above chart are: the 200-day moving average, and the RSI above the 70 level.
The former was broken rather insignificantly and this doesn’t invalidate the bearish analogy to the previous similar patterns. For instance, in February, the day when the HUI Index closed above the 200-day MA was the day of the final top. In fact, higher HUI values have never been seen since that time. The June rally also ended above the MA, but the follow-up action was very bearish.
As far as the second factor is concerned, there was only one case in the previous months, when the RSI indicator moved as high as it did yesterday - in early September. Mining stocks started an almost 50-index point-decline shortly thereafter.
Moreover, the moments when the RSI moved only to 70 level, without breaking above it, were almost always times when it was a good idea to be short the precious metals market. July 2016, February 2017, and the August-September 2017 top were all confirmed by the RSI at or above the 70 level. Naturally, the implications are bearish.
The HUI Index moved back to the rising support line and then moved back up, and looking at the above chart alone, it seems that the breakout is being verified. However, since the general stock market soared visibly, and miners still ended the session lower, it doesn’t seem that this is really the case.
The RSI indicator moved back below the 70 level thus confirming the sell signal.
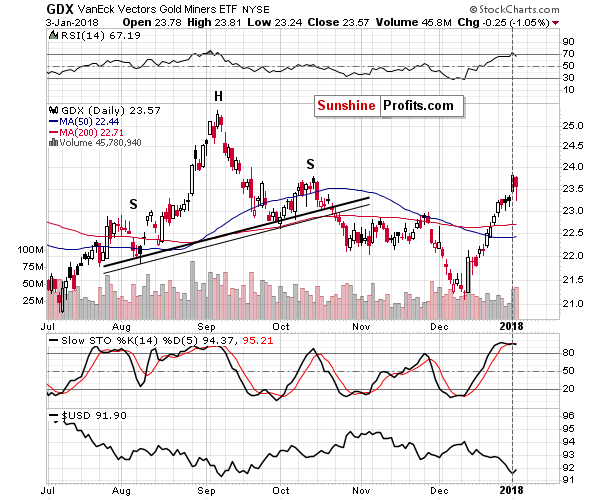
We saw the same kind of signal in the RSI based on the GDX ETF. Additionally, we saw that miners declined on volume that was slightly higher than the volume accompanying Tuesday’s upswing. The implications are bearish.
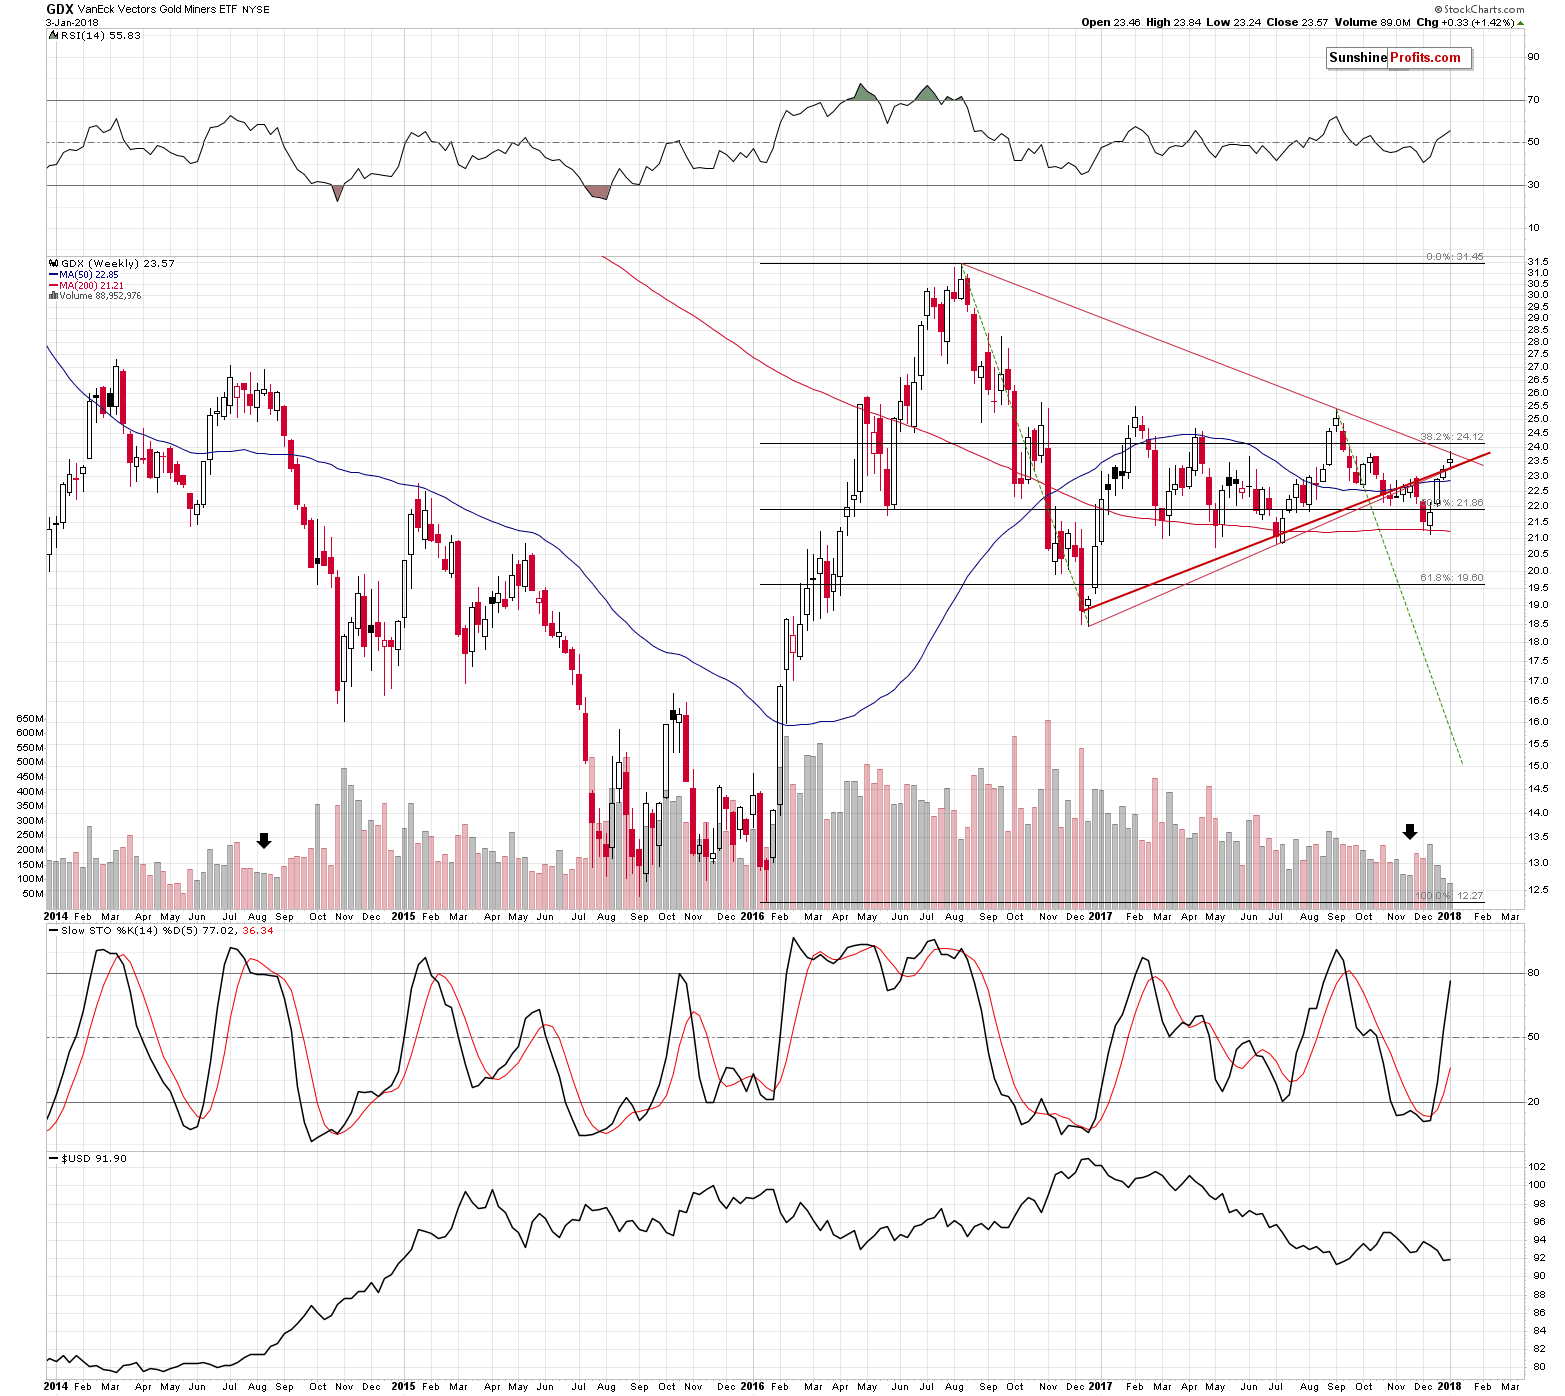
From the weekly perspective, we have a situation where GDX simply moved to its declining resistance line and then moved lower. The implications remain bearish.
In yesterday’s alert, we emphasized that the key reason why we shouldn’t trust yesterday’s move was not visible on the above charts.
The reason was selling during the year or at its end due to tax reasons and then buying back at the beginning of the year. In this way, investors are able to book the losses, which often leads to a decrease in one’s taxes on investments. Those who want to keep the exposure to a given stock, often buy back during the first day of the following year.
Consequently, Tuesday’s “strength” in mining stocks is likely no strength at all – it’s likely just a result of a tax-optimizing technique.
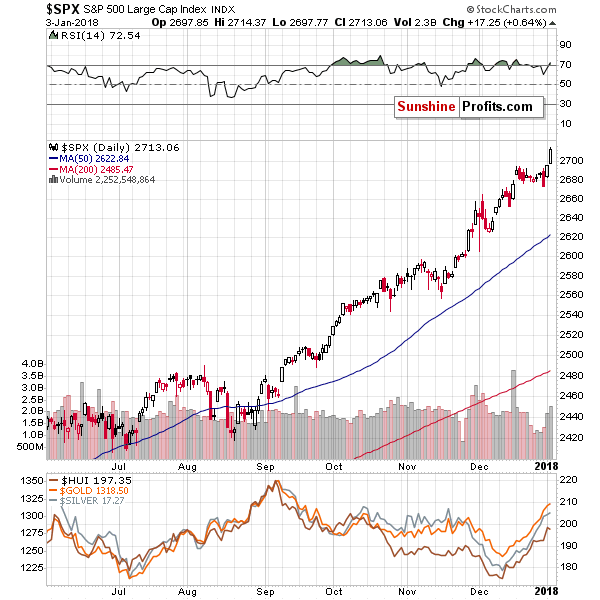
Now, the general stock market soared once again yesterday, but mining stocks didn’t. This actually shows weakness in mining stocks, not strength.
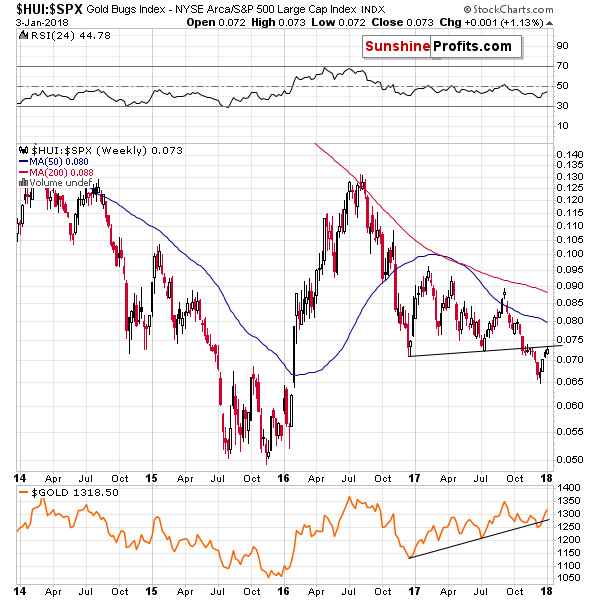
The above chart confirms the bearish implications as it shows that the recent upswing, was just a verification of the breakdown. In yesterday’s alert, we commented on it in the following way:
The above chart showing the golds stock ratio to the general stock market shows that there was no major breakout yesterday. Why? Because by looking at the ratio, we’re looking at the chart that “takes out” the factors that impact the entire stock market in the same way. In math, when we do the same multiplication for the numerator and the denominator of a faction, we are left with the same fraction. So, since there was no major move in the ratio, it seems that the same thing caused the rally in both markets and thus, what we saw yesterday was not a sign of strength in the precious metals sector.
Based on yesterday’s session, the ratio moved a bit lower, making it crystal clear that there was indeed no breakout.
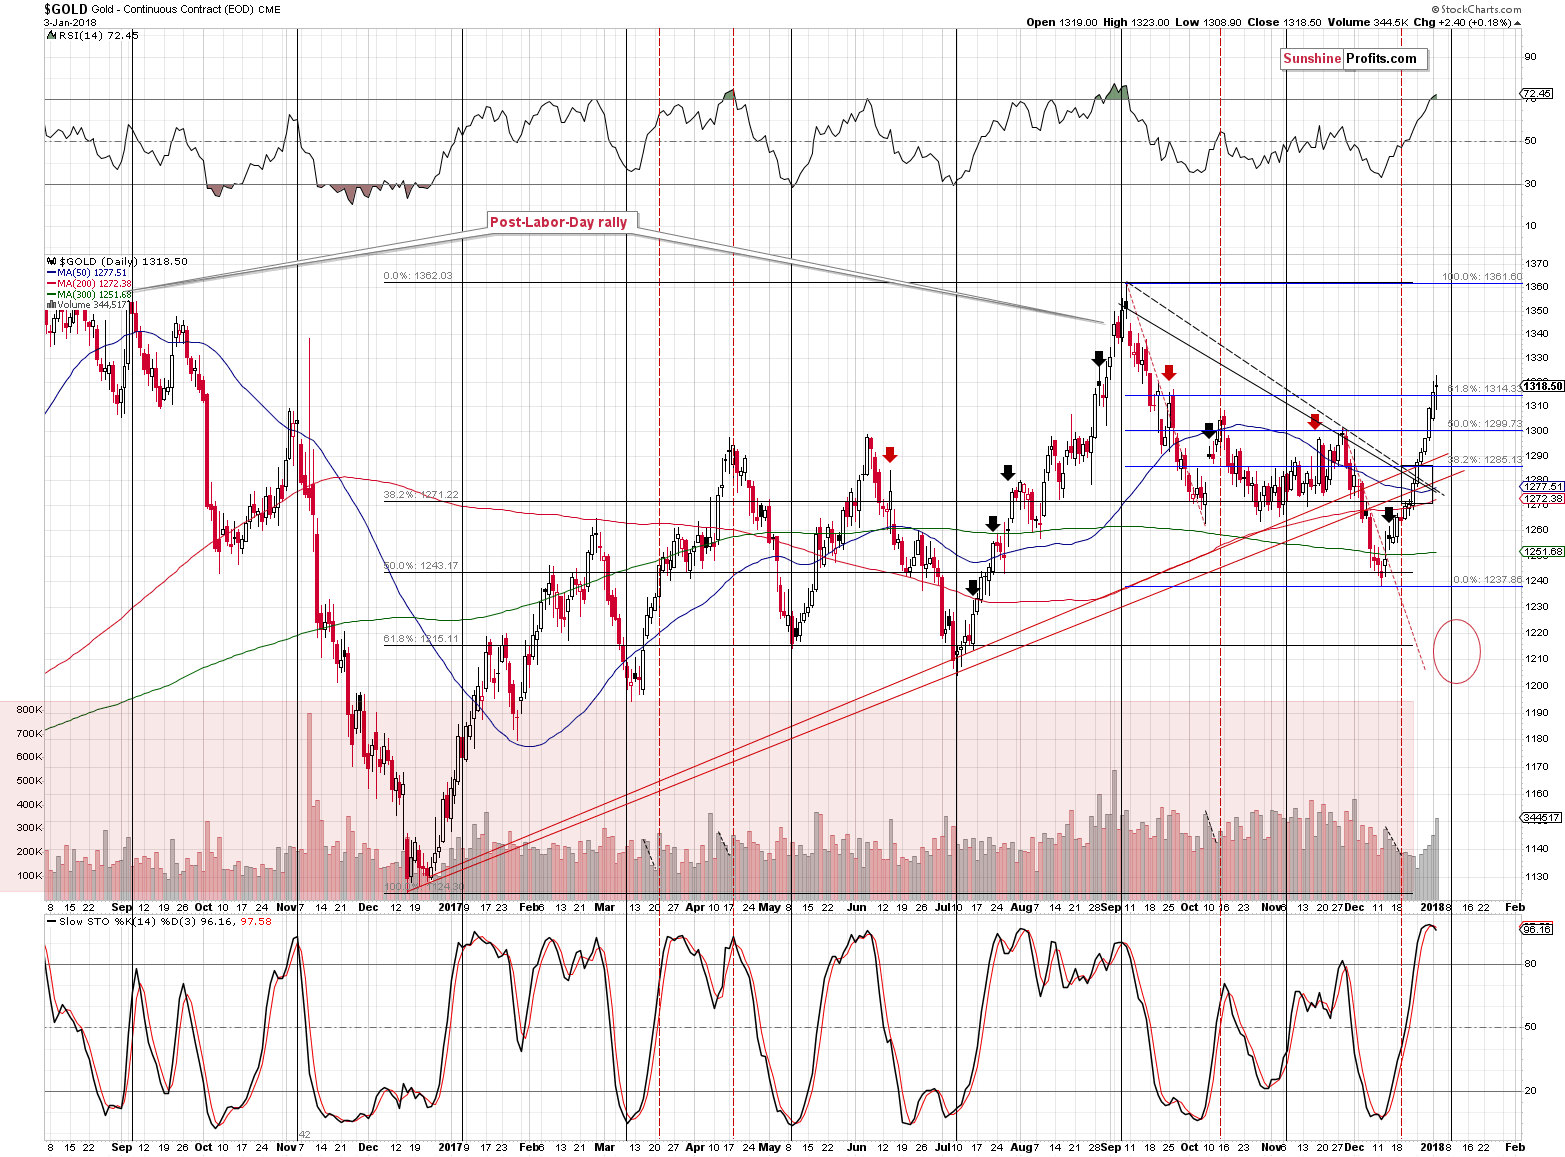
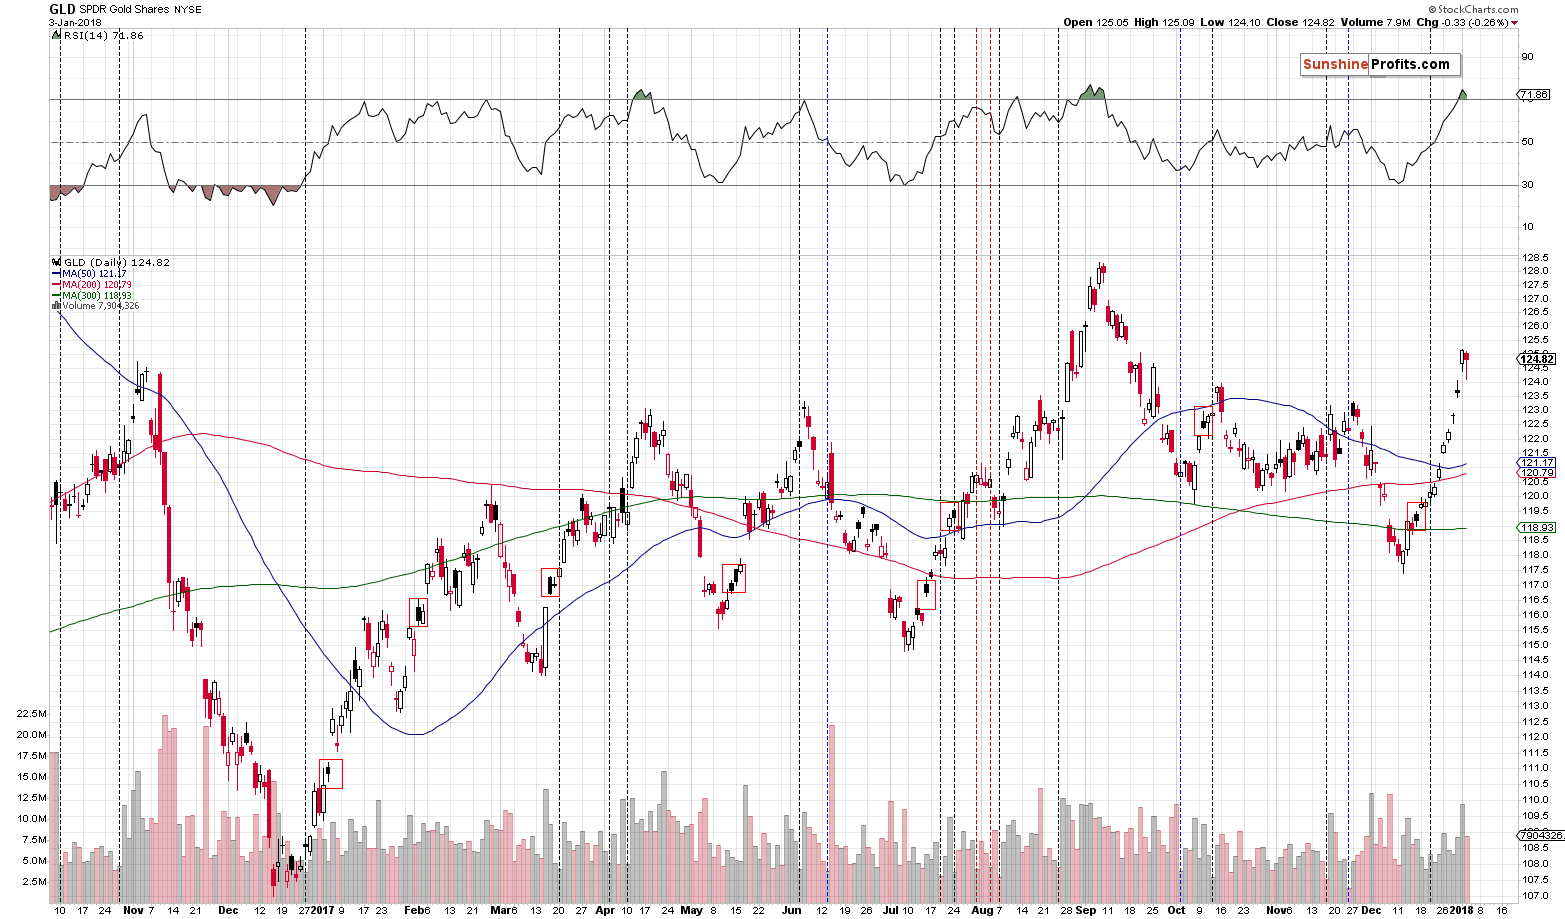
Gold futures closed higher yesterday, but the GLD ETF didn’t, so depending on which proxy for gold we decide to use, we get different readings. However, even in the case of gold futures, we get the bearish signals from both above indicators: the RSI and Stochastic. All in all, our yesterday’s comments remain up-to-date:
Gold moved to the 61.8% Fibonacci retracement level, the RSI indicator moved above 70 and the Stochastic flashed a (small, but still) sell signal. Despite gold’s relentless rally in the final part of 2017 and during yesterday’s session, the above combination implies that the top is in or that will be in this week.
In particular, the RSI at 70 pointed to turnarounds in the majority of cases, including the April and June 2017 tops. Interestingly, last year’s early rally (it started in late 2016, to be precise) ended (there was no major breakout for months) only after the RSI moved above the 70 level. Is the rally over given the current position of the RSI? It seems likely.
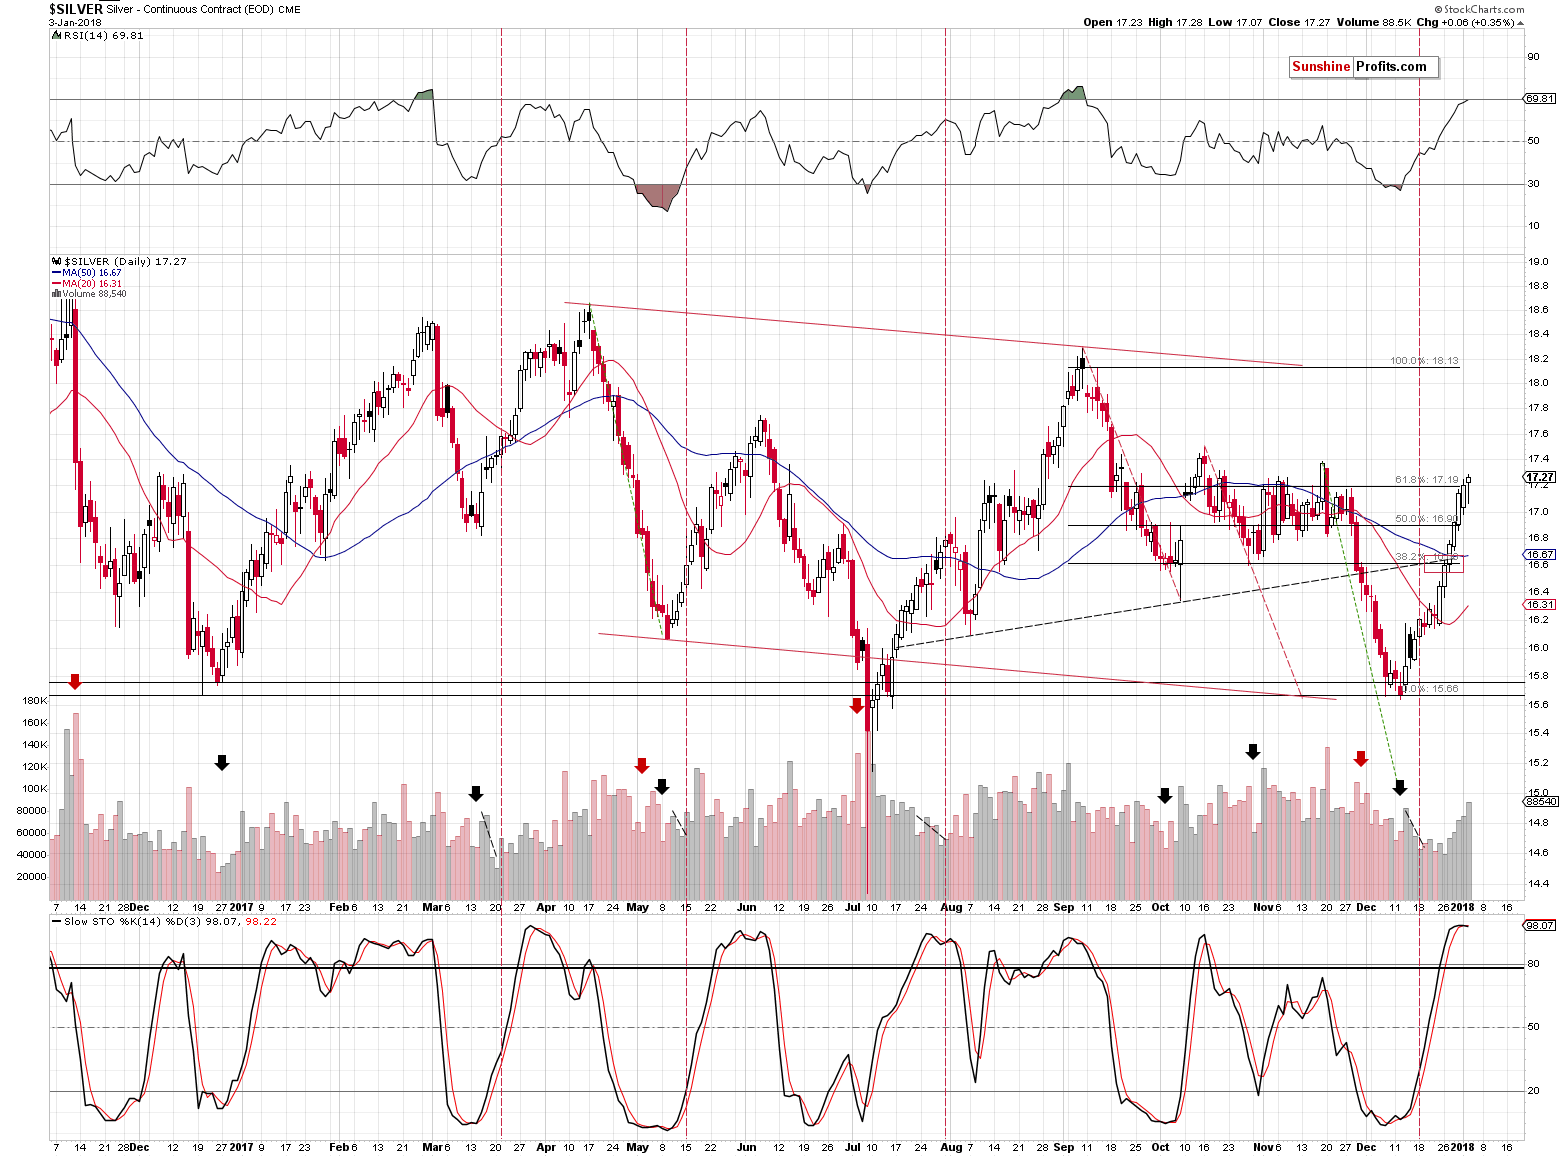
What we said about gold indicators can also be said about silver indicators. In yesterday’s alert we wrote that the Stochastic indicator hadn’t flashed a sell signal yet, but it was extremely close to doing so. The signal did indeed emerge based on yesterday’s session.
The RSI is very close to the 70 level (69.81), which has bearish implications. Plus, just like it is the case with gold, silver moved to the 61.8% Fibonacci retracement level.
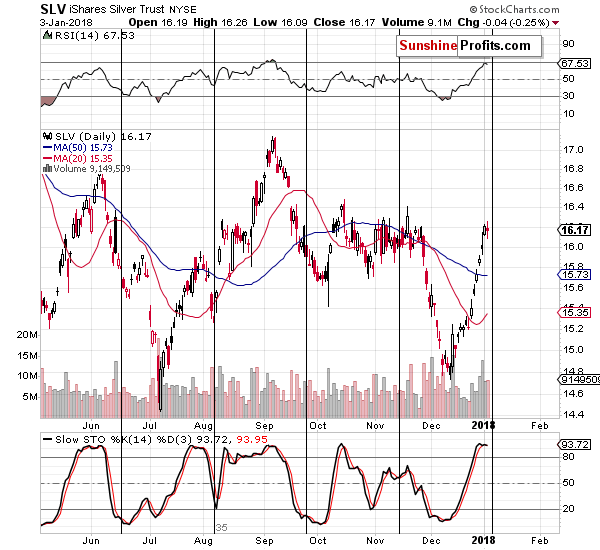
Also, let’s not forget that silver’s turning point is just around the corner and it’s crystal clear that the move preceding it is up. Consequently, the implications are clearly bearish.
Moreover, just like it was the case with gold futures and GLD, even though silver futures closed 6 cents higher, the SLV ETF declined yesterday. Did the top just form? It seems likely.
Summing up, the medium-term outlook for the precious metals market remains bearish as confirmed by multiple factors, and based on the most recent short-term factors, it seems that the corrective upswing in gold, silver and mining stocks is either over or close to being over. Tuesday’s strength in mining stocks is most likely not real strength, but rather a tax-optimization technique. Consequently, it should not be trusted, also because the breakout in the HUI Index is not confirmed and several other resistance levels are in play. It seems that the downswing will start shortly. It might have even started yesterday as GLD, SLV, HUI and GDX indicate.
The price of gold moved very close to our stop-loss level and – depending on the investment vehicle that is used – the stop-loss could have been triggered. If so, we think that re-opening the short position is justified, as the outlook didn’t change and it remains bearish.
Moreover, we are moving the stop-loss level for gold higher.
As always, we will keep you – our subscribers – informed.
To summarize:
Trading capital (supplementary part of the portfolio; our opinion): Full short positions (150% of the full position) in gold, silver and mining stocks are justified from the risk/reward perspective with the following stop-loss orders and initial target price levels:
- Gold: initial target price: $1,218; stop-loss: $1,343; initial target price for the DGLD ETN: $53.98; stop-loss for the DGLD ETN $40.28
- Silver: initial target price: $14.63; stop-loss: $17.62; initial target price for the DSLV ETN: $33.88; stop-loss for the DSLV ETN $21.78
- Mining stocks (price levels for the GDX ETF): initial target price: $19.22; stop-loss: $26.14; initial target price for the DUST ETF: $39.88; stop-loss for the DUST ETF $19.78
In case one wants to bet on junior mining stocks' prices (we do not suggest doing so – we think senior mining stocks are more predictable in the case of short-term trades – if one wants to do it anyway, we provide the details), here are the stop-loss details and initial target prices:
- GDXJ ETF: initial target price: $27.82; stop-loss: $38.22
- JDST ETF: initial target price: $94.88 stop-loss: $37.78
Long-term capital (core part of the portfolio; our opinion): No positions (in other words: cash)
Insurance capital (core part of the portfolio; our opinion): Full position
Important Details for New Subscribers
Whether you already subscribed or not, we encourage you to find out how to make the most of our alerts and read our replies to the most common alert-and-gold-trading-related-questions.
Please note that the in the trading section we describe the situation for the day that the alert is posted. In other words, it we are writing about a speculative position, it means that it is up-to-date on the day it was posted. We are also featuring the initial target prices, so that you can decide whether keeping a position on a given day is something that is in tune with your approach (some moves are too small for medium-term traders and some might appear too big for day-traders).
Plus, you might want to read why our stop-loss orders are usually relatively far from the current price.
Please note that a full position doesn’t mean using all of the capital for a given trade. You will find details on our thoughts on gold portfolio structuring in the Key Insights section on our website.
As a reminder – “initial target price” means exactly that – an “initial” one, it’s not a price level at which we suggest closing positions. If this becomes the case (like it did in the previous trade) we will refer to these levels as levels of exit orders (exactly as we’ve done previously). Stop-loss levels, however, are naturally not “initial”, but something that, in our opinion, might be entered as an order.
Since it is impossible to synchronize target prices and stop-loss levels for all the ETFs and ETNs with the main markets that we provide these levels for (gold, silver and mining stocks – the GDX ETF), the stop-loss levels and target prices for other ETNs and ETF (among other: UGLD, DGLD, USLV, DSLV, NUGT, DUST, JNUG, JDST) are provided as supplementary, and not as “final”. This means that if a stop-loss or a target level is reached for any of the “additional instruments” (DGLD for instance), but not for the “main instrument” (gold in this case), we will view positions in both gold and DGLD as still open and the stop-loss for DGLD would have to be moved lower. On the other hand, if gold moves to a stop-loss level but DGLD doesn’t, then we will view both positions (in gold and DGLD) as closed. In other words, since it’s not possible to be 100% certain that each related instrument moves to a given level when the underlying instrument does, we can’t provide levels that would be binding. The levels that we do provide are our best estimate of the levels that will correspond to the levels in the underlying assets, but it will be the underlying assets that one will need to focus on regarding the signs pointing to closing a given position or keeping it open. We might adjust the levels in the “additional instruments” without adjusting the levels in the “main instruments”, which will simply mean that we have improved our estimation of these levels, not that we changed our outlook on the markets. We are already working on a tool that would update these levels on a daily basis for the most popular ETFs, ETNs and individual mining stocks.
Our preferred ways to invest in and to trade gold along with the reasoning can be found in the how to buy gold section. Additionally, our preferred ETFs and ETNs can be found in our Gold & Silver ETF Ranking.
As a reminder, Gold & Silver Trading Alerts are posted before or on each trading day (we usually post them before the opening bell, but we don't promise doing that each day). If there's anything urgent, we will send you an additional small alert before posting the main one.
=====
Hand-picked precious-metals-related links:
CME Group metals average volume shoot up 48% y/y in December
Credit Suisse: Investment Outlook 2018
Goldman Sachs: 2018 Investment Outlook
Germans invest heavily in gold in 2017, Deutsche Boerse says
=====
In other news:
The Fed says it could speed up rate hikes because of Trump's tax cuts
Stocks records tumble, oil at highest since 2015
European stocks rally picks up pace as services growth impresses
BofA Includes Bitcoin Trust in Broader Ban on Investments
Security flaws put virtually all phones, computers at risk
=====
Thank you.
Sincerely,
Przemyslaw Radomski, CFA
Founder, Editor-in-chief, Gold & Silver Fund Manager
Gold & Silver Trading Alerts
Forex Trading Alerts
Oil Investment Updates
Oil Trading Alerts

