

Briefly: In our opinion, full (150% of the regular size of the position) speculative short positions in gold, silver and mining stocks are justified from the risk/reward perspective at the moment of publishing this alert.
Gold stocks (the HUI Index) declined substantially on Tuesday, closing at new 2018 lows. We wrote that this was a bearish event, but that another upswing could still take place shortly based on the analogies to the previous volatile declines. But, this was before yesterday’s session, during which we saw yet another daily decline and a new 2018 low in terms of closing prices. This gives the mentioned analogies a specific twist.
Let’s jump right into the mining stock charts (chart courtesy of http://stockcharts.com).
Weakening Analogy in Miners
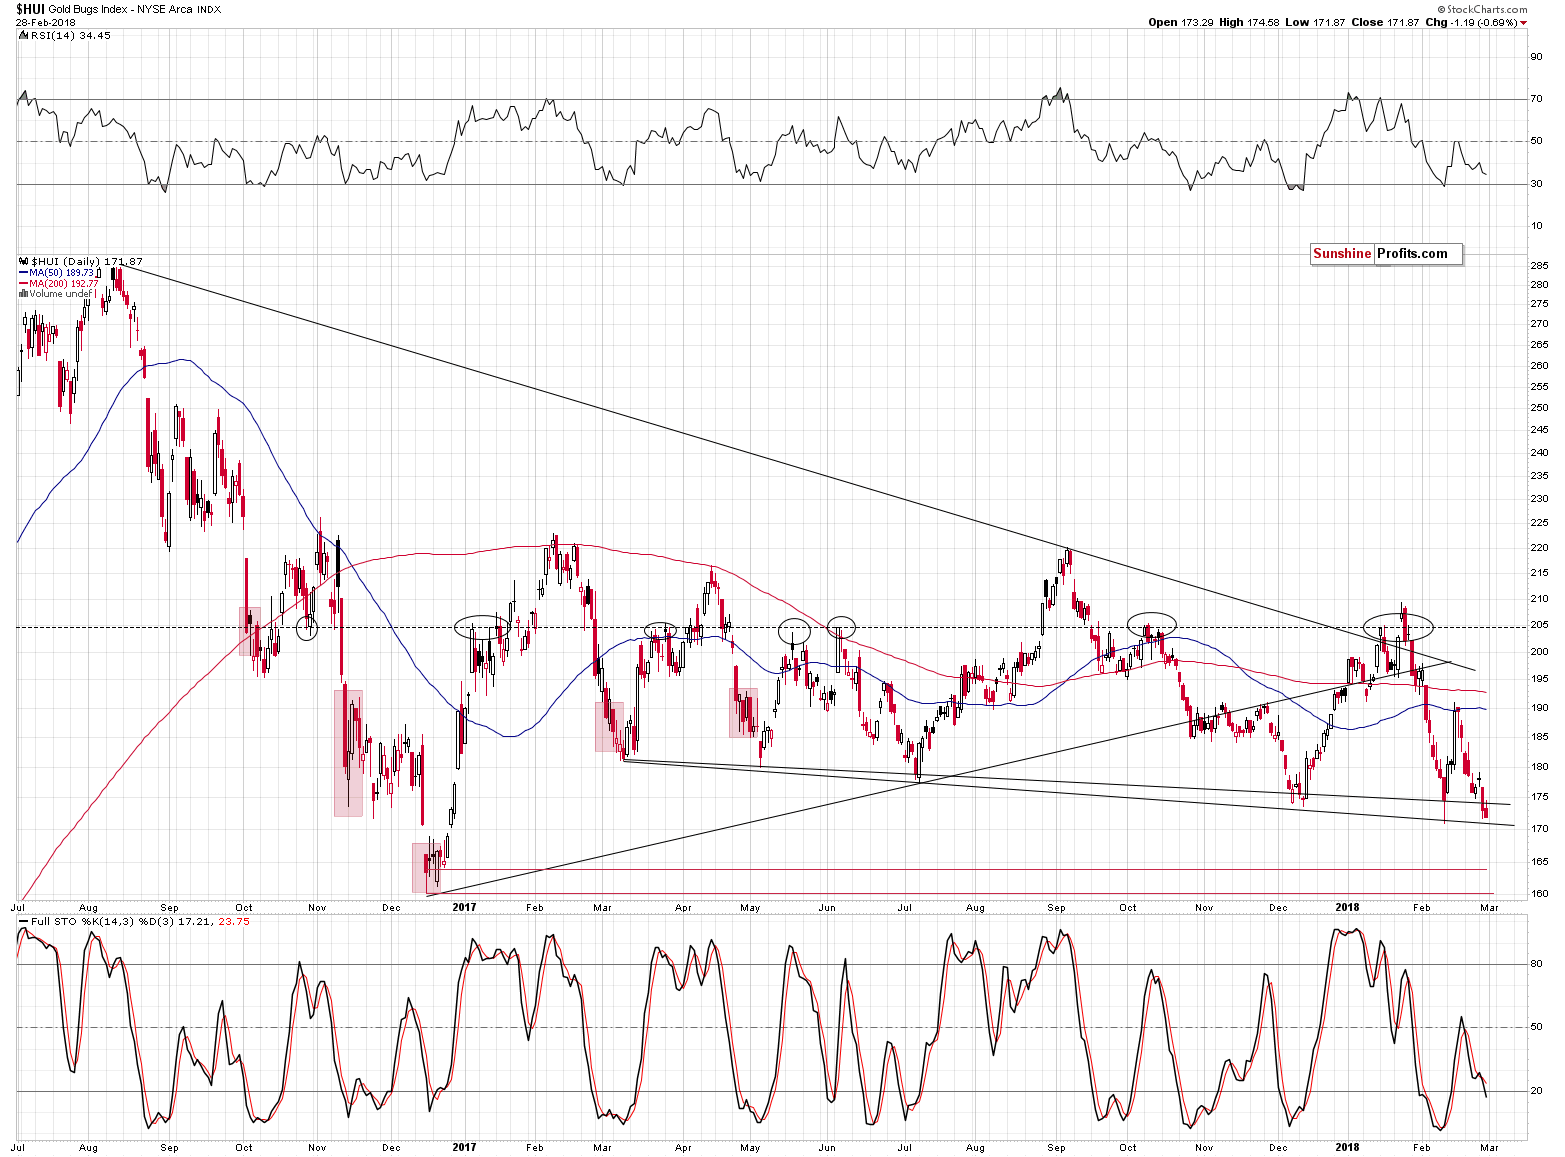
The HUI Index once again closed below both 2017 and 2018 lows. The interpretations of many developments in the market are vague and subjective. But not major breakdowns. And definitely not the confirmations of the latter. We traditionally wait for three consecutive closes below a certain level to view the breakdown as confirmed, but there’s a good reason why we already think that yesterday’s new lows are significant.
It’s because in the past cases, when miners bounced for the second time before rallying, they mostly bounced from the price levels that were considerably above the previous lows. There was only one exception (November 2016) and that was also the case in which the following upswing was the smallest out of analyzed cases. Back then only a bit more than half of the preceding short-term decline was erased before the big decline continued.
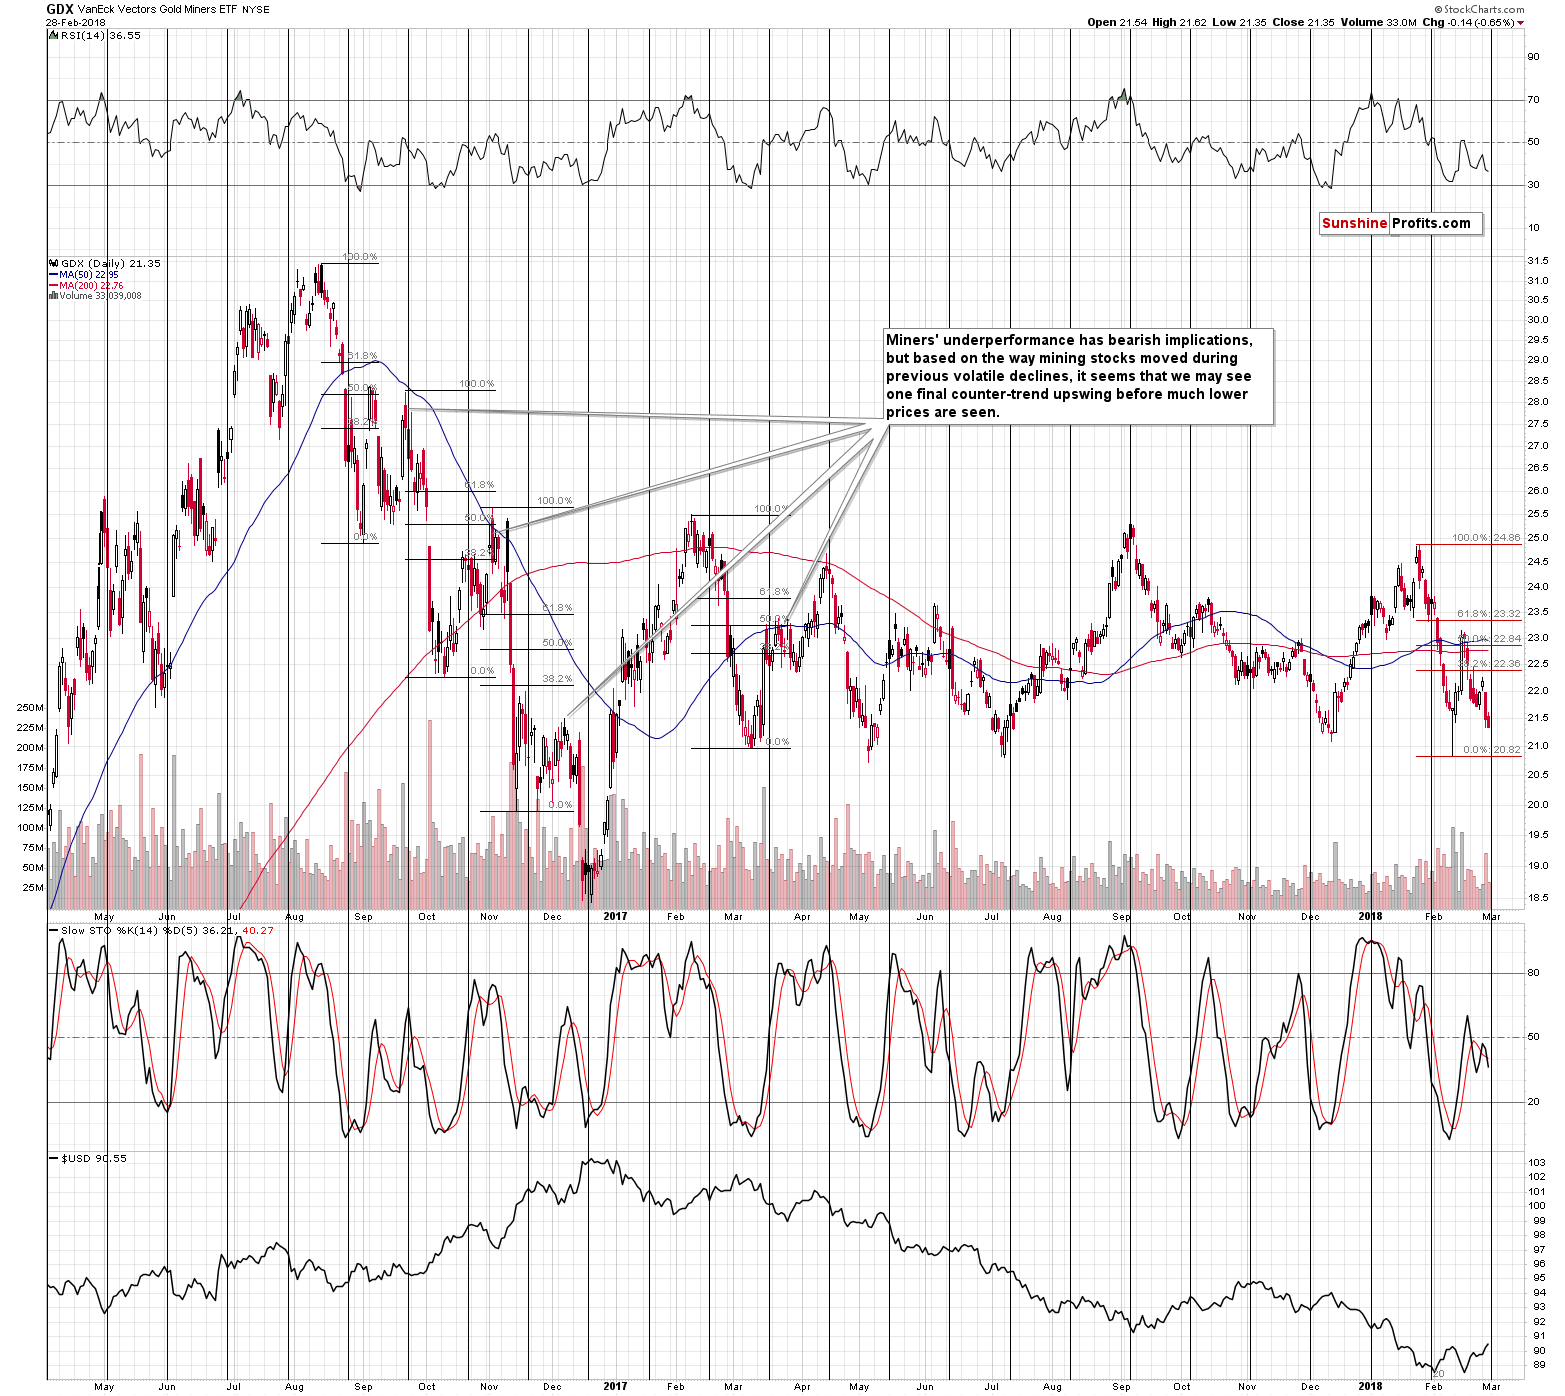
If this 1-out-of-4 analogy prevails, we may be looking at a counter-trend rally that takes GDX to 22.5 or so. If, however, the 2-out-of-4 analogy prevails (we’re leaving out the March 2017 action as there was no 2-day breakdown below the initial low), we can see a sharp decline right away.
The strength of the somewhat bullish implications of the above chart that were present before yesterday’s session is definitely smaller based on yesterday’s decline.
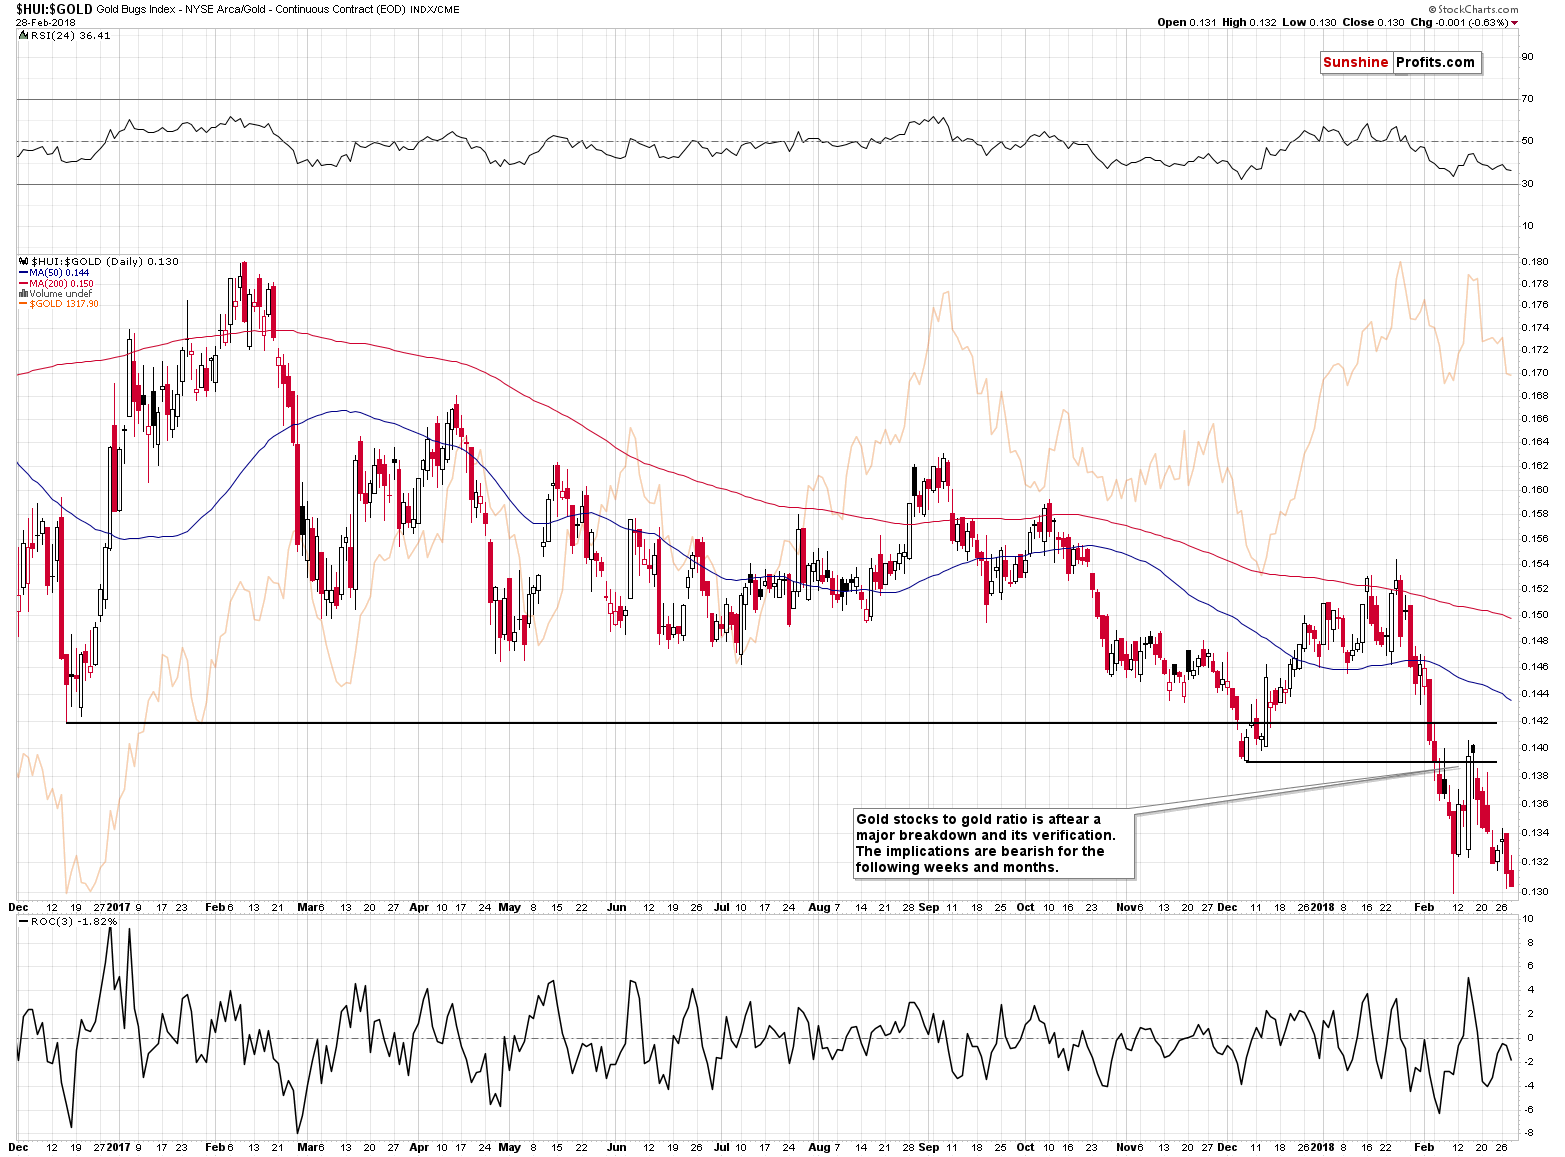
Also, please note that the HUI to gold ratio moved lower once again in terms of the closing prices, which further confirms the bearish implications of the previous breakdown below the 2017 and 2016 lows.
Golden Scenarios
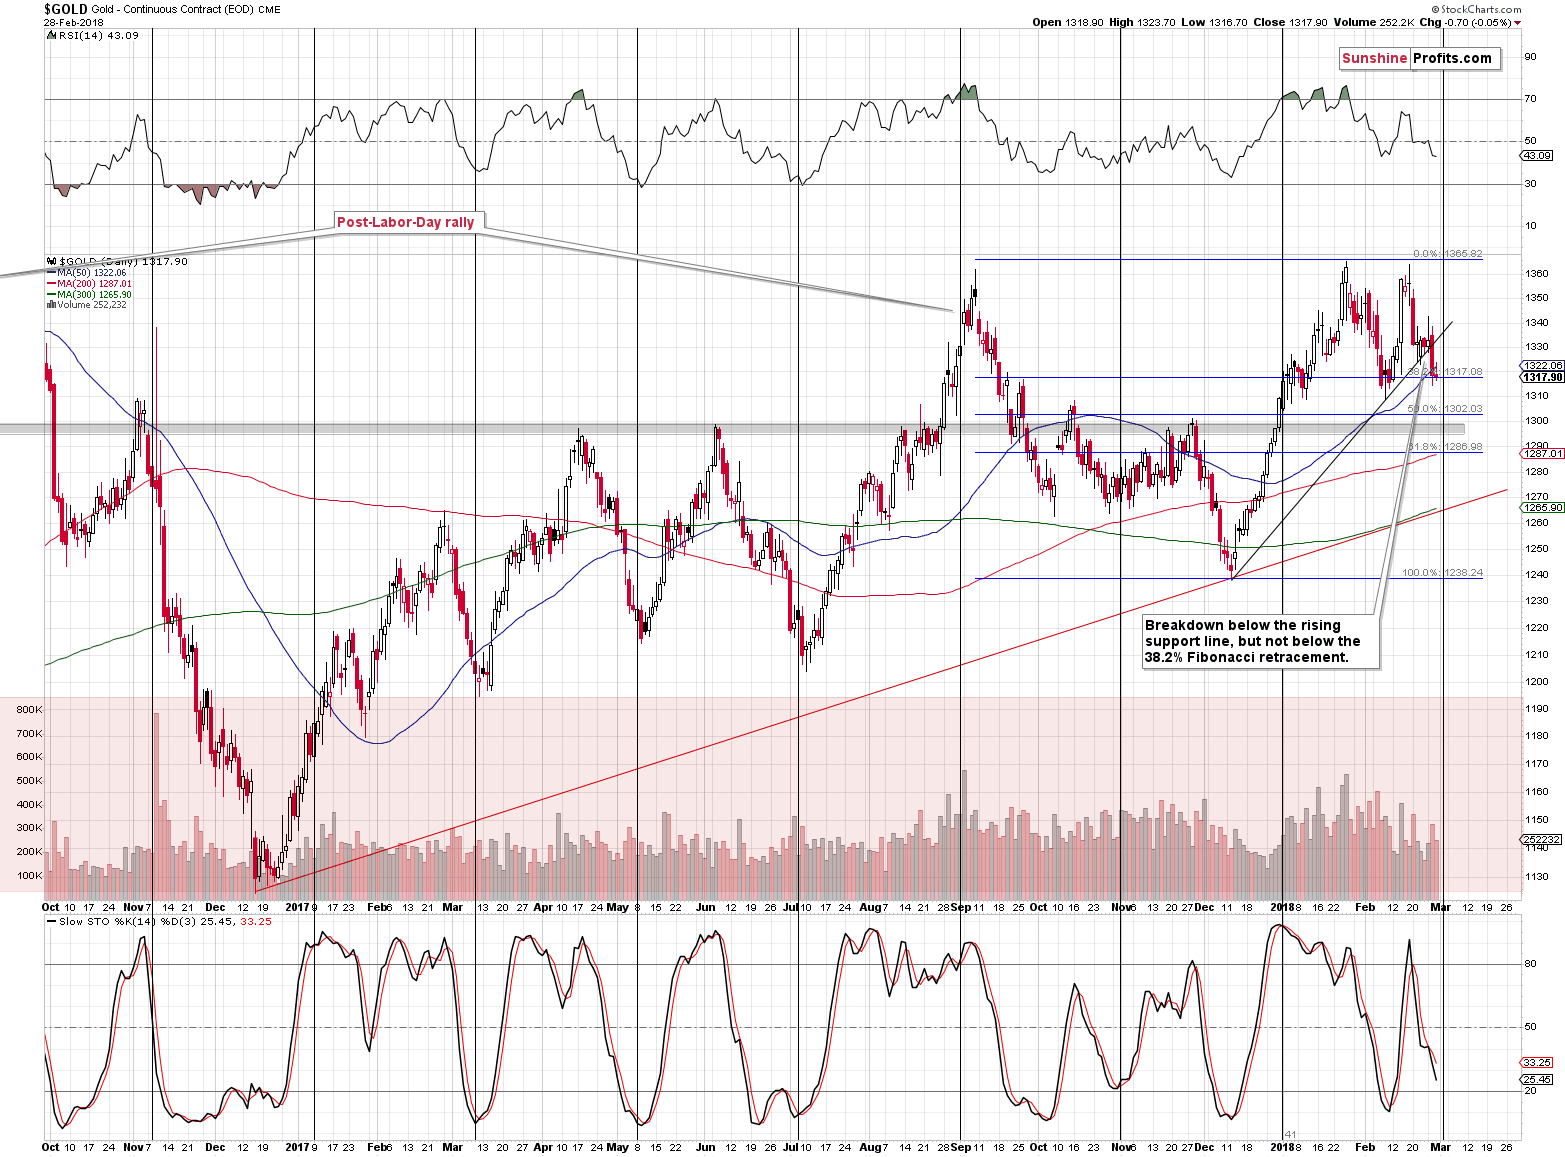
The situation in gold deteriorated insignificantly based on yesterday’s tiny decline. It’s not the decline that mattered, but the fact that gold stayed below the rising support / resistance line for another day and the breakdown is now almost confirmed.
The question that you may have at this time is: “What are the implications of gold’s cyclical turning point?”, as the most recent medium-term move was up and the most recent short-term move was down.
There is no easy answer, especially that gold is between the rising support line and the 38.2% Fibonacci retracement that adds to the short-term uncertainty.
One possibility going forward is for gold to slide today and tomorrow in a volatile manner and reverse from one of the support levels, for instance from the 61.8% Fibonacci retracement at $1,287 or from the psychologically important $1,300 level. Then it rallies for a week or so (perhaps correcting to the current levels or even the $1,330 - $1,340 range, while silver outperforms) and tops in tune with the triangle apex reversal pattern that we discussed thoroughly on Monday.
Another possibility is that gold invalidates the breakdown and rallies right away and then tops at about $1,340 - $1,350 in a week or so (again, based on the triangle apex reversal).
Of course, there’s a possibility that the Monday reversal was the early way in which the current turning point already worked and we should be expecting a week of volatile declines right away, followed by a pause or a corrective upswing from $1,287 or $1,268 at the triangle apex reversal.
Overall, the very short term is rather unclear, but with so many long-term factors in play, it doesn’t seem that it should concern us, as however the situation will play out, a bigger decline is still likely to follow.
So, instead of guessing, which is the most likely scenario, we’ll wait for signs and confirmations and we may adjust our position based on them. If we see a buying opportunity, we may limit, exit or even reverse the short position and if we see a meaningful sell confirmation, we may add to the current position.
Deterioration in Outlook for Silver
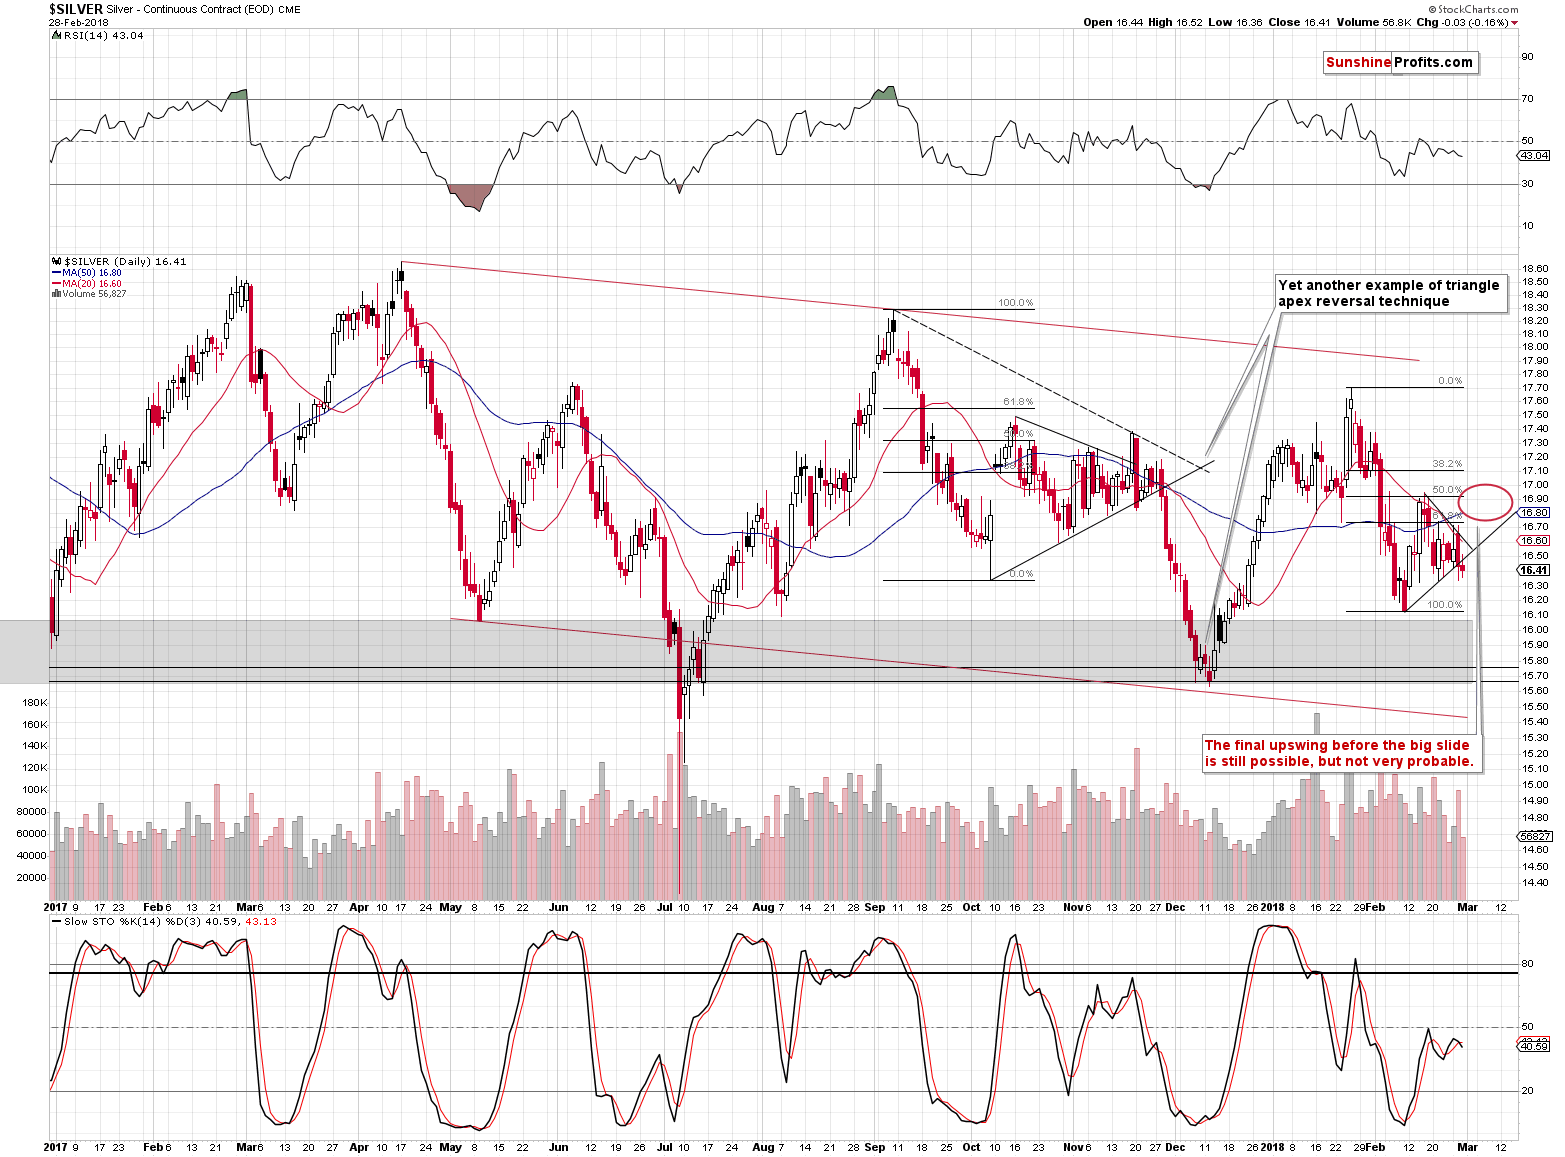
Meanwhile, the silver picture deteriorated more visibly as the white metal declined and closed below the rising short-term support line.
In light of the analogy to the previous post-decline consolidation, the implications are bearish as the breakdown below the rising support line is what happened already after the big and final counter-trend upswing.
It happened twice. In the first case (November 20, 2017) only a small upswing followed. In the second case (right before the end of the month), silver started a huge decline.
The implications are not clearly bearish for the immediate term, but the outlook definitely deteriorated.
USD on the Rise
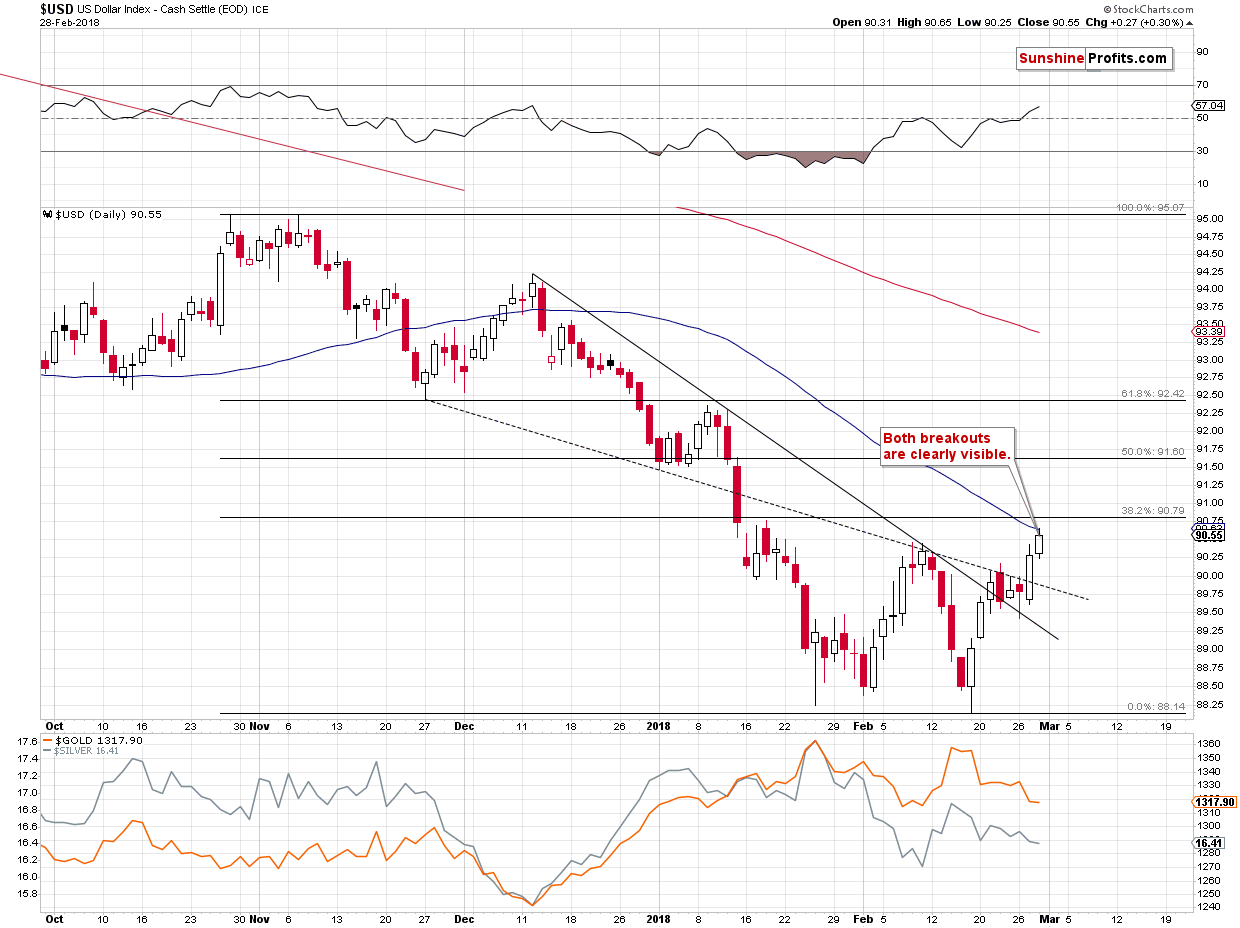
In yesterday’s alert, we commented on the USD Index’s short-term picture in the following way:
From the short-term point of view, it’s clear that the USD Index has broken above both declining short-term resistance lines. It hasn’t broken above the previous February high, but the implications of breakouts above the declining lines are already significantly bullish as they were two of the things that stopped the rally about 3 weeks ago.
Based on yesterday’s rally, the USD Index broke above the previous February highs. The implications are bearish as it shows that this attempt to move higher is stronger than the early-February one.
The 38.2% Fibonacci retracement is just around the corner, so if the USD pauses for a while, it will not be surprising.
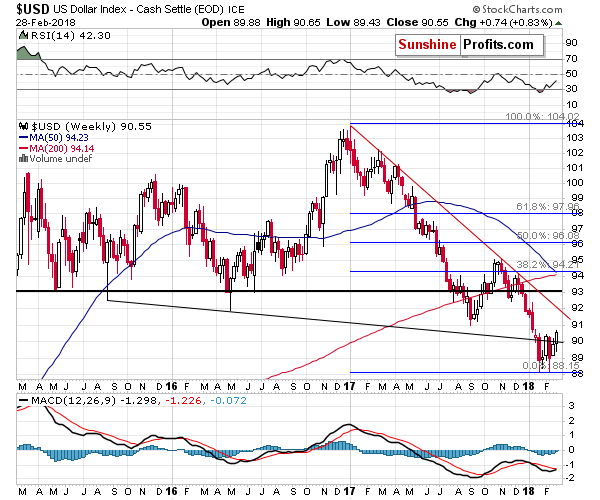
Still, with each passing day, a move back above the declining medium-term resistance line becomes more believable. This and next week’s close will verify it, but since we already see the USD above the price levels that previously triggered a reversal, the outlook has already improved.
Summary
Summing up, the top in gold, silver and mining stocks is probably in, but there’s still a possibility that the PMs’ decline will be delayed by a few days or a week and a few days. The scenario in which PMs decline right away became more probable based on yesterday’s price action, but it still not a certainty. Mining stocks and – in particular – silver will be the assets to look at for necessary confirmations before making adjustments to the current trading position. In both cases, however, the outlook for the following months will remain bearish.
As always, we will keep you – our subscribers – informed.
To summarize:
Trading capital (supplementary part of the portfolio; our opinion): Full short positions (150% of the full position) in gold, silver and mining stocks are justified from the risk/reward perspective with the following stop-loss orders and initial target price levels:
- Gold: initial target price: $1,218; stop-loss: $1,382; initial target price for the DGLD ETN: $53.98; stop-loss for the DGLD ETN $37.68
- Silver: initial target price: $14.63; stop-loss: $17.82; initial target price for the DSLV ETN: $33.88; stop-loss for the DSLV ETN $20.88
- Mining stocks (price levels for the GDX ETF): initial target price: $19.22; stop-loss: $26.14; initial target price for the DUST ETF: $39.88; stop-loss for the DUST ETF $15.78
In case one wants to bet on junior mining stocks' prices (we do not suggest doing so – we think senior mining stocks are more predictable in the case of short-term trades – if one wants to do it anyway, we provide the details), here are the stop-loss details and initial target prices:
- GDXJ ETF: initial target price: $27.82; stop-loss: $38.22
- JDST ETF: initial target price: $94.88 stop-loss: $37.78
Long-term capital (core part of the portfolio; our opinion): No positions (in other words: cash)
Insurance capital (core part of the portfolio; our opinion): Full position
Important Details for New Subscribers
Whether you already subscribed or not, we encourage you to find out how to make the most of our alerts and read our replies to the most common alert-and-gold-trading-related-questions.
Please note that the in the trading section we describe the situation for the day that the alert is posted. In other words, it we are writing about a speculative position, it means that it is up-to-date on the day it was posted. We are also featuring the initial target prices, so that you can decide whether keeping a position on a given day is something that is in tune with your approach (some moves are too small for medium-term traders and some might appear too big for day-traders).
Plus, you might want to read why our stop-loss orders are usually relatively far from the current price.
Please note that a full position doesn’t mean using all of the capital for a given trade. You will find details on our thoughts on gold portfolio structuring in the Key Insights section on our website.
As a reminder – “initial target price” means exactly that – an “initial” one, it’s not a price level at which we suggest closing positions. If this becomes the case (like it did in the previous trade) we will refer to these levels as levels of exit orders (exactly as we’ve done previously). Stop-loss levels, however, are naturally not “initial”, but something that, in our opinion, might be entered as an order.
Since it is impossible to synchronize target prices and stop-loss levels for all the ETFs and ETNs with the main markets that we provide these levels for (gold, silver and mining stocks – the GDX ETF), the stop-loss levels and target prices for other ETNs and ETF (among other: UGLD, DGLD, USLV, DSLV, NUGT, DUST, JNUG, JDST) are provided as supplementary, and not as “final”. This means that if a stop-loss or a target level is reached for any of the “additional instruments” (DGLD for instance), but not for the “main instrument” (gold in this case), we will view positions in both gold and DGLD as still open and the stop-loss for DGLD would have to be moved lower. On the other hand, if gold moves to a stop-loss level but DGLD doesn’t, then we will view both positions (in gold and DGLD) as closed. In other words, since it’s not possible to be 100% certain that each related instrument moves to a given level when the underlying instrument does, we can’t provide levels that would be binding. The levels that we do provide are our best estimate of the levels that will correspond to the levels in the underlying assets, but it will be the underlying assets that one will need to focus on regarding the signs pointing to closing a given position or keeping it open. We might adjust the levels in the “additional instruments” without adjusting the levels in the “main instruments”, which will simply mean that we have improved our estimation of these levels, not that we changed our outlook on the markets. We are already working on a tool that would update these levels on a daily basis for the most popular ETFs, ETNs and individual mining stocks.
Our preferred ways to invest in and to trade gold along with the reasoning can be found in the how to buy gold section. Additionally, our preferred ETFs and ETNs can be found in our Gold & Silver ETF Ranking.
As a reminder, Gold & Silver Trading Alerts are posted before or on each trading day (we usually post them before the opening bell, but we don't promise doing that each day). If there's anything urgent, we will send you an additional small alert before posting the main one.
=====
Latest Free Trading Alerts:
Yesterday's trading session brought the main U.S. stock market indexes 0.8-1.5% down, as investors' sentiment worsened following Tuesday's downward reversal. Stocks broke above their short-term consolidation on Monday, but they failed to continue higher. Consequently, they fell into their last week's consolidation and the S&P 500 index got closer to 2,700 mark again. Stocks are expected to open lower today, but they may retrace some of their two-day-long sell-off. Where is a potential support level?
Dark Cloud Covers Blue Chip Stocks
=====
Hand-picked precious-metals-related links:
PRECIOUS-Gold slips to three-week low on U.S. rate expectations
February U.S. Mint American Eagle gold, silver coin sales fall
Perth Mint's gold, silver sales fall for first time in three months in Feb
The world's top 10 largest gold mining companies – 2017
=====
In other news:
IMF chief sees growth, overheating, debt risks from U.S. tax cuts
Tudor Jones Stands With Dalio, Gross in Calling Bond Bear Market
Trump Expected to Announce Stiff Steel, Aluminum Tariffs
Putin Shows Off New Nuclear Weapons, Warns West to ‘Listen’
The SEC Is Targeting ICOs in a New Cryptocurrency Crackdown
=====
Thank you.
Sincerely,
Przemyslaw Radomski, CFA
Founder, Editor-in-chief, Gold & Silver Fund Manager
Gold & Silver Trading Alerts
Forex Trading Alerts
Oil Investment Updates
Oil Trading Alerts

