

Briefly: In our opinion, full (150% of the regular full position) speculative short positions in gold, silver and mining stocks are justified from the risk/reward perspective at the moment of publishing this alert.
There are many times when investors get confused about the precious metals market and now seems to be one of those situations. There have been multiple signs in place, but based on yesterday’s session, one of the most important ones seems to have been reversed. Mining stocks finally showed strength and refused to close visibly lower, even though gold did. Is it an early heads up that the decline has just ended? The reply is not easy as it requires understanding the situation not only in mining stocks and in the underlying metals, but also in the surrounding markets.
Let’s start today’s analysis with the HUI Index chart (chart courtesy of http://stockcharts.com).
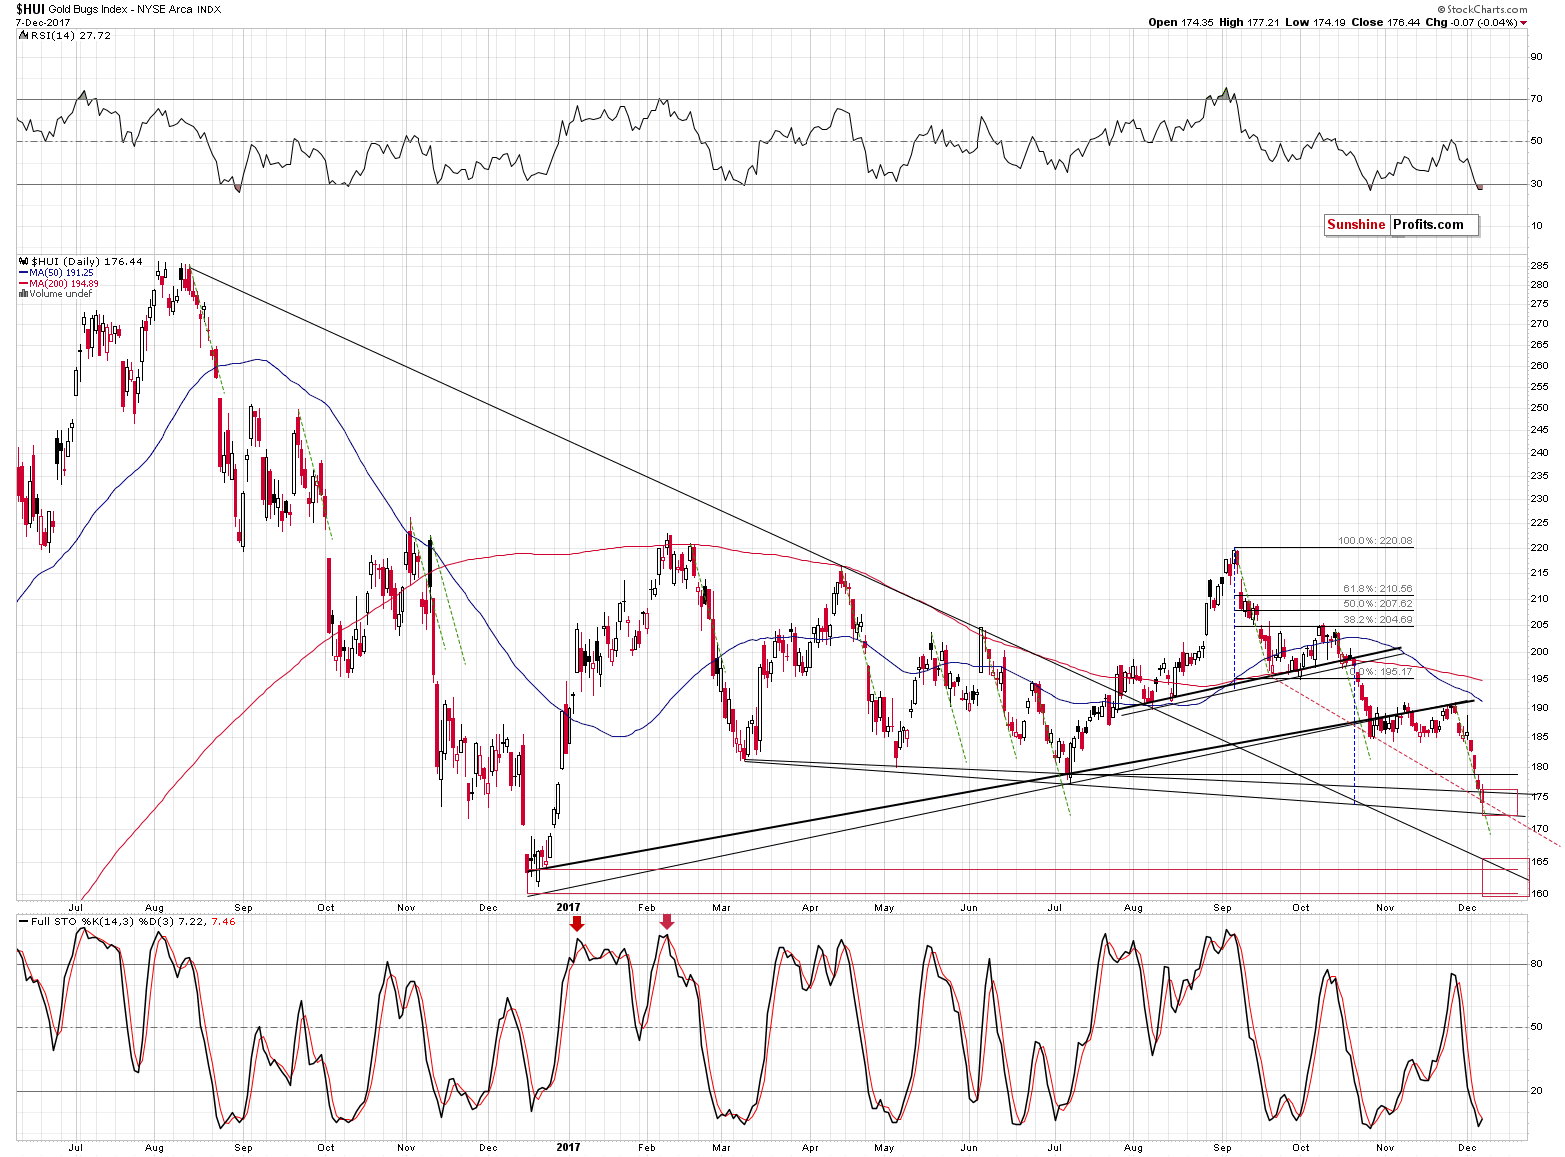
The HUI Index moved lower at first, but then erased almost the entire daily slide, before the session was over. However, the question is if this move was justified by some other factors or did it show strength against all odds and even triggered an important technical buy signal.
On the bullish side, mining stocks showed strength relative to gold and they formed a daily reversal.
The bearish front is still much bigger and it goes beyond the analysis of the above chart. Still, let’s consider the following:
- Gold miners are after a breakdown below the previous 2017 lows and yesterday’s session was the second day in a row when they closed below them. This makes the breakdown almost confirmed.
- Gold moved to the declining support line (red, dashed line), which made a temporary pause in the decline likely.
Both of the above are reasons due to which, the miners’ strength should not be viewed as fully bullish. As we indicated earlier, there’s more to the bearish case than just the above.
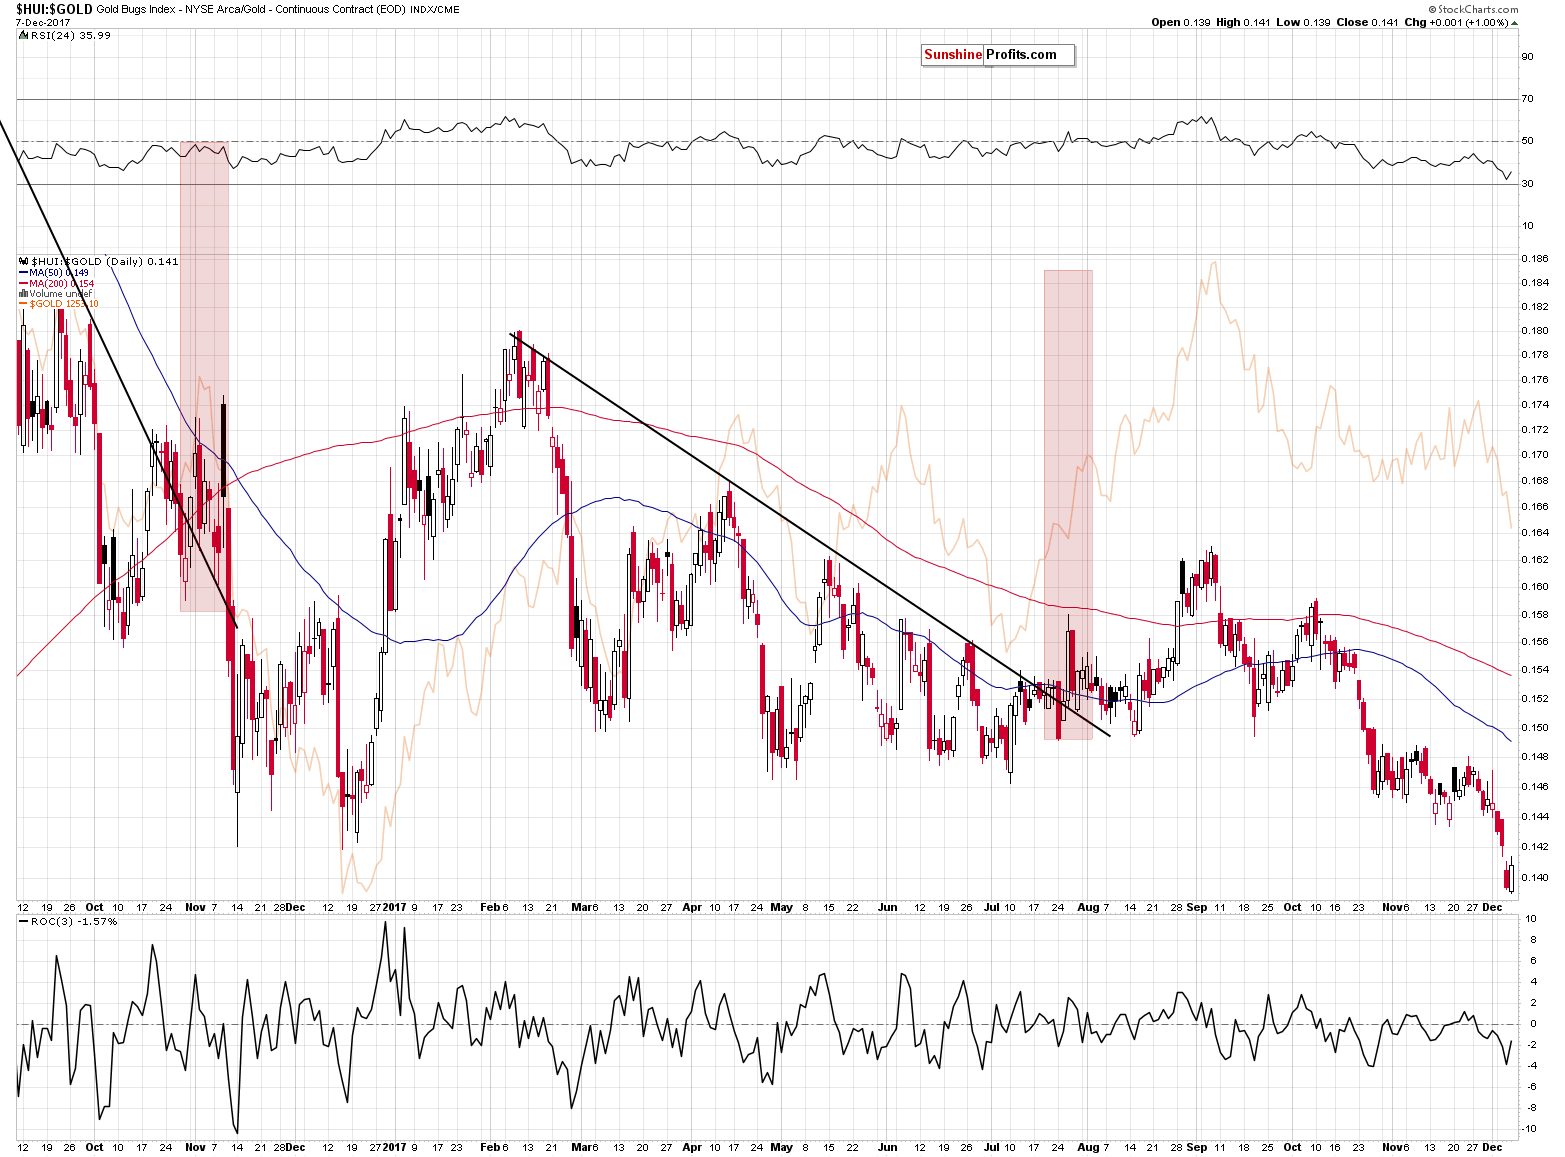
The strength relative to gold was just a one-day event and it was seen right after a breakdown, which we described yesterday. A breakdown which was not invalidated, so it’s still likely to be followed by more weakness. More weakness in the ratio means more underperformance of miners relative to gold and since gold is likely to move lower, then mining stocks are still likely to take a bigger dive.
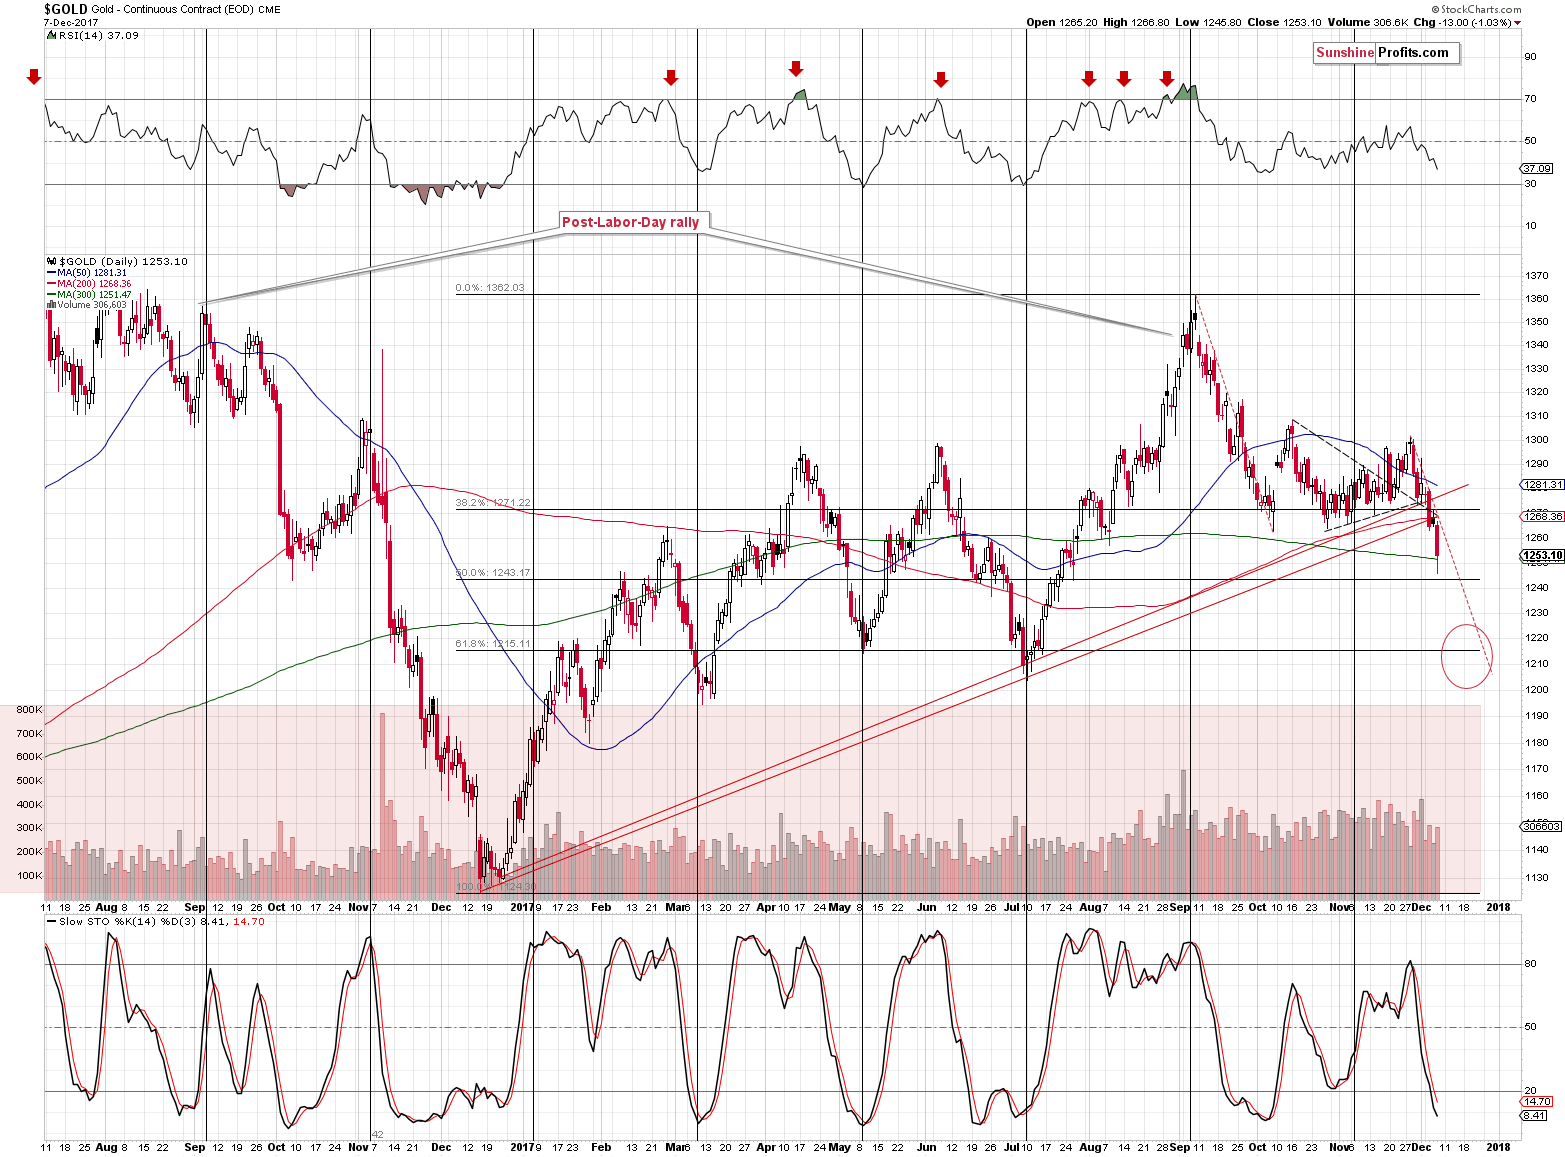
Gold moved to about $1,250 and the proximity of this level caused pauses several times this year, but it was never anything more than that – no major top or bottom formed very close to this level. The late February 2017 top could be viewed as exception, but it formed almost at $1,260 and since gold was about $15 below this level (temporarily, but still) yesterday, it doesn’t seem that the above is an important support anymore. Since gold didn’t use to bottom at the current levels, there’s little reason to think that it did so this time.
Gold almost reached the 50% Fibonacci retracement level yesterday, but this level is not strengthened by other important bottoms, so it’s not likely to trigger a major reversal. Slide to the 61.8% Fibonacci retracement or the March – May bottoms still appears more likely than an immediate rebound.
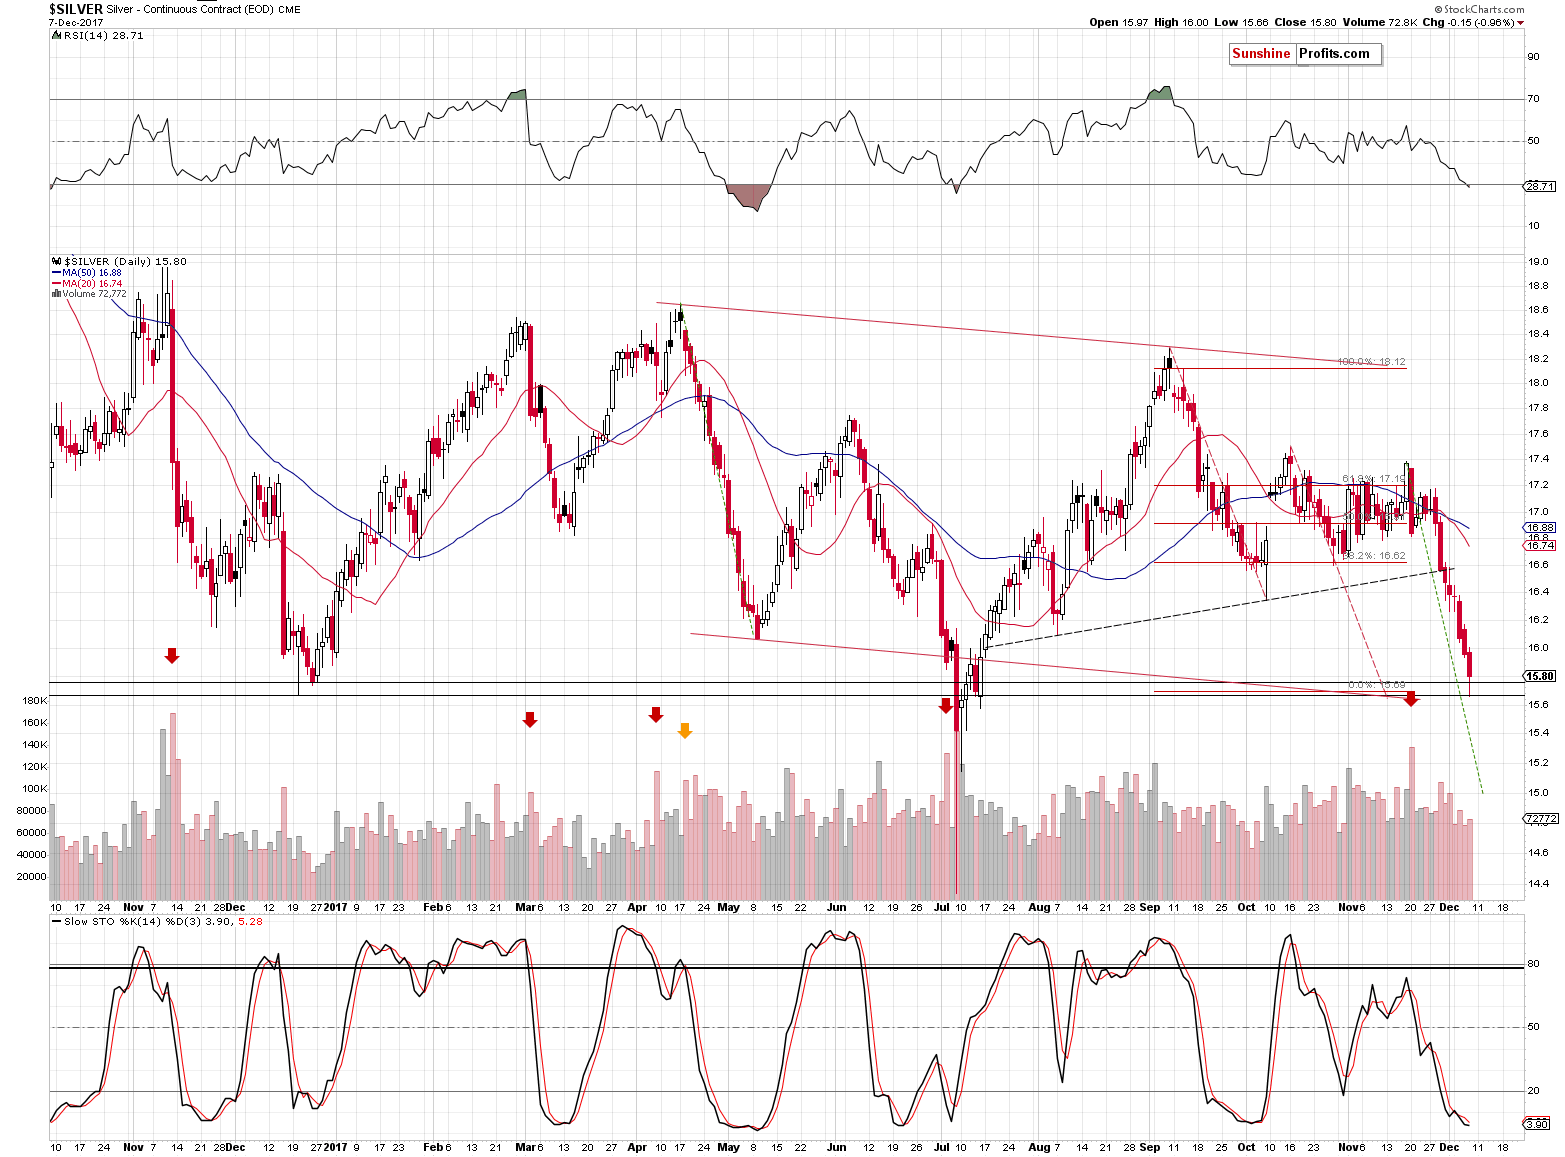
Silver, just like mining stocks, moved to our previous target area and last December’s low. In intraday terms, that’s the final stop before $14.40 becomes the next target based on the previous low.
So far, we’ve seen no breakdown. Will we see one shortly? Based on the action in gold and the USD Index, this seems quite likely.
By the way, the above chart shows why we discuss the volume levels so often. The spike in volume in mid-November indeed marked the start of a big downswing, just like was the case several times in the recent past. If one was looking at the price alone, the decline that followed the breakdown would have not appeared as significant as it had really been.
In the November 21 alert, we wrote the following:
Silver took the invalidation and its bearish implications one step further. Not only did silver invalidate Friday’s breakout, but the strength of the slide was so big that it moved to the lower border of the triangle.
Moreover, the volume that confirmed the slide was huge. There is only one directly comparable session in the most recent past (marked with an orange arrow) when an important invalidation took place on huge volume. This session started a sizable decline and if we saw a similar one today, silver would bottom a bit below $15.
Other huge-volume declines that we marked with red arrows also point to lower prices as they were generally followed by declines - often sizable.
As you recall from the previous two alerts, the up-to-date price target for silver is indeed below $15.
We mentioned the USD Index earlier today and we would like to discuss the situation in it in more detail.
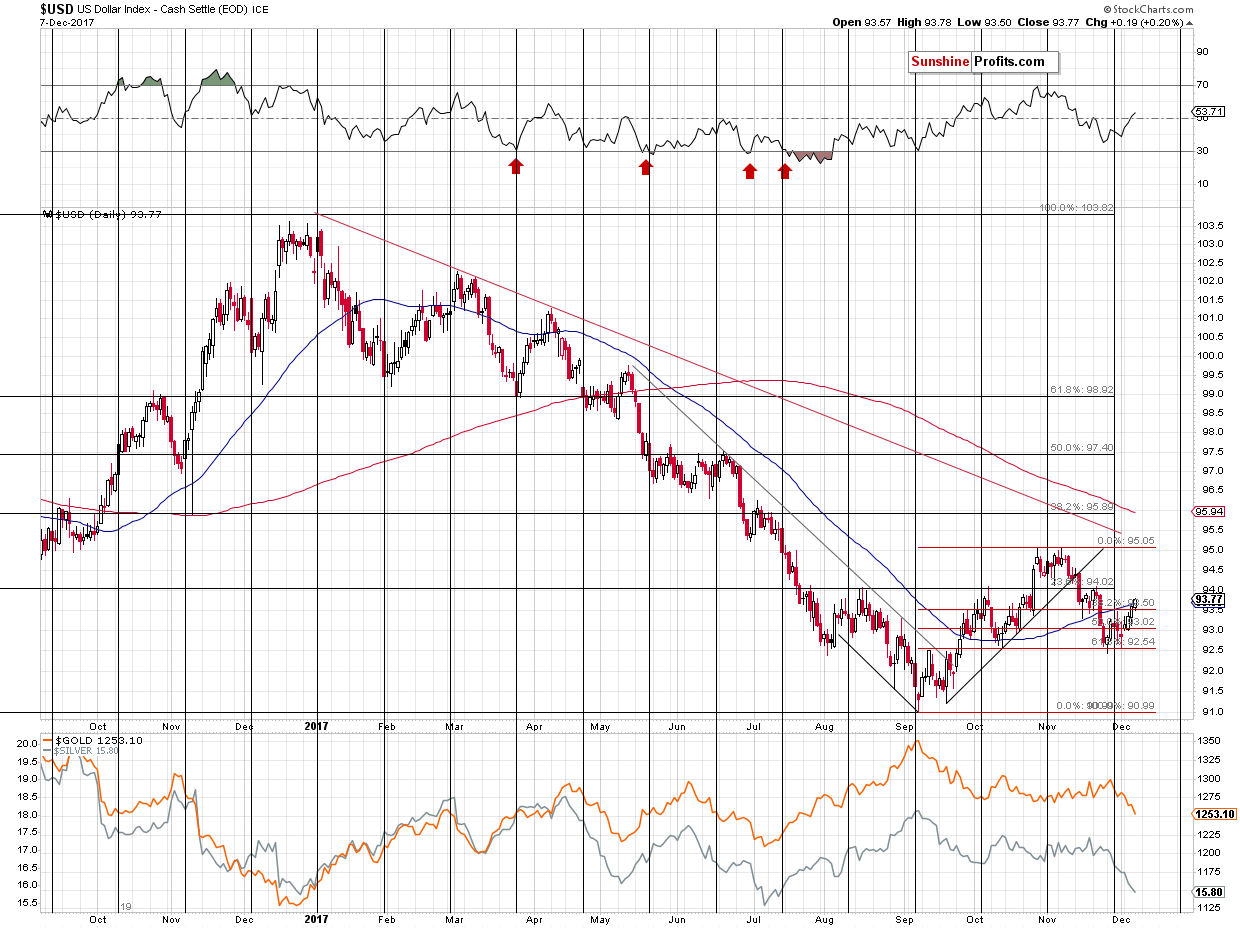
The USD Index moved a bit higher – the rally was not huge, but it was consequent. Sooner rather than later a lot of traders will expect the head and shoulders in the USD Index to form and such a formation would imply a top around the 94 level. However, it’s not likely to happen.
Why?
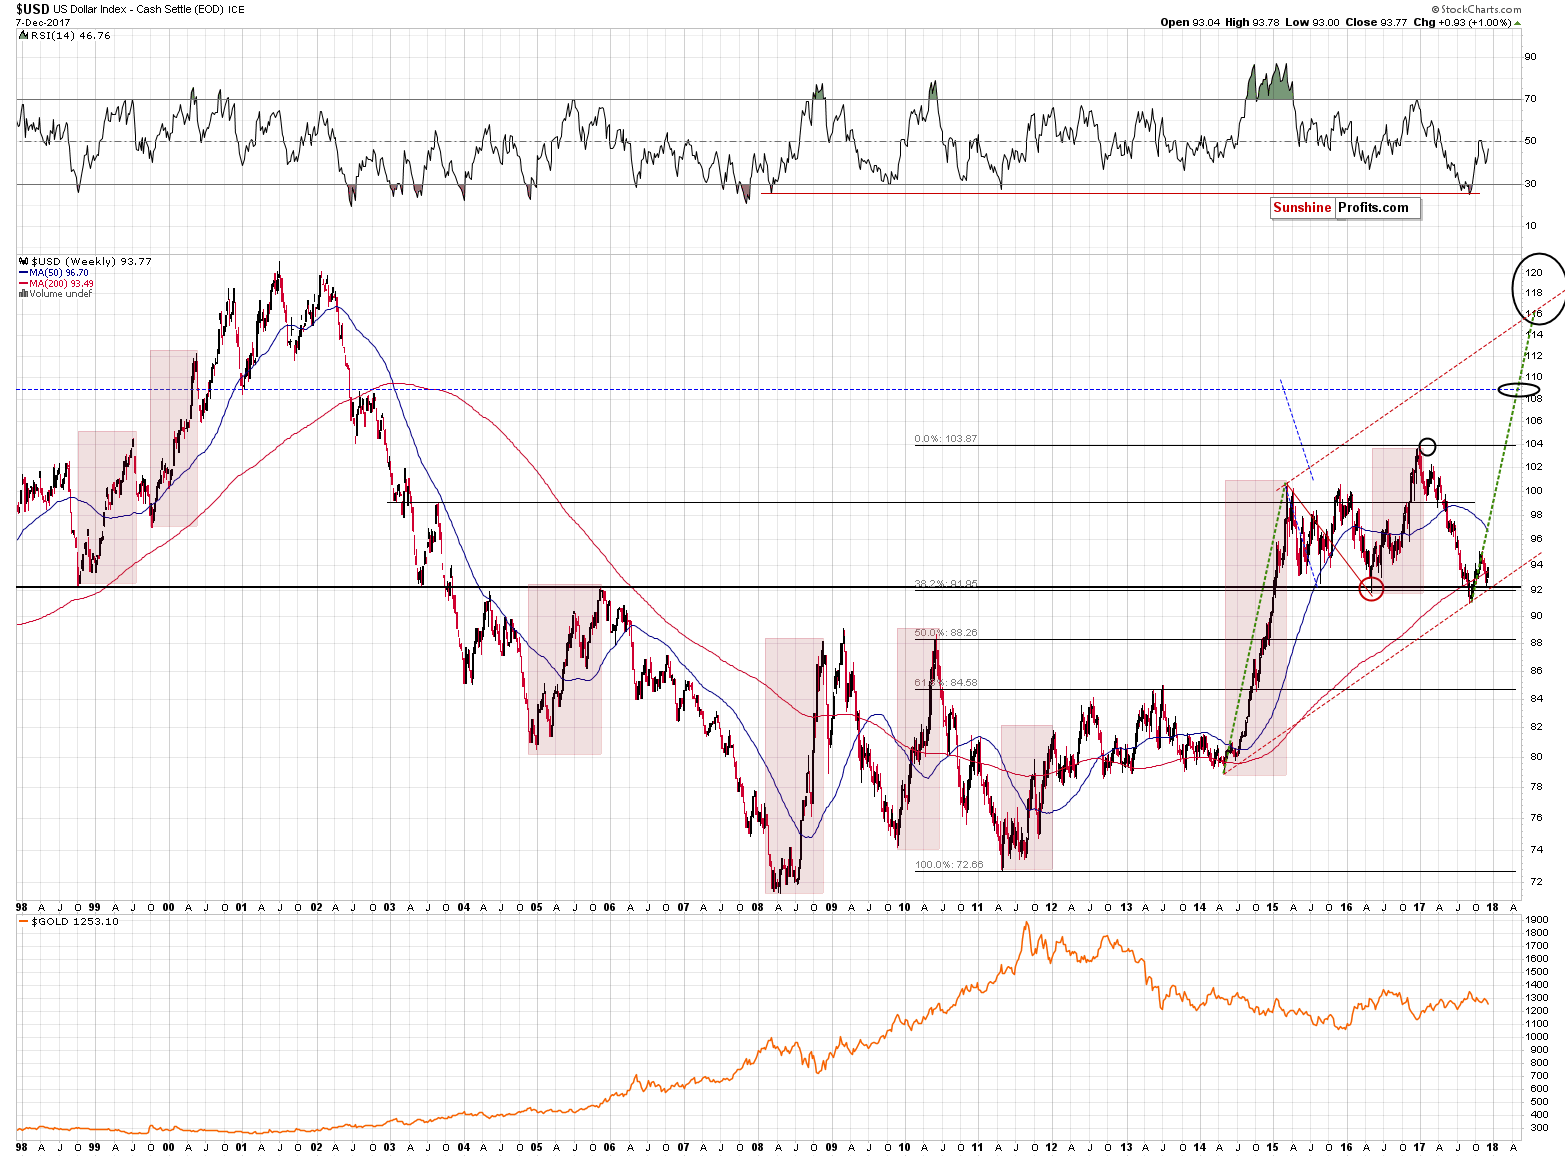
Because it doesn’t fit the previous major patterns. As we explained previously, the time for the corrective downswing in the USD Index is most likely up (especially that this week is ending today). That’s one thing, but the other thing is the shape of the previous corrective downswings and their follow-up action.
There was only one case when the USD Index moved back down once again after the first corrective downswing was over – in mid-2011 and that’s when gold formed its final top. The situation seems to be much different now, not only in gold, but also in the case of the USD – the latter moved back and forth in a volatile manner in 2011 during the first part of the corrective downswing and it was definitely not the case in the past few weeks.
The recent correction in the USD was much more similar to the one seen in 1998, 2005 and in 2014. In 1998 and 2014 the USD Index rallied well above the previous local high before taking a breather. Applying this to the current situation, provides us with the 95-96 area as the lowest of likely targets.
If the current action is to be like the 2005 one (which might be the case especially because of the analogy in the interest rate hikes), then we could see a small pause once the USD moves to the previous high – 95 in this case.
Either way, it seems that the USD Index has further to rally before pausing in a more meaningful way.
Connecting the dots, the USD Index is likely to rally further, which makes it likely for gold and silver to decline. If they don’t, we’ll have a bullish sign and we’ll know that we want to exit the short positions. When gold and silver decline, mining stocks are still likely to underperform based on the breakdown in the HUI Index to gold ratio. If the miners refuse to decline and the breakdown in the ratio becomes invalidated, we’ll know that a corrective upswing is just around the corner.
For now, the outlook remains down and the good news is that we know what to look for as signs of strength. What we’ve seen so far doesn’t seem to really indicate it.
As always, we will keep you – our subscribers – informed.
To summarize:
Trading capital (supplementary part of the portfolio; our opinion): Short positions (150% of the full position) in gold, silver and mining stocks are justified from the risk/reward perspective with the following stop-loss orders and exit price levels / profit-take orders:
- Gold: exit price: $1,218; stop-loss: $1,366; exit price for the DGLD ETN: $51.98; stop-loss for the DGLD ETN $38.74
- Silver: exit price: $14.63; stop-loss: $19.22; exit price for the DSLV ETN: $33.88; stop-loss for the DSLV ETN $17.93
- Mining stocks (price levels for the GDX ETF): exit price: $19.22; stop-loss: $26.34; exit price for the DUST ETF: $39.88; stop-loss for the DUST ETF $21.37
In case one wants to bet on junior mining stocks' prices (we do not suggest doing so – we think senior mining stocks are more predictable in the case of short-term trades – if one wants to do it anyway, we provide the details), here are the stop-loss details and exit prices:
- GDXJ ETF: exit price: $27.82; stop-loss: $45.31
- JDST ETF: exit price: $94.88 stop-loss: $43.12
Long-term capital (core part of the portfolio; our opinion): No positions (in other words: cash)
Insurance capital (core part of the portfolio; our opinion): Full position
Important Details for New Subscribers
Whether you already subscribed or not, we encourage you to find out how to make the most of our alerts and read our replies to the most common alert-and-gold-trading-related-questions.
Please note that the in the trading section we describe the situation for the day that the alert is posted. In other words, it we are writing about a speculative position, it means that it is up-to-date on the day it was posted. We are also featuring the initial target prices, so that you can decide whether keeping a position on a given day is something that is in tune with your approach (some moves are too small for medium-term traders and some might appear too big for day-traders).
Plus, you might want to read why our stop-loss orders are usually relatively far from the current price.
Please note that a full position doesn’t mean using all of the capital for a given trade. You will find details on our thoughts on gold portfolio structuring in the Key Insights section on our website.
As a reminder – “initial target price” means exactly that – an “initial” one, it’s not a price level at which we suggest closing positions. If this becomes the case (like it did in the previous trade) we will refer to these levels as levels of exit orders (exactly as we’ve done previously). Stop-loss levels, however, are naturally not “initial”, but something that, in our opinion, might be entered as an order.
Since it is impossible to synchronize target prices and stop-loss levels for all the ETFs and ETNs with the main markets that we provide these levels for (gold, silver and mining stocks – the GDX ETF), the stop-loss levels and target prices for other ETNs and ETF (among other: UGLD, DGLD, USLV, DSLV, NUGT, DUST, JNUG, JDST) are provided as supplementary, and not as “final”. This means that if a stop-loss or a target level is reached for any of the “additional instruments” (DGLD for instance), but not for the “main instrument” (gold in this case), we will view positions in both gold and DGLD as still open and the stop-loss for DGLD would have to be moved lower. On the other hand, if gold moves to a stop-loss level but DGLD doesn’t, then we will view both positions (in gold and DGLD) as closed. In other words, since it’s not possible to be 100% certain that each related instrument moves to a given level when the underlying instrument does, we can’t provide levels that would be binding. The levels that we do provide are our best estimate of the levels that will correspond to the levels in the underlying assets, but it will be the underlying assets that one will need to focus on regarding the signs pointing to closing a given position or keeping it open. We might adjust the levels in the “additional instruments” without adjusting the levels in the “main instruments”, which will simply mean that we have improved our estimation of these levels, not that we changed our outlook on the markets. We are already working on a tool that would update these levels on a daily basis for the most popular ETFs, ETNs and individual mining stocks.
Our preferred ways to invest in and to trade gold along with the reasoning can be found in the how to buy gold section. Additionally, our preferred ETFs and ETNs can be found in our Gold & Silver ETF Ranking.
As a reminder, Gold & Silver Trading Alerts are posted before or on each trading day (we usually post them before the opening bell, but we don't promise doing that each day). If there's anything urgent, we will send you an additional small alert before posting the main one.
=====
Latest Free Trading Alerts:
Yesterday, the price of Bitcoin surpassed $16,000. What does it mean for the gold market?
President Trump nominated Jerome Powell as the next chair of the Federal Reserve soon. We invite you to read our today’s article about the likely direction of the Fed under the new leader and find out what it all means for the gold market.
Jerome Powell vs. Janet Yellen
=====
Hand-picked precious-metals-related links:
PRECIOUS-Dollar rise pushes gold toward biggest weekly fall since May
Commerzbank - Outlook 2018: gold sets the tone
Newmont gold output growth: 'We've only just begun'
Platinum's discount to palladium hits 16-year-high
=====
In other news:
World stocks rise as Brexit deal adds to Asian cheer
Dollar Gains Again as Stocks Rebound; Bonds Fall: Markets Wrap
Wall Street banks hit pause button on Bitcoin
Bitcoin soared to over $19,000 on Coinbase — but other exchanges have totally different prices
The Bitcoin Whales: 1,000 People Who Own 40 Percent of the Market
Ron Paul: Stock Market Could Crater 50%
=====
Thank you.
Sincerely,
Przemyslaw Radomski, CFA
Founder, Editor-in-chief, Gold & Silver Fund Manager
Gold & Silver Trading Alerts
Forex Trading Alerts
Oil Investment Updates
Oil Trading Alerts

