

Briefly: in our opinion, full (250% of the regular position size) speculative short positions in mining stocks are justified from the risk/reward point of view at the moment of publishing this Alert. We are adjusting targets JDST due to its decrease in leverage to 2x.
The very bearish confirmations are everyone around us. Perhaps "very" is not strong enough to emphasize how extreme the situation is, if one knows where to look.
In yesterday's analysis, we emphasized that if we saw two daily rallies in the USD Index in a row, it would mean that the corrective downswing is already over. We actually expected to see a higher close yesterday, which would confirm the bullish outlook for the near term. We didn't. The USDX reversed and moved back down before the end of the day, closing 0.19 points lower. This should have been bullish for gold. The yellow metal should have rallied after a quick dip earlier in the day. And what did gold do instead?
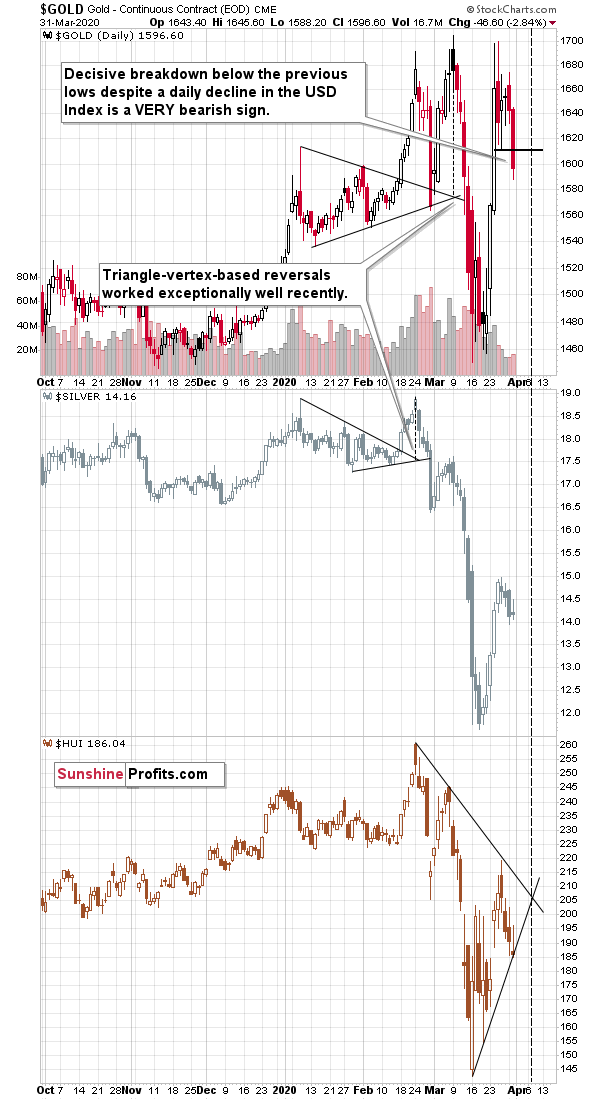
Gold declined by almost $50 and closed the day not only below its previous short-term lows, but also below the psychologically important $1,600 level. This is an extreme show of weakness, and indication that lower prices are to be expected.
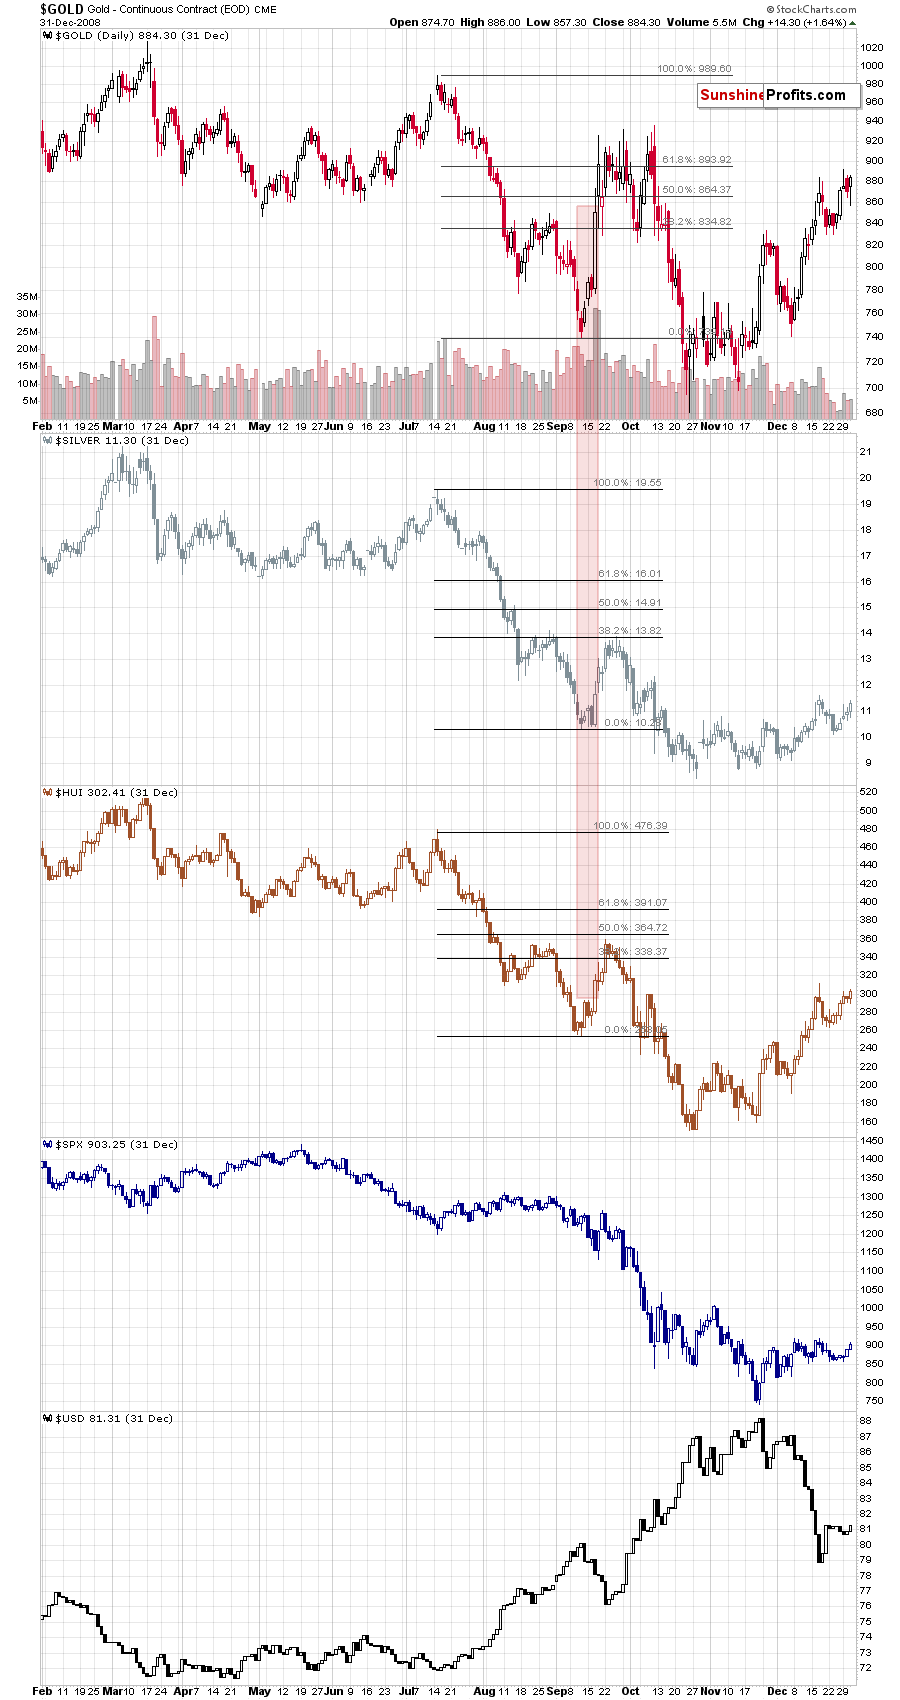
This is extremely important not only because of the breakdown and very strong relative weakness to the USD Index. This is extremely important, because that's almost exactly what we saw in 2008, during the similar stage of the decline.
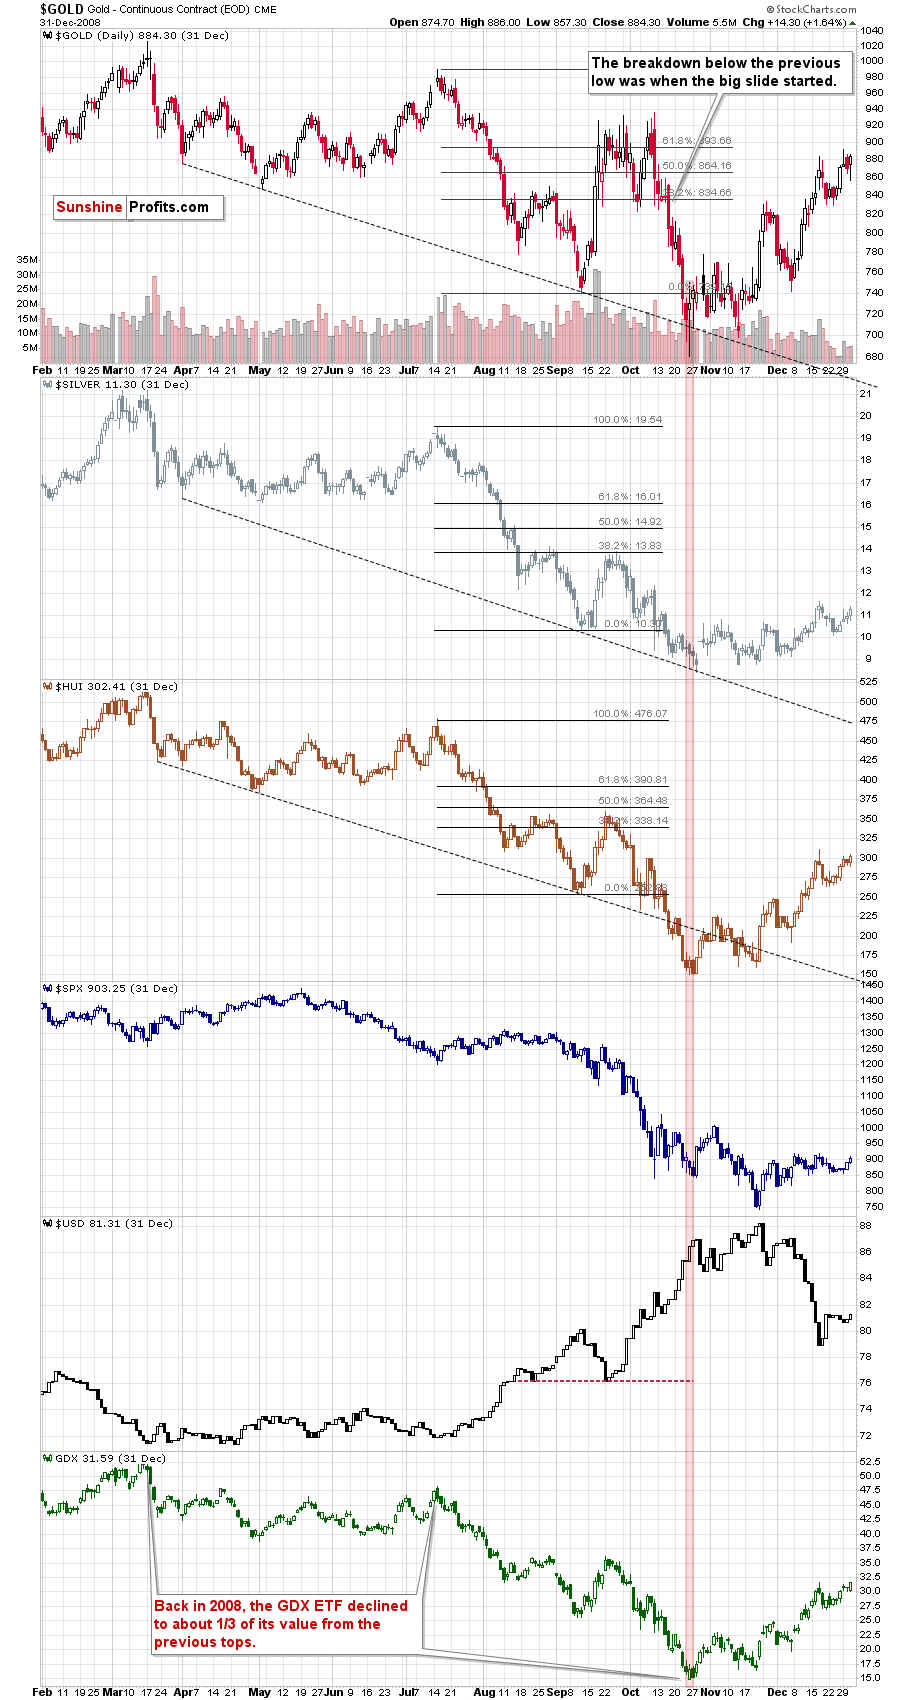
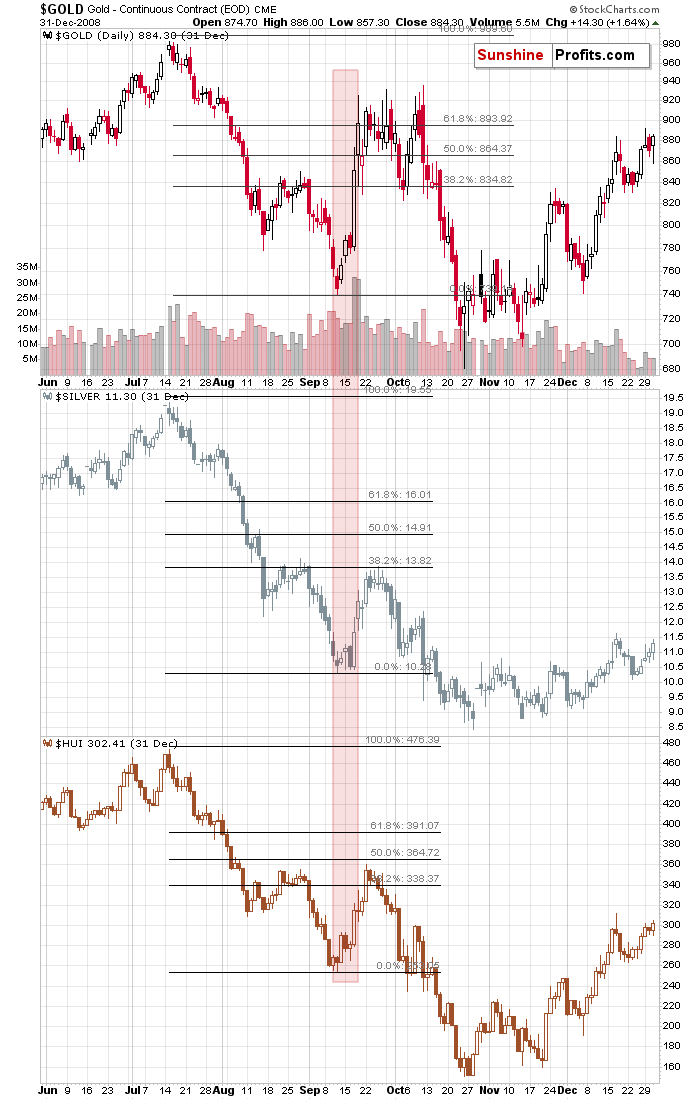
Breakdown below the previous lows (at about $830) in mid-October 2008 was what triggered the sharpest part of gold's decline. It was also what started the final move to gold's ultimate bottom.
That's why yesterday's breakdown is so important. Gold had a very good reason to rally. Or at least not to decline. And yet, it declined exactly as it did in 2008. That's a strong confirmation not only of the bearish outlook for the short term, but also a confirmation that the 2008 - 2020 link remains intact.
The 2008 and 2020 Comparisons
In our previous analysis, we wrote that we will be able to fine-tune our time analogy between 2008 and 2020 once gold completes its topping pattern. The odds are that this pattern was just completed. Consequently, we will proceed. But first, a quote from our Wednesday's analysis, when we originally featured this analogy:
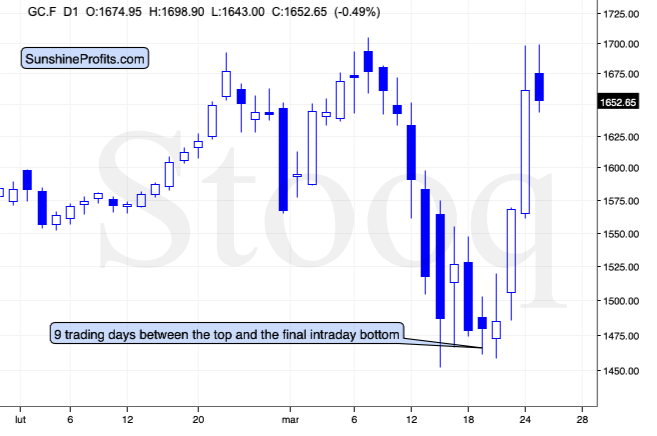
It took 9 trading days for gold to decline from its top to the final intraday bottom, before starting the powerful comeback.
In 2008, it took 41 days. It seems that things are developing about 4.5 times faster now, than they were developing in 2008. More precisely: 41/9 = 4.56 times.
Please note that the decline that preceded the sharp upswing in gold, is also somewhat similar to what we saw recently. There was an initial slide in gold that ended in mid-August 2008, then we saw a correction and then another slide and a bottom in early September. This year, we saw an initial bottom in mid-March, and the final one a few days ago.
Back in 2008, it took 23 trading days for gold to reach its initial bottom and it then took another 18 days for the final short-term bottom to form. 56.1% of the downswing was to the initial bottom, and the 43.9% of the downswing was between the initial and final bottom.
And now? It took 5 out of 9 trading days for gold to reach the initial bottom, and the remaining 4 days were the time between the bottoms. That's 55.6% and 44.4% respectively.
This is very important, because it shows that the shape of the move is indeed very similar now.
This means that we can most likely draw meaningful conclusions for the current situation based on how the situation developed back in 2008.
Back then, gold moved back and forth close to the initial top. That's what gold has been doing so far today - which serves as another confirmation for the analogy.
Back in 2008, gold topped over the period of 16 trading days. Dividing this by 4.56 provides us with 3.5 days as the target for the end of the topping pattern since its start. The pattern started yesterday, which suggests that gold could top tomorrow or on Friday.
The situation gets more interesting as we dig in more thoroughly...
There are 24 hours in a day. Dividing this by the factor of 4.56 provides us with 5.26. This means that if we could create a chart with 5.26 hour candlesticks, the price moves in gold should be analogous (in terms of how we see them on the chart) to their daily performance from 2008. The closest that we have available are the 4-hour candlesticks.
Let's check how gold performed recently from this perspective, and compare it to its daily performance from 2008.
The price moves are remarkably similar.
Even the March 17, 2020 upswing took gold to analogous price level! Gold temporarily topped very close to the previous (Feb 28) low. That's in perfect analogy to how high gold corrected in late August 2008 - it moved up to the early May 2008 high.
Let's see what kind of time ratio we get if we apply the same methodology to other characteristic events.
It took 7 trading days for gold to decline from its final intraday bottom (of the recent big decline) to the day when it broke below the consolidation pattern (yesterday).
In 2008, it took 25 days. Based on these numbers, it seems that things are developing about 3.5 times faster now, than they were developing in 2008. More precisely: 25/7 = 3.57 times.
On average, it seems that things are now developing about 4x faster than they developed back in 2008. The adjustment was not huge, but still, it's better to have a more accurate number than a less accurate one.
Back in 2008, the intraday bottom was formed on the 6th day after the breakdown. Dividing it by 4, provides us with only about 1.5 days left until the final bottom. This might be too fast to be realistic, but then again, silver dropped in an "unrealistic way" very recently as well.
There's also another way to look at all this. The pace at which gold declines, could simply be 4 times greater than the one that we saw in 2008, but since the downside target is now more distant, it might be the case that it will take a few more days than the above analogy would suggest.
Taking the first intraday high into account, back in 2008, gold declined about 26.5% over 26 trading days. That's about 1% per day.
If gold declined 4% per day and its target was $1,170, then it would take gold about 9 days to reach this level starting from $1,698 (the first intraday high that we saw recently). 6 days have already passed, which would provide us with a good chance of seeing a major bottom in gold in 3 trading days. That would be Monday.
This time target is very close to Tuesday April 7th, which we already described as a quite likely reversal date based on the triangle-vertex-based reversal present in the HUI Index.
On Monday, we wrote that the final bottom in gold could be seen as early as within the next 2 weeks and it seems that this might really be the case. We will be looking for confirmations of the bottom once prices get significantly lower.
And speaking of prices getting significantly lower... There's something very interesting visible on the GDX ETF chart that we haven't discussed previously.
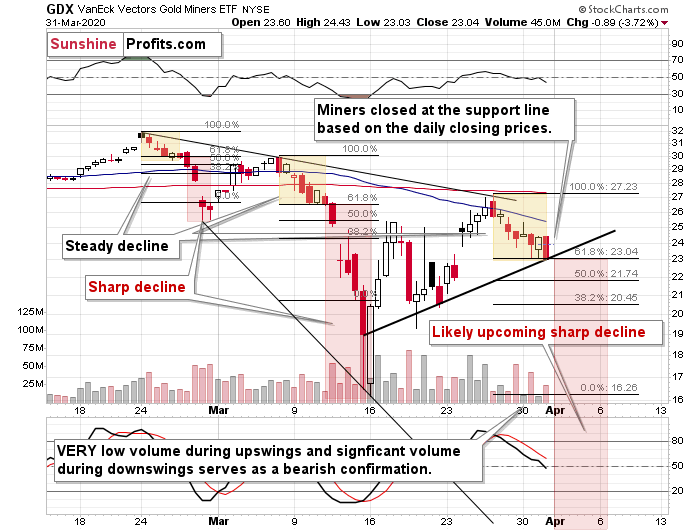
Let's start with something relatively uninteresting, but still important. You might be wondering why didn't the GDX ETF slide further yesterday, even though gold moved lower very visibly. The above chart provides two reasons for it.
The first reason is the rising support line that's based on the previous closing prices. That's where the GDX closed yesterday. This alone is a good reason for GDX not to decline more during yesterday's session. Of course, when gold declines again, miners are likely to break below this support line and decline much more visibly.
The second reason is that a relatively steady decline should have been expected right now. That's exactly how the two previous declines started. The important thing is that the steady part of the downswing is not likely to persist for much longer.
This brings us to the most interesting part of the above chart - examination of the previous declines with regard to their shape.
In late February, GDX declined steadily for 5 candlesticks (the above chart is based on 4-hourly candlesticks). Then it declined quickly for 3-4 candlesticks (there was a double bottom).
In mid-March, GDX declined steadily for 6 candlesticks. Then it declined quickly for 4-5 candlesticks (there was a double bottom).
Please note that there is a specific tendency for both: the base (steady decline) and the real move (quick decline). They were both slightly longer in the second case - each by 1 day. It's also interesting that we saw a double bottom at the end of each.
Now, GDX has been declining steadily for 7 candlesticks, which seems to fit the above pattern very well. If the more volatile part starts today - and this seems quite likely - then based on the above analogy, we can expect it to continue for about 5-6 trading days. This means that the bottom would be likely to form on April 7th (Tuesday) or April 8th (Wednesday).
Based on yet another technique (the previous ones are the analogy between 2008 and 2020 in gold, and the one about miners' reaching their declining support line that we outlined on Monday) it seems that we'll see a major bottom in the precious metals market next week, likely close to April 7th.
It could be the case we'll once again see a double bottom formation with one bottom on Tuesday, and one on Wednesday, but we have only one indication for it, so we wouldn't bet the farm on this particular scenario.
Food For Thought and Then Q&A
Before summarizing, we would like to point your attention to two articles that we just read on Yahoo! Finance:
https://finance.yahoo.com/news/stock-market-news-live-updates-april-1-2020-221359933.html
Quoting from the above article:
During a White House briefing Tuesday evening, President Donald Trump said Americans should prepare for what is going to be "a very, very painful two weeks" as the pandemic paces toward a peak in the U.S., before conditions improve.
Two points.
- How do you think Americans will prepare for what's going to be a very, very painful two weeks? One of the ways that people will likely come up with, is to sell whatever stocks they might have.
- Please note the wording "as the pandemic paces toward a peak in the U.S., before conditions improve". It gives the impression as if the peak was close, even though the text doesn't really say so. The peak is not close. The situation regarding Covid-19 is likely to get much worse. Based on our research (one of the sources), the factors that increase the risk are chronic zinc deficiency (over-consumption of processed foods that lack minerals and overtraining without proper zinc supplementation might be causes), high blood pressure, taking meds that lower zinc absorption (quite many of them do), obesity, and smoking. This combination of risk factors makes the Covid-19 particularly dangerous for Americans - of course not everyone has higher risk profile, but statistically and generally, this seems to be the case. On a side note, while we're not doctors, and checking with one would be advised, in our opinion, it might be a good idea to consider zinc supplementation, remembering that when one increases zinc intake significantly, they should also supplement or pay attention to copper.
Moreover, if you clicked the link to get to the article, please note what is visible on the video plugin at its start. There's a big red banner that says "Stocks lower as brutal quarter comes to a close". Just as we indicated yesterday, quarter's end was an important landmark.
That's probably why stocks didn't decline more yesterday, and why they are declining in today's pre-market trading. The Powers That Be were probably trying to push the prices higher, but they were unable to do that, and they managed to only limit the decline.
The other article is this:
https://finance.yahoo.com/news/u-pension-funds-may-pour-234054571.html
NEW YORK (Reuters) - U.S. pension funds that delayed rebalancing their portfolios are likely to pump about $400 billion into stocks over the next two quarters, analysts at JP Morgan said, providing a potential boost to equity markets battered by the coronavirus pandemic.
It is being reported as if portfolio rebalancing was something new that somehow entered the investing landscape out of the blue, and is now going to push prices higher. Pension funds, mutual funds, and other funds - as well as many individual investors - utilize rebalancing in order to keep their portfolios in check. And they have been doing so for decades.
During these decades, stocks rallied and declined, sometimes very significantly. It is true that there will be some buying based on the rebalancing that various funds utilize, but it might not be enough to prevent a panic-fear-driven slide. And it probably won't be.
A few more questions and replies before we summarize:
Q: Thank you for the great direction you are providing. I just signed up for your service so unfortunately, I wasn't able to take advantage of the amazing trade you are in. I plan on getting in on the next one. I have been stuck in mid tier silj miners and am looking to exit on this rally. Would you mind providing me a good exit price for silj.
A: While we can't provide investment advice, we think that SILJ will be hit very hard very soon and if we had an open position in the SILJ ETF, we would exit the trade immediately, regardless of its price or losses that it could generate. The losses were already generated, and are beyond one's control - they are already in the past. What one has some control of focusing on the outlook and making sure that the position that one has is in tune with it. Besides, what's worse than taking losses on SILJ? Taking much bigger losses on SILJ. Wouldn't it be great to get out and buy back at much lower prices? And perhaps making money on the decline in the meantime? Again, we can't make any promises regarding any performance and the markets might not decline at all... But, we think the odds of a decline in the mining stocks here are extremely high. And we are putting our money, where our mouth is.
Q: They are now speaking about a round 4th of stimulus that will push infrastructures in first focal. If this plan goes ahead (and it seems it is), the demand in base metals like copper and silver will be huge. Do you think it will impact the future slide ahead?
Today gold is sliding but silver isn't, does that means the markets already forecast the plan? Or the 2008 analogies apply also at this point?
Also, I was wondering regarding the palladium and platinum if it was possible to have an updated situation?
Palladium rallied particularly hard today, is the similarity about being the last one to rally like the kiss of death before the major drop also apply here?
A: I don't think that the plans to heavily invest in infrastructure is going to prevent or change anything with regard to the upcoming decline. The decline is likely going to be very emotional and relatively quick. That's not where the fundamentals really matter. Besides, the fundamentals for gold are excellent right now, but we expect it to slide anyway. The fundamentals will matter as far as the rebound and its size are concerned.
Yesterday's relative strength in silver and industrial metals might reflect the temporary focus on the infrastructure plan, or relatively good data from China. Either way, it doesn't seem to change anything with regard to the big decline that's likely just around the corner.
Palladium's price was approximately cut in half recently, so it's no wonder that its rebound is very volatile. We expect it to slide once again, along with platinum and silver, and practically the entire rest of the precious metals sector. As far as the shape of the decline is concerned, it seems that palladium's and platinum's decline will be similar to the one of silver as they are all industrial metals. Given the huge volatility in palladium, it's difficult to estimate a downside target for it, but if we had to make a guesstimate, we'd say that the 2018 low of $815 is not out of the question. In case of platinum, we wouldn't be surprised to see it at its 90's lows - in the 330s. In both cases, it seems that they would bottom along with gold, silver, and miners - perhaps close to April 7th. We realize these forecasts are very daring, and that it could take much longer for these levels to be reached, or the bottoms might form at much higher price levels, but still, that's what seems quite likely as of today.
Q: Dear Przemyslaw, If you have time? How did you calculate JDST going to $16.27 when GDXJ goes to.9.57. I get a much lower number around $6.30 using the percentage/ ratio drop. Just curious?
A: The calculation is based not only on how big the price move is, but also how long it takes. If GDXJ declines by 50% on just one day, the JDST would be likely to rally by about 100% (given the current 2x leverage). However, what if it takes 10 trading days instead of one? Due to compounding interest, this doesn't mean that GDXJ would decline by 5% on each day, but by about 6.6967%.
(1 - 0.066966)^10 = approximately 0.50 (which means a loss of about 50%)
This means that on each day JDST should theoretically rally 2 x 6.6967% = 13.3934%
Let's see what happens after 10 days of such daily rallies:
(1 + 0.133934)^10 = approximately 3.51 (which means a gain of about 251%)
The above is still imperfect, because it assumes that GDXJ would decline the same amount each day, and the odds are that it won't be the case. This would likely lower the final rate of return. We are using the above calculation method while conservatively lowering each parameter by a bit. The final outcome might be close to the final price. The closer we get to the bottom and the fewer days there are left to forecast, the more accurate will such estimations become.
Simply multiplying the expected price move in the underlying ETF by the leverage, provides us with a minimum target (given that the prediction for the underlying ETF is correct that is), but not necessarily the most likely one.
On the other hand... If the price moves back and forth in a volatile manner, the leveraged ETF might be hit particularly hard. Let's say that the GDXJ declines by 20% and then rallies by 27%. What will happen to its price? It will finally be (1 - 0.2) x (1 + 0.27) = 1.016 (about 1.6% higher). And the 2x leveraged ETF? It would be (1 - 0.2 x 2) x (1 + 0.27 x 2) = 0.924 (about 7.6% lower).
Leveraged ETFs are like razors - great for professionals and some that know how to use, but could be dangerous for many, especially those who are using them for the first time.
Summary
Summing up, it seems that we are already in the final huge downswing in the precious metals sector, but since it's early part thereof, it's not yet volatile. This is in perfect tune with how the previous two declines in the mining stocks started.
Overall, it seems that the next major reversal will take place relatively close to April 7th. That's based on not one, but three methodologies. This might even be THE bottom for the precious metals sector.
This rally might have made one feel bullish - after all, the prices of miners seem to have recovered to a large extent. Please be sure to keep in mind that what we saw, was the first big wave down of a much bigger move lower, also in the stock market. The coronavirus stock-market decline has likely just begun and once it continues - and as the rally in the USD Index resumes - the precious metals market is likely to suffer. Silver and miners are likely to be hit particularly hard.
The real panic on the US stock market will begin when people start dying from Covid-19 in the US in thousands per day. It might peak when the death toll is in tens of thousands per day. We hate to be right on this prediction, but we expect the number of the total confirmed cases in the US to be multiple times greater than the analogous number in China. At the moment of writing these words, the number of total confirmed cases in the US is about 190k and the death toll is above 4k and it's starting to accelerate.
It's 2008 on steroids.
Most importantly - stay healthy and safe. We're making a lot of money on these price moves (and we'll likely make much more in the following weeks and months), but you have to be healthy to really enjoy the results.
Finally, we would like to remind you about the very important and very timely April Gold Market Overview report, which we have posted on Sunday. It's the final day, when it's available for just $1 (subscriptions - including this one - renew normally unless cancelled), so we strongly encourage you to read it, even if you previously didn't have access to these reports. Naturally, the All-inclusive subscribers have already received the notification about it yesterday, as soon as it was posted.
By the way, we recently opened a possibility to extend one's subscription for a year with a 10% discount in the yearly subscription fee (the profits that you took have probably covered decades of subscription fees...). It also applies to our All-Inclusive Package (if you didn't know - we just made huge gains shorting crude oil and are also making money on both the decline and temporary rebound in stocks). The boring time in the PMs is over and the time to pay close attention to the market is here - it might be a good idea to secure more access while saving 10% at the same time.
Important: If your subscription got renewed recently, but you'd like to secure more access at a discount - please let us know, we'll make sure that the discount applies right away, while it's still active. Moreover, please note that you can secure more access than a year - if you secured a yearly access, and add more years to your subscription, each following year will be rewarded with an additional 10% discount (20% discount total). We would apply this discount manually - please contact us for details.
Secure more access at a discount.
As always, we'll keep you - our subscribers - informed.
To summarize:
Trading capital (supplementary part of the portfolio; our opinion): Full speculative short positions (250% of the full position) in mining stocks (but not in gold nor silver) are justified from the risk to reward point of view with the following binding exit profit-take price levels:
Senior mining stocks (price levels for the GDX ETF): binding profit-take exit price: $10.32; stop-loss: none (the volatility is too big to justify a SL order in case of this particular trade); binding profit-take level for the DUST ETF: $11.47; stop-loss for the DUST ETF: none (the volatility is too big to justify a SL order in case of this particular trade)
Junior mining stocks (price levels for the GDXJ ETF): binding profit-take exit price: $9.57; stop-loss: none (the volatility is too big to justify a SL order in case of this particular trade); binding profit-take level for the JDST ETF: $14.87; stop-loss for the JDST ETF: none (the volatility is too big to justify a SL order in case of this particular trade)
Those who can't or prefer not to take positions against mining stocks, might want to consider speculative short positions in silver with $8.58 as the binding profit-take exit price.
Long-term capital (core part of the portfolio; our opinion): No positions (in other words: cash)
Insurance capital (core part of the portfolio; our opinion): Full position
Whether you already subscribed or not, we encourage you to find out how to make the most of our alerts and read our replies to the most common alert-and-gold-trading-related-questions.
Please note that the in the trading section we describe the situation for the day that the alert is posted. In other words, it we are writing about a speculative position, it means that it is up-to-date on the day it was posted. We are also featuring the initial target prices, so that you can decide whether keeping a position on a given day is something that is in tune with your approach (some moves are too small for medium-term traders and some might appear too big for day-traders).
Plus, you might want to read why our stop-loss orders are usually relatively far from the current price.
Please note that a full position doesn't mean using all of the capital for a given trade. You will find details on our thoughts on gold portfolio structuring in the Key Insights section on our website.
As a reminder - "initial target price" means exactly that - an "initial" one, it's not a price level at which we suggest closing positions. If this becomes the case (like it did in the previous trade) we will refer to these levels as levels of exit orders (exactly as we've done previously). Stop-loss levels, however, are naturally not "initial", but something that, in our opinion, might be entered as an order.
Since it is impossible to synchronize target prices and stop-loss levels for all the ETFs and ETNs with the main markets that we provide these levels for (gold, silver and mining stocks - the GDX ETF), the stop-loss levels and target prices for other ETNs and ETF (among other: UGLD, DGLD, USLV, DSLV, NUGT, DUST, JNUG, JDST) are provided as supplementary, and not as "final". This means that if a stop-loss or a target level is reached for any of the "additional instruments" (DGLD for instance), but not for the "main instrument" (gold in this case), we will view positions in both gold and DGLD as still open and the stop-loss for DGLD would have to be moved lower. On the other hand, if gold moves to a stop-loss level but DGLD doesn't, then we will view both positions (in gold and DGLD) as closed. In other words, since it's not possible to be 100% certain that each related instrument moves to a given level when the underlying instrument does, we can't provide levels that would be binding. The levels that we do provide are our best estimate of the levels that will correspond to the levels in the underlying assets, but it will be the underlying assets that one will need to focus on regarding the signs pointing to closing a given position or keeping it open. We might adjust the levels in the "additional instruments" without adjusting the levels in the "main instruments", which will simply mean that we have improved our estimation of these levels, not that we changed our outlook on the markets. We are already working on a tool that would update these levels on a daily basis for the most popular ETFs, ETNs and individual mining stocks.
Our preferred ways to invest in and to trade gold along with the reasoning can be found in the how to buy gold section. Additionally, our preferred ETFs and ETNs can be found in our Gold & Silver ETF Ranking.
As a reminder, Gold & Silver Trading Alerts are posted before or on each trading day (we usually post them before the opening bell, but we don't promise doing that each day). If there's anything urgent, we will send you an additional small alert before posting the main one.
Thank you.
Sincerely,
Przemyslaw Radomski, CFA
Editor-in-chief, Gold & Silver Fund Manager

