

Briefly: in our opinion, full (300% of the regular position size) speculative short positions in junior mining stocks are justified from the risk/reward point of view at the moment of publishing this Alert.
Another daily gold rally without any major implications for gold stocks. Another new 2022 high in gold, while gold stocks are still close to their 2022 lows. What gives? Why can’t the precious metals market make up its mind?
Probably because it’s the interest-rate decision day today, and the markets might be reluctant to really drop (or soar) before it’s clear what the Fed is going to do and – most importantly – what the comments are going to be about the future shape of monetary tightening.
Let’s check what happened yesterday.
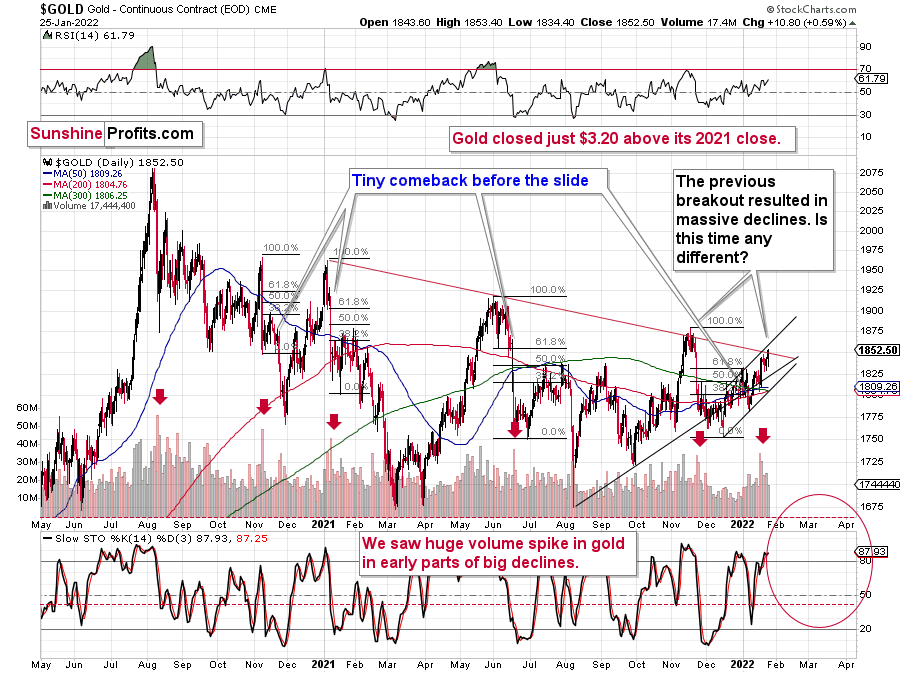
Gold moved to a new 2022 high and it finally managed to move above the declining red resistance line. The key thing about this small “breakout” is that it was not confirmed. What does it mean? It means that the breakout is not really bullish just yet.
This is especially the case since the previous attempt to break above the declining red resistance line – in late 2021 – was invalidated. Let’s keep in mind that “this time is different” is quite often a costly phrase. It’s not the gold market by itself that provides us with the most bearish indications either.
It’s gold stocks, in particular junior miners.
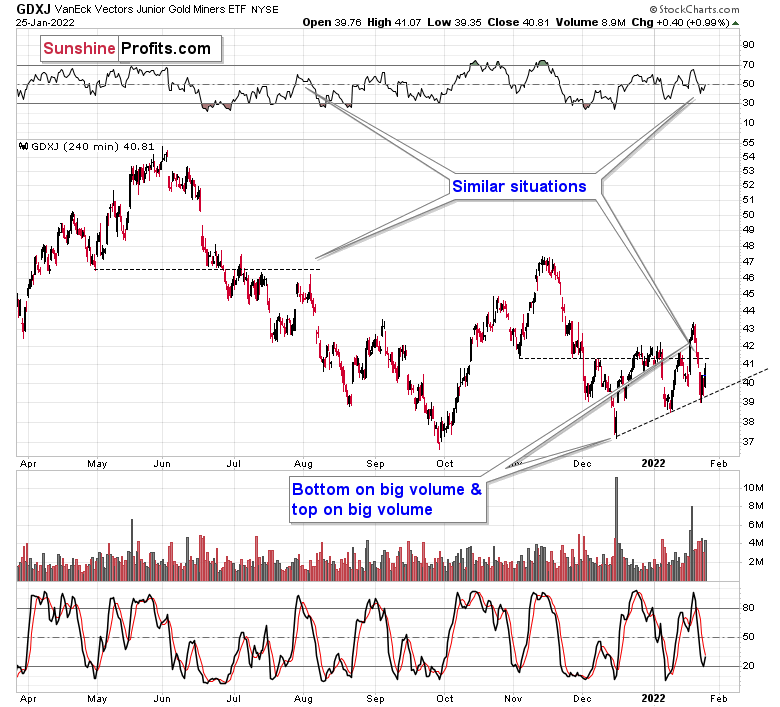
They did manage to end yesterday’s session a bit higher, but they are nowhere close to reaching their recent yearly highs. The miners remain weak, even if they closed yesterday’s session slightly higher.
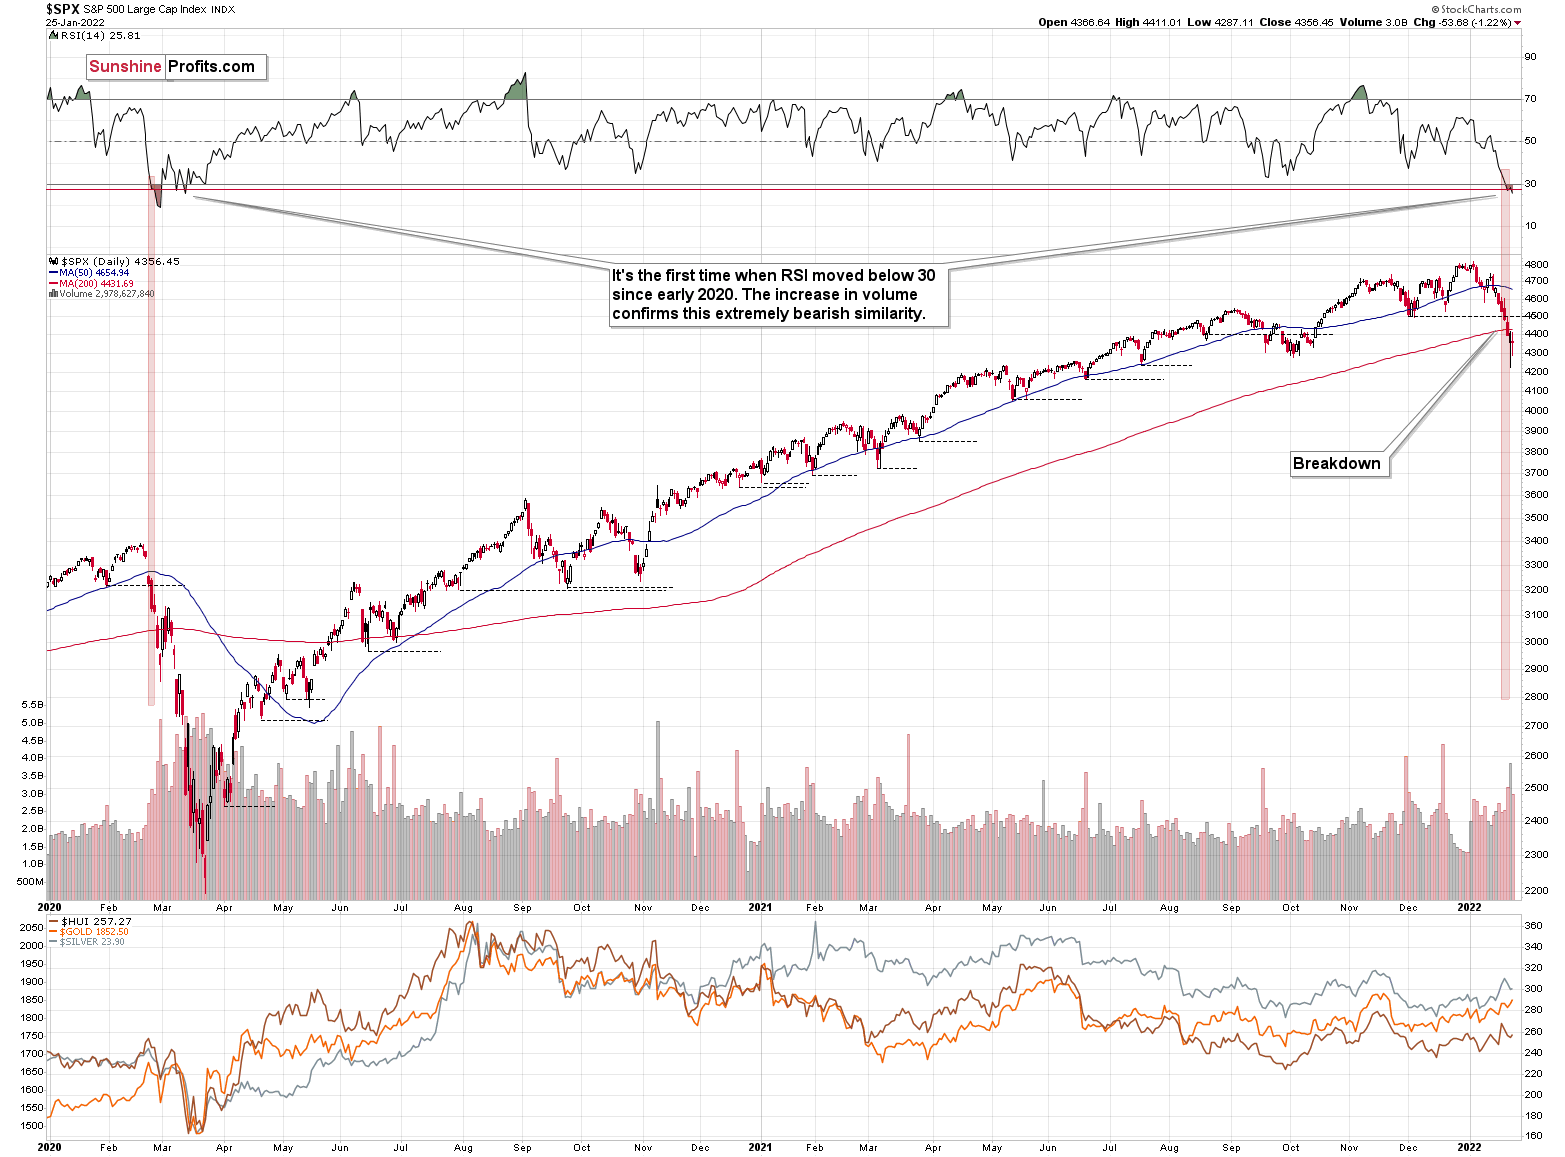
The S&P 500 didn’t rally yesterday, despite Monday’s big reversal. This means that my previous comments on the above chart remain up-to-date:
As I mentioned earlier, the S&P 500 declined and then rallied back up yesterday. The daily reversal took place on huge volume, which is bullish at its face value.
On the other hand, however, let’s keep in mind that the early-2020 decline had days of hesitation too. On Feb. 26, 2020, the S&P 500 also moved back and forth, closing only slightly lower. Declines resumed on the following day.
Looking at the RSI, we see that once this indicator moved below 30, it (and the S&P 500 itself) kept declining until it moved below 20. That’s not what happened yesterday.
Also, the initial decline in 2020 took the S&P 500 lower by over 15% before we saw a small corrective upswing. The 2022 decline took the S&P 500 down by a bit over 12%, including yesterday’s intraday low. If history repeats itself to a significant degree, we could see even lower stock market prices before seeing a more visible rebound.
On the other hand, seeing a rebound right away wouldn’t be likely to change anything – it seems that an even bigger, medium-term decline is already underway.
Yes, RSI below 30 is generally considered oversold territory, but the direct analogies take precedence over the “usual” way in which things work in markets in general. In this case, the situation could get from oversold to extremely oversold. Let’s keep in mind that stocks declined very sharply in 2020.
One could say that times were different, but were they really? The key difference is that the monetary authorities are now already after the bullish money-printing cycle and are handling inflation by aiming to increase interest rates, while they had been preparing to cut them in 2020.
The situation regarding the pandemic is not that different either. Sure, back in 2020, it was all new, we had massive lockdowns and there was great uncertainty regarding… pretty much everything. Now, the situation is not entirely unexpected, but given the explosive nature of new COVID-19 cases (likely due to the Omicron variant), it’s still quite new and uncertain.
The uncertainty is not as great as it was back in 2020, but then again, now we’re facing monetary tightening, not dramatic dovish actions. Thus, I wouldn’t exclude a situation in which we really see a repeat of the early-2020 performance, where the declines are sharp and huge. The technicals in the precious metals market have been pointing to that outcome for months, anyway, especially the long-term HUI Index chart that I’ve been discussing previously.
The initial downside target for the GDXJ ETF remains up-to-date as well.
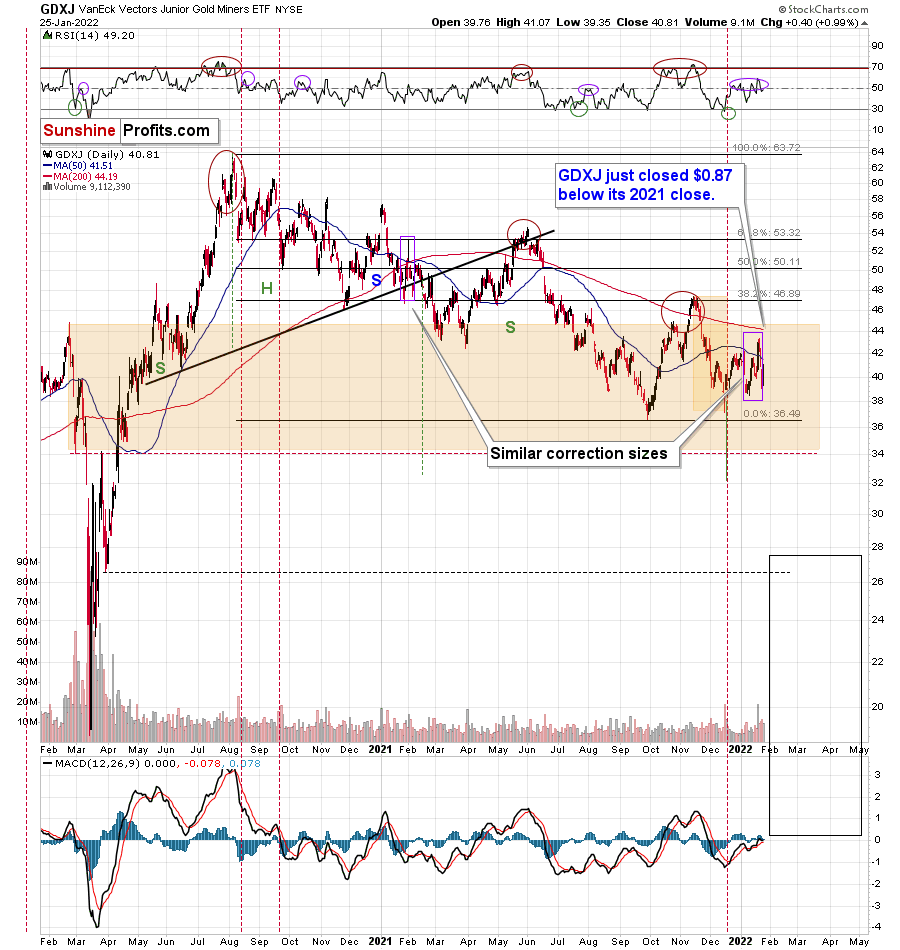
Please note the broad red rectangle that I placed on the above chart. It’s there to illustrate the size of the initial 2020 decline.
Yes, junior miners are already below the price levels from which the 2020 started, and if they simply decline as much as they declined back then (so, I’m not asking for anything “completely new” to happen), they could be at $34 in a matter of days.
Perhaps (no guarantees; there could always be delays) the markets will fall quite soon – once they get the next portion of information from the Fed. Consequently, it could be a matter of hours, not necessarily days or weeks.
Having said that, let’s take a look at the situation from a fundamental point of view.
Tread Carefully, Powell
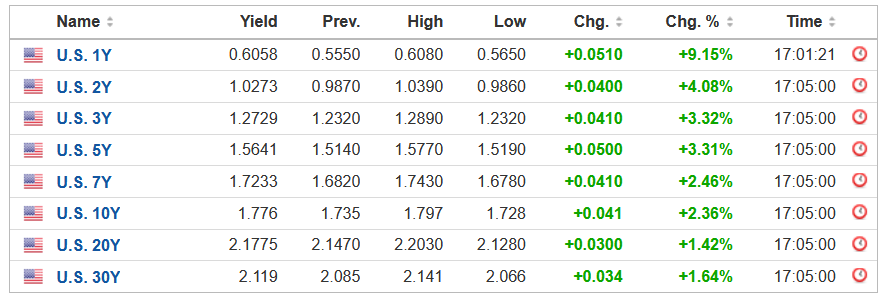
With Fed Chairman Jerome Powell taking center stage this afternoon, the financial markets are still freaking out about potential rate hikes. For example, the S&P 500 and the NASDAQ Composite sold off into the close on Jan. 25, and U.S. Treasury yields continued their bullish ascent.
Please see below:
 Source: Investing.com
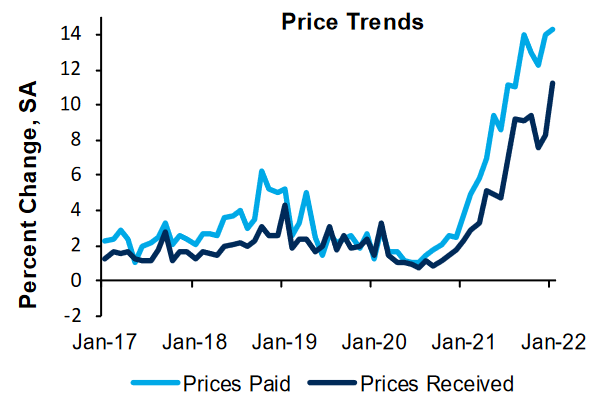
Moreover, with the inflationary outlook still materially unsettled, the FOMC has little room for a dovish pivot. To explain, the Richmond Fed released its Fifth District Survey of Manufacturing Activity on Jan. 25. While the headline index decreased from 16 in December to 8 in January, both the prices paid and received indexes rallied to new all-time highs.
Please see below:
 Source: Richmond Fed
Likewise, the report also revealed that “the wage index increased to 40, which is the second-highest value on record. Firms expect wages to continue increasing, with the expected wage index remaining firmly in expansionary territory.”
Speaking of wages, the Fed’s inflationary conundrum has broken the connection between the labor market differential and Americans’ net income expectations. For context, The Confidence Board’s metric calculates the net result of survey respondents’ beliefs that jobs are easy to obtain versus difficult to obtain.
Please see below:
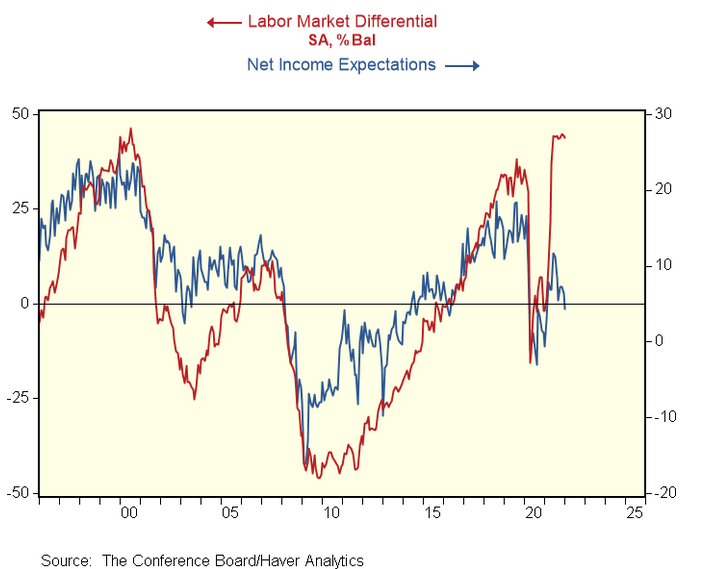
To explain, the red line above tracks the labor differential, while the blue line above tracks Americans’ net income expectations. When the red line is rising, it means that more respondents believe that jobs are easy to obtain. However, if you analyze the right side of the chart, you can see that the blue line hasn’t followed suit. As a result, with inflation eating away at Americans’ net incomes, the Fed needs to act to restore the historical relationship.
To that point, the Fed’s dual mandate is to control inflation and ensure maximum employment. With The Confidence Board’s labor differential near an all-time high, the Fed’s hawkish disposition is valid in this environment. Thus, with a strong U.S. labor market coupled with extremely elevated inflation, it’s the perfect combination for the FOMC to raise interest rates in the coming months.
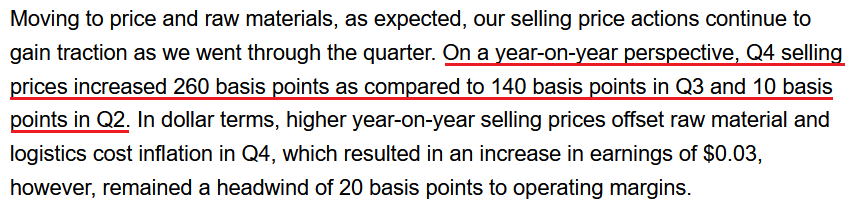
As further evidence, 3M released its fourth-quarter earnings on Jan. 25. After beating on both the top and the bottom lines, management said: “our revenue in the quarter finished better than we expected across all businesses (…). Overall, demand remains strong across our market-leading businesses, and we are continuing to prioritize growth investments in large attractive markets.”
Moreover, with inflation still increasing, CFO Monish Patolawala said the following during the Q4 earnings call:
 Source: 3M/Seeking Alpha
In addition, American Express also released its fourth-quarter earnings on Jan. 25. After beating on both the top and the bottom lines, the credit card giant painted a rosy portrait of the U.S. consumer. CEO Stephen Squeri told analysts during the Q4 earnings call:
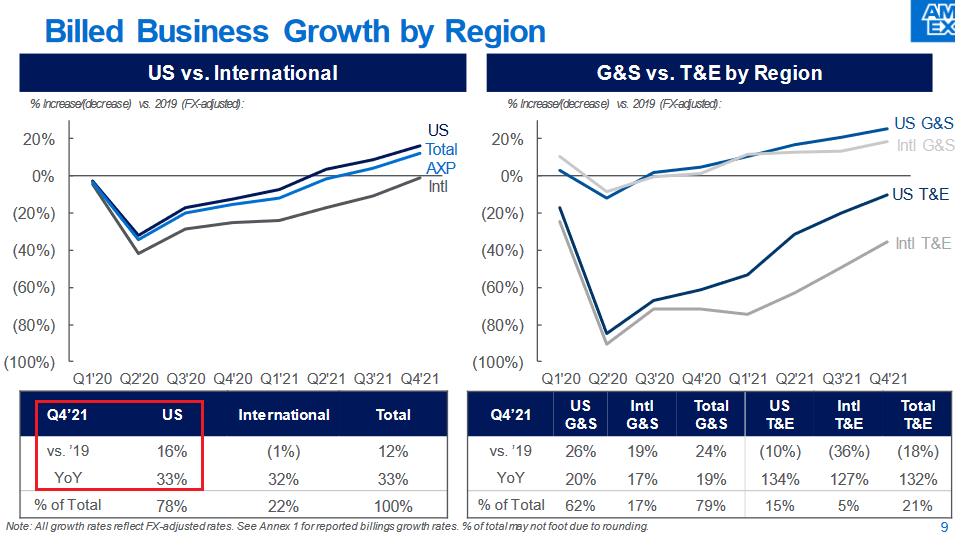
“Spending growth reached a record quarterly high, driven by continued increases in goods and services spending, which was 24% above pre-pandemic levels. Global consumer goods and services spending in the quarter grew 26% versus 2019. And we saw continued robust growth in small business B2B spending, which increased 25% over Q4 2019 levels. Overall T&E spending also continued to improve reaching 82% of pre-pandemic levels, driven by stronger consumer travel spend.”
He added:
“Our billed business momentum continues to be led by the U.S., where spending improved sequentially throughout 2021 and grew 16% above 2019 levels in the fourth quarter.”
Please see below:
 Source: American Express
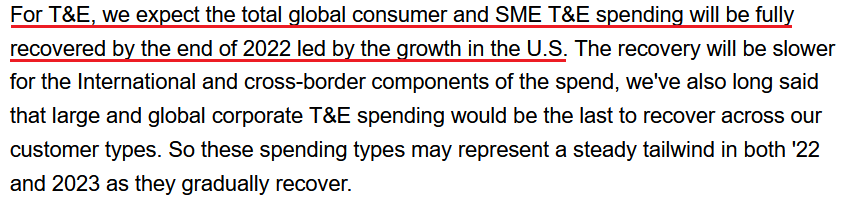
What’s more, while the Omicron variant has disrupted travel and expense (T&E) spending, the U.S. is still outperforming the rest of the world. Squeri said:
“We did see some modest impacts from the Omicron variant in T&E spending as the pace of recovery slowed a bit in December. But even with that modest slowdown, U.S. consumer T&E was not only fully recovered in the fourth quarter, but actually grew 8% above 2019 levels.”
As a result:
 Source: American Express/Seeking Alpha
Thus, while I’ve stated this on numerous occasions: the U.S. economy remains resilient and the U.S. consumer is quite strong as well. However, with a bullish U.S. economy bearish for the PMs and the NASDAQ Composite, liquidity-fueled assets should struggle in the coming months.
For example, American Express’ quarterly outperformance supports the Fed’s hawkish stance. With inflation extremely elevated and growth and consumer spending only stifled due to coronavirus disruptions, the warmer weather should result in renewed economic optimism. As a result, hiking interest rates is a logical reaction from the Fed.
Finally, while the USD Index has been relatively range-bound in recent weeks, brighter days are likely ahead. For context, we don’t expect any bombshell announcements from Powell today. However, with rate hikes poised to commence in the coming months, Bank of America told its clients that the USD Index remains a “buy-on-dip” story.
Please see below:
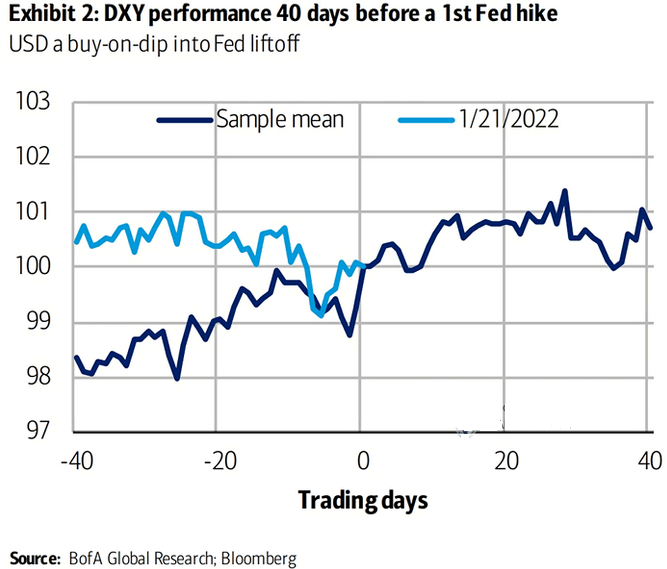
To explain, the dark blue line above tracks the USD Index’s average performance 40 days before the Fed raises interest rates, while the light blue line above tracks the current price action. As you can see, the USD Index is still trading within its expected range. However, with the dark blue line signaling that higher highs are often the norm as we approach the Fed’s official announcement, fundamental reinforcements should uplift the USD Index over the next few months. As such, more pain should confront the PMs.
The bottom line? While many market participants now fear a U.S. recession, the data suggests otherwise. With U.S. consumers still eager to spend their money, imagine their optimism when the cold weather and coronavirus panic fades in the coming months. Likewise, if U.S. economic growth is holding up this well when sentiment is severely depressed, the FOMC should have the foresight to see the results when consumers can resume their daily routines.
However, please note that resilient economic growth doesn’t mean that things are bullish for the general stock market. Sure, banks, industrials, energy, and other economic-sensitivity sectors should benefit from higher interest rates. Conversely, technology and communication services account for nearly 40% of the S&P 500 and 100% of the NASDAQ Composite. As a result, sometimes too much of a good thing is actually bad.
In conclusion, the PMs rallied on Jan. 25, despite the general stock market’s struggles. However, while Powell may try and calm investors’ nerves today, he has little room to avoid rate hikes in the coming months. Moreover, with U.S. President Joe Biden imploring Powell to curb inflation, the writing is largely on the wall. As a result, the USD Index and U.S. Treasury yields have the fundamental wind at their backs, and it’s likely only a matter of time before the PMs realize this harsh reality.
Overview of the Upcoming Part of the Decline
- It seems to me that the corrective upswing is over or close to being over, and that gold, silver, and mining stocks are now likely to continue their medium-term decline.
- It seems that the first (bigger) stop for gold will be close to its previous 2021 lows, slightly below $1,700. Then it will likely correct a bit, but it’s unclear if I want to exit or reverse the current short position based on that – it depends on the number and the nature of the bullish indications that we get at that time.
- After the above-mentioned correction, we’re likely to see a powerful slide, perhaps close to the 2020 low ($1,450 - $1,500).
- If we see a situation where miners slide in a meaningful and volatile way while silver doesn’t (it just declines moderately), I plan to – once again – switch from short positions in miners to short positions in silver. At this time, it’s too early to say at what price levels this could take place, and if we get this kind of opportunity at all – perhaps with gold close to $1,600.
- I plan to exit all remaining short positions once gold shows substantial strength relative to the USD Index while the latter is still rallying. This may be the case with gold close to $1,350 - $1,400. I expect silver to fall the hardest in the final part of the move. This moment (when gold performs very strongly against the rallying USD and miners are strong relative to gold after its substantial decline) is likely to be the best entry point for long-term investments, in my view. This can also happen with gold close to $1,375, but at the moment it’s too early to say with certainty.
- As a confirmation for the above, I will use the (upcoming or perhaps we have already seen it?) top in the general stock market as the starting point for the three-month countdown. The reason is that after the 1929 top, gold miners declined for about three months after the general stock market started to slide. We also saw some confirmations of this theory based on the analogy to 2008. All in all, the precious metals sector is likely to bottom about three months after the general stock market tops.
- The above is based on the information available today, and it might change in the following days/weeks.
You will find my general overview of the outlook for gold on the chart below:
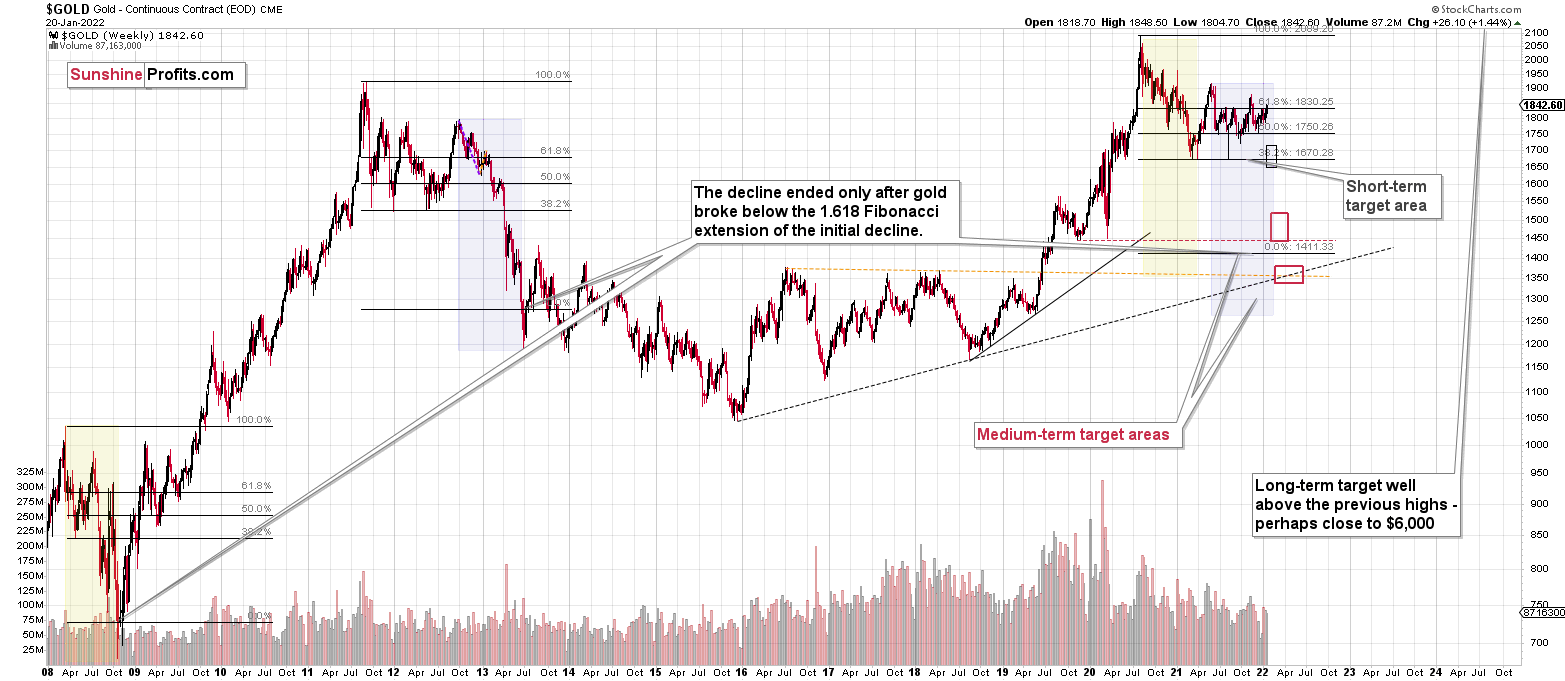
Please note that the above timing details are relatively broad and “for general overview only” – so that you know more or less what I think and how volatile I think the moves are likely to be – on an approximate basis. These time targets are not binding or clear enough for me to think that they should be used for purchasing options, warrants or similar instruments.
Letters to the Editor
Q: I wonder if you could comment on the apparent daily underperformance of GDXD relative to JDST. I know you have received this question before as it relates to long-term performance. The answer there is clear, as it relates to compounded daily moves. But even on a day-to-day basis, GDXD often seems to fail to live up to its leverage. For example, just now JDST is at 11.76, up 7.89 percent, so GDXD should be up over 11 percent but is in fact at 18.92, up only 8.05 percent. Similarly, I noted a time on Friday where JDST was at 10.84, which was up 5.14 percent for the day, while GDXD was at 17.20, up only 5.07 percent for the day. What gives?
A: The GDXD is a triple inverse leveraged ETF, while the JDST is a double inverse leveraged ETF, so one might expect the former to move about 1.5x as much as the latter.
This would be very likely to be the case… if the GDX and GDXJ performed identically on a given day – or at least very similarly.
Why would it make a difference? Because the JDST is a 2x inverse ETF based on ONLY the GDXJ ETF, while the GDXD is a 3x inverse ETF based on both: GDX and GDXJ.
Quoting from Microsector’s website (they provide the GDXD ETF):
So, as you can see, the GDXD is mostly (about 3/4) leveraging the price moves in the GDX and not the GDXJ ETF.
If there are big discrepancies between GDX and GDXJ, and the latter moves much more, then the GDXD could even move less than JDST will. Thus, the recent “odd” movement in both ETFs compared to each other is actually not that odd.
Q: I am a new member of the Gold and Silver Alert. I find your analysis to be very insightful. I am familiar with gold's cycles and I like that gold is not strictly tied to stocks and bonds and does not generally follow the herd, which helps me to avoid the monetary devaluation whims of the FED. Thanks for the excellent technical analysis. I find it interesting that Gann time-frame technical analysis is also supporting a major top in the market on the 7-15 of February, but does not know why. It has accurately predicted several major tops in the past. I feel like Gann is some form of astrology. Please give your insight.
A: Thanks for the question, and welcome aboard!
There are two short-term triangle-vertex-based reversals in February (mid- and late-Feb) and also a long-term one in early February.
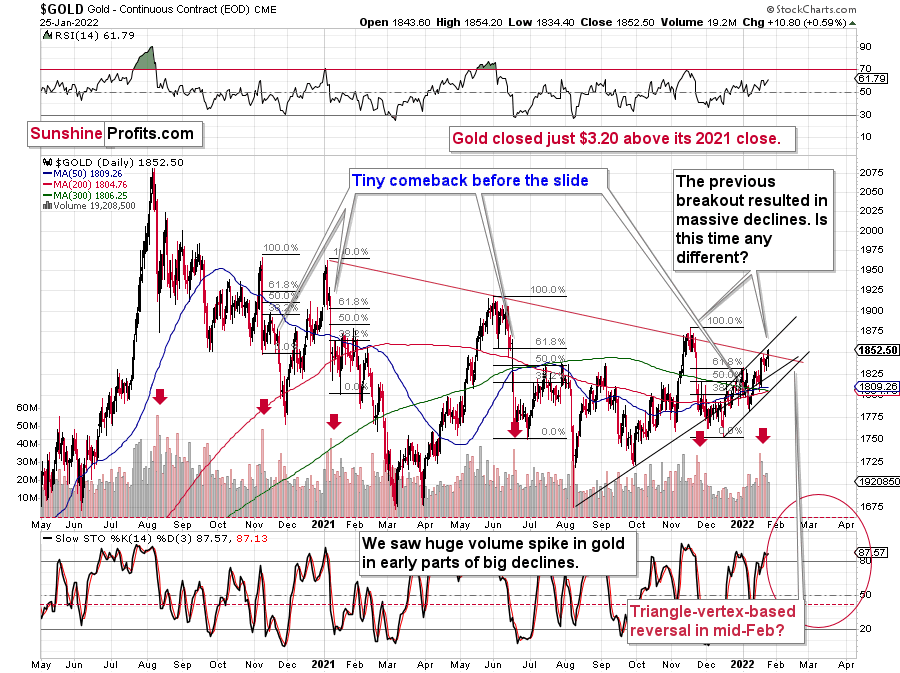
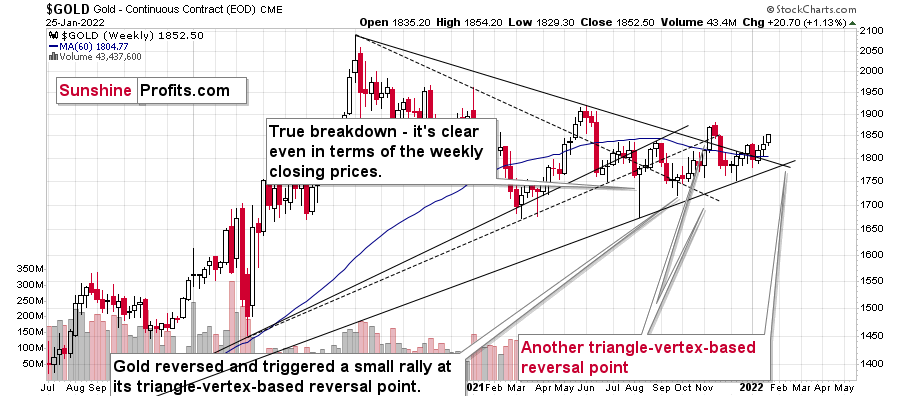
So, it could indeed be the case that gold reverses in one way or another next month.
I wouldn’t be sure about the nature of the price extreme, though. It could be the case that we see a big slide shortly and a short-term bottom close to the middle of February.
Given the recent weakness in mining stocks compared to gold, I wouldn’t be surprised to see the above kind of scenario unfold.
On the other hand, it’s also not out of the question that we see back-and-forth movement in the mining stocks while gold moves somewhat higher, only to slide profoundly in February (perhaps topping close to the middle of the month).
Either way, short positions in junior mining stocks remain justified from the risk to reward point of view, in my opinion.
As for Gann’s methodology, it’s one of the technical approaches, and it’s tough to really place a finger on the “why” aspect of a certain technique. Why do Fibonacci levels really work? Or the triangle-vertex-based reversal. That’s not crystal clear, but we’ve seen numerous times when they worked remarkably well – also on the above chart.
I haven’t personally found the Gann techniques particularly useful (or they simply don’t align with my way of reading charts) for the precious metals market, but if others are happy using them, and it works well for them, then I don’t see why they should not continue using them. I’ll stick to the methodologies that I saw working on this particular market over and over again (and ones that helped to time the 2020 bottom).
Summary
Summing up, it seems to me that the corrective upswing is over or very close to being over, and that gold, silver, and mining stocks are now likely to continue their medium-term decline (note: silver might continue to outperform and rally for a few more days – it’s practically impossible to tell how high it can go in the very near term, but either way, it’s likely that this decline will be reversed rather quickly).
Please note that if last week’s rally was indeed based on supposedly increased tensions regarding Ukraine, then it’s likely that this rally is not going to be significant, and it might already be over. The “supposedly shocking” news already hit the market, and without any real follow-up (material) action, like Russian troops marching across the border with Ukraine, it seems that there’s nothing additional that markets could rally on. The market already “knows” that the tensions are very high and the chance for military conflict is high, regardless of whether that’s true or not. There’s not much more that can be said to increase that even further – only real action is likely to do it – and seeing such action is very unlikely in my view.
I continue to think that junior mining stocks are currently likely to decline the most out of all parts of the precious metals sector.
From the medium-term point of view, the key two long-term factors remain the analogy to 2013 in gold and the broad head and shoulders pattern in the HUI Index. They both suggest much lower prices ahead.
It seems that our profits from the short positions are going to become truly epic in the following months.
After the sell-off (that takes gold to about $1,350 - $1,500), I expect the precious metals to rally significantly. The final part of the decline might take as little as 1-5 weeks, so it's important to stay alert to any changes.
Most importantly, please stay healthy and safe. We made a lot of money last March and this March, and it seems that we’re about to make much more on the upcoming decline, but you have to be healthy to enjoy the results.
As always, we'll keep you - our subscribers - informed.
To summarize:
Trading capital (supplementary part of the portfolio; our opinion): Full speculative short positions (300% of the full position) in junior mining stocks are justified from the risk to reward point of view with the following binding exit profit-take price levels:
Mining stocks (price levels for the GDXJ ETF): binding profit-take exit price: $35.73; stop-loss: none (the volatility is too big to justify a stop-loss order in case of this particular trade)
Alternatively, if one seeks leverage, we’re providing the binding profit-take levels for the JDST (2x leveraged) and GDXD (3x leveraged – which is not suggested for most traders/investors due to the significant leverage). The binding profit-take level for the JDST: $16.18; stop-loss for the JDST: none (the volatility is too big to justify a SL order in case of this particular trade); binding profit-take level for the GDXD: $32.08; stop-loss for the GDXD: none (the volatility is too big to justify a SL order in case of this particular trade).
For-your-information targets (our opinion; we continue to think that mining stocks are the preferred way of taking advantage of the upcoming price move, but if for whatever reason one wants / has to use silver or gold for this trade, we are providing the details anyway.):
Silver futures downside profit-take exit price: $19.12
SLV profit-take exit price: $17.72
ZSL profit-take exit price: $41.38
Gold futures downside profit-take exit price: $1,683
HGD.TO – alternative (Canadian) inverse 2x leveraged gold stocks ETF – the upside profit-take exit price: $12.48
HZD.TO – alternative (Canadian) inverse 2x leveraged silver ETF – the upside profit-take exit price: $30.48
Long-term capital (core part of the portfolio; our opinion): No positions (in other words: cash
Insurance capital (core part of the portfolio; our opinion): Full position
Whether you already subscribed or not, we encourage you to find out how to make the most of our alerts and read our replies to the most common alert-and-gold-trading-related-questions.
Please note that we describe the situation for the day that the alert is posted in the trading section. In other words, if we are writing about a speculative position, it means that it is up-to-date on the day it was posted. We are also featuring the initial target prices to decide whether keeping a position on a given day is in tune with your approach (some moves are too small for medium-term traders, and some might appear too big for day-traders).
Additionally, you might want to read why our stop-loss orders are usually relatively far from the current price.
Please note that a full position doesn't mean using all of the capital for a given trade. You will find details on our thoughts on gold portfolio structuring in the Key Insights section on our website.
As a reminder - "initial target price" means exactly that - an "initial" one. It's not a price level at which we suggest closing positions. If this becomes the case (like it did in the previous trade), we will refer to these levels as levels of exit orders (exactly as we've done previously). Stop-loss levels, however, are naturally not "initial", but something that, in our opinion, might be entered as an order.
Since it is impossible to synchronize target prices and stop-loss levels for all the ETFs and ETNs with the main markets that we provide these levels for (gold, silver and mining stocks - the GDX ETF), the stop-loss levels and target prices for other ETNs and ETF (among other: UGL, GLL, AGQ, ZSL, NUGT, DUST, JNUG, JDST) are provided as supplementary, and not as "final". This means that if a stop-loss or a target level is reached for any of the "additional instruments" (GLL for instance), but not for the "main instrument" (gold in this case), we will view positions in both gold and GLL as still open and the stop-loss for GLL would have to be moved lower. On the other hand, if gold moves to a stop-loss level but GLL doesn't, then we will view both positions (in gold and GLL) as closed. In other words, since it's not possible to be 100% certain that each related instrument moves to a given level when the underlying instrument does, we can't provide levels that would be binding. The levels that we do provide are our best estimate of the levels that will correspond to the levels in the underlying assets, but it will be the underlying assets that one will need to focus on regarding the signs pointing to closing a given position or keeping it open. We might adjust the levels in the "additional instruments" without adjusting the levels in the "main instruments", which will simply mean that we have improved our estimation of these levels, not that we changed our outlook on the markets. We are already working on a tool that would update these levels daily for the most popular ETFs, ETNs and individual mining stocks.
Our preferred ways to invest in and to trade gold along with the reasoning can be found in the how to buy gold section. Furthermore, our preferred ETFs and ETNs can be found in our Gold & Silver ETF Ranking.
As a reminder, Gold & Silver Trading Alerts are posted before or on each trading day (we usually post them before the opening bell, but we don't promise doing that each day). If there's anything urgent, we will send you an additional small alert before posting the main one.
Thank you.
Przemyslaw Radomski, CFA
Founder, Editor-in-chief

