

Briefly: in our opinion, full (300% of the regular position size) speculative short positions in junior mining stocks are justified from the risk/reward point of view at the moment of publishing this Alert.
Today’s short-term analysis will once again be in video format. However, to make a long story short, the precious metals sector declined yesterday, and what we wrote previously remains up-to-date.
Besides, on a technical note, from now on, video analyses will be published on our other channel, GoldPriceForecast, and we strongly encourage you to subscribe there as well. You can hear more about the transition in the video below:
Gold Rallies as Hawkish Fears Spread
While risk assets retreated on Jan. 30, gold and silver ended the day in the green. In contrast, mining stocks confronted further selling pressure, and the GDXJ ETF has recorded a three-day losing streak.
However, a plethora of economic data could result in major swings this week, so it’s important to stay focused on the medium term. For example, not only does the FOMC take center stage on Feb. 1, but it’s a wild week for S&P 500 earnings.
Please see below:
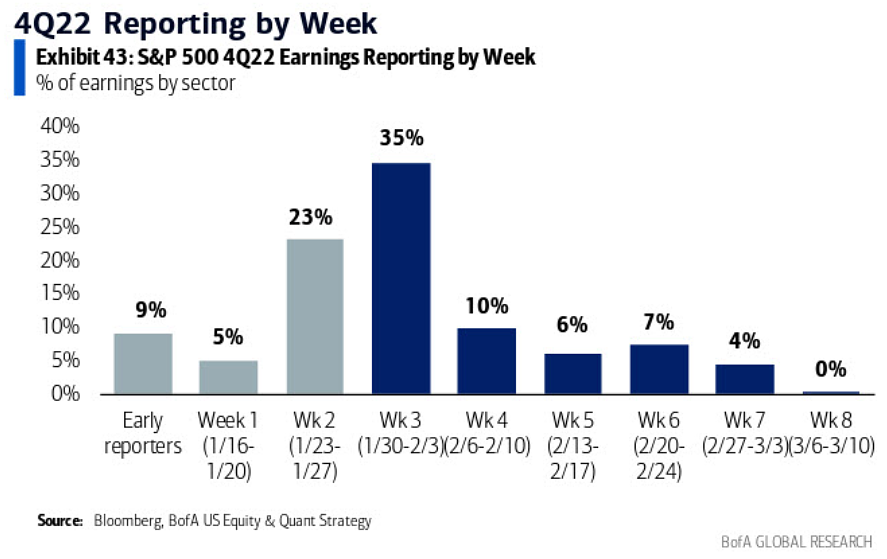 To explain, the tall blue bar near the middle (1/30-2/3) shows that 35% of S&P 500 companies report earnings this week, which marks the busiest period on the schedule. Therefore, good and bad prints could influence after-hours sentiment, impact the futures market, and affect investors’ outlook for risk-on and risk-off assets. As a result, the noise should be amplified in the days ahead.
In contrast, the medium-term technicals and fundamentals remain on track, and the PMs should suffer mightily as the liquidity drain continues.
We have warned for months that the crowd underestimates the peak U.S. federal funds rate (FFR) and ignores the historical lessons at their own peril. Moreover, with the U.S. housing market recovering from its recent lull, the results highlight why interest rates are too low to induce the demand destruction required to reduce inflation.
Remember, the housing sector is the most sensitive to interest rates, and its resiliency is an ominous sign for the pivot bulls. Redfin Corporation – which operates a residential real estate brokerage in 95 markets in North America and abroad – wrote on Jan. 25:
“The housing market has begun to recover after hitting a low point in the second week of November….. The number of Redfin customers requesting first tours has improved 17 percentage points from the November trough” and “Redfin agents report that bidding wars are back in some markets, including Seattle, central Florida and Richmond, VA.”
In addition:
“Mortgage applications are up 28% from early November as the average 30-year-fixed mortgage rate (FRM) has declined to 6.15% from its November peak of 7.08% – the largest 10-week decline since 2009. That has sent the typical homebuyer’s mortgage payment down 10% (about $180) since fall.”
Please see below:
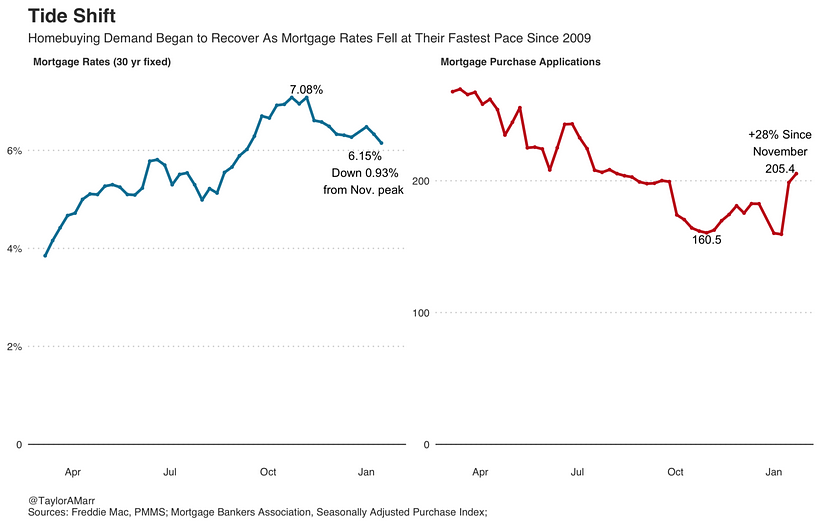 To explain, the blue (30Y FRM) and red (mortgage applications) lines above depict the relationship between interest rates and housing demand. As you can see, a less than 1% decline in the 30Y FRM increased buyers’ appetites and applications rose materially. Furthermore, if housing can’t suffer a slowdown of more than ~seven months, then interest rates are not high enough to stifle demand in less interest-rate-sensitive industries.
The report added:
“I’ve seen more homes go under contract this month than in the entire fourth quarter. Listings that were stagnant in November and December are suddenly getting one to two offers,” said San Jose, CA Redfin agent Angela Langone.
Consequently, the data supports our conclusion that inflation will not decline linearly. History shows that when inflation becomes unanchored, it ebbs and flows unless the FFR is high enough to collapse demand. That is not present right now.
As further evidence, please see this Bloomberg headline from Jan. 29:
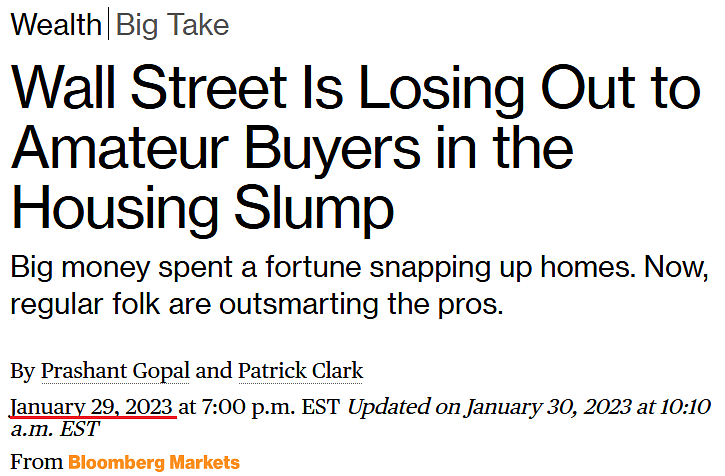 The article proclaims savvy retail investors are “flipping homes,” while Fintech and private equity firms incur losses. However, the housing market is often home to the least sophisticated retail investors with little understanding of inflation, interest rates and valuation; and history shows that retail investors suffer the brunt of the losses when the tide turns, and sadly, this time should be no different.
But, the important point is that if the dip buyers are still “flipping homes,” we’re far from peak interest rates.
To that point, the Dallas Fed released its Texas Manufacturing Outlook Survey on Jan. 30. The headline index increased from -20 in December to -8.4 in January, and an excerpt read:
“Labor market measures pointed to stronger employment growth and longer workweeks. The employment index climbed four points to 17.6, a reading significantly above its series average of 7.9. Thirty-one percent of firms noted net hiring, while 13 percent noted net layoffs. The hours worked index held fairly steady at 3.8.”
Please see below:
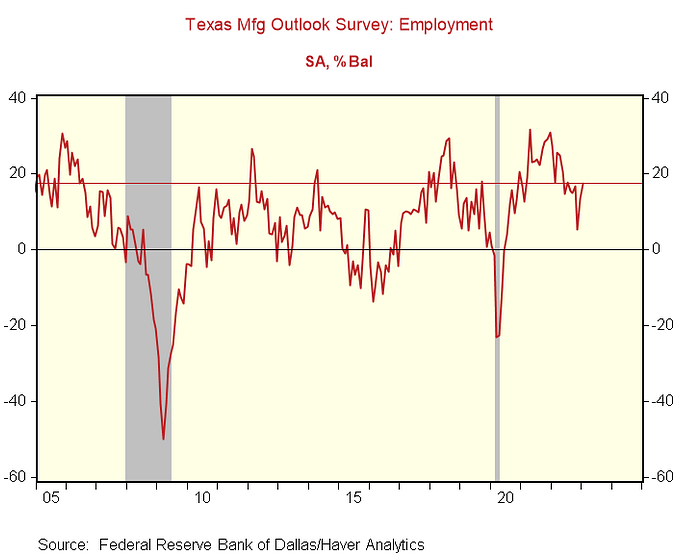 To explain the red line above shows how the Dallas Fed’s employment index improved for the third time in four months and is at its highest level since July. Thus, we’re far from the kind of crash that would support a dovish pivot.
Also, while “Price pressures were generally steady and wage growth eased slightly in January,” this month’s “special questions” signal sticky wage inflation.
Please see below:
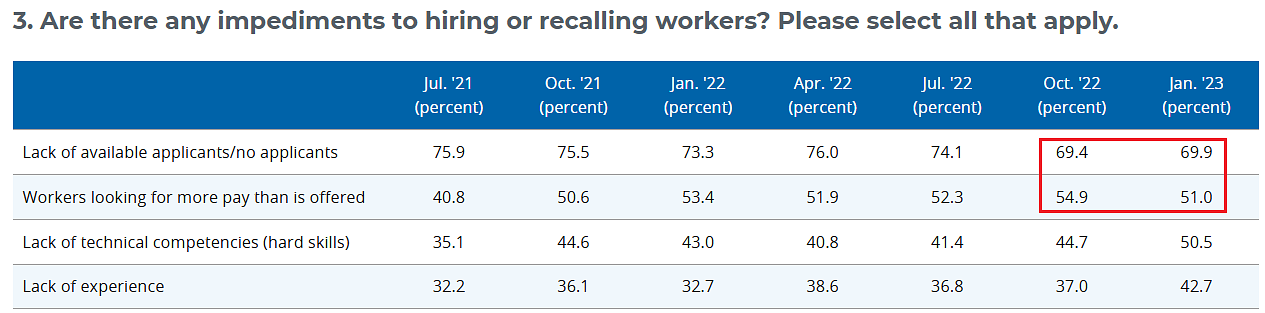 To explain, the red box above shows most firms still cite a lack of applicants as the primary deterrent to reaching adequate staffing levels. More importantly, 51% of firms noted that workers are asking for more pay than what is offered, and the January figure is near the ~50% threshold that’s been present since October 2021. Therefore, prospective employees are still driving a hard bargain, and if Americans were desperate for work, this wouldn’t be the case.
Finally, while the momentum investors (CTAs) have helped push the PMs higher, other market participants have sold the rally.
Please see below:
 To explain, the gold line above tracks the gold price, while the purple, green and red bars above track the weekly ETF flows compiled by the World Gold Council. If you analyze the two major upswings in the middle and left side of the chart, you can see that a higher gold price culminated with ETF inflows.
In contrast, the rally on the right side of the chart has been sold, and consolidated ETF flows have been negative for the last three weeks (updated on Jan. 27). As such, it’s another sign that momentum, and not fundamentals, is the driving force.
Overall, the data has not deviated from our expectations, and mining stocks are sending ominous signals. Remember, the implications of the FFR always exceeding the peak year-over-year (YoY) core CPI (north of 6%) is relevant because, throughout history, the Fed was forced to go further than it wanted. Yet, that’s often what it takes to win the inflation war.
How do you view the recent weakness in mining stocks? Is it a bad sign for gold? What’s more important this week: corporate earnings or the Fed?
Idle Silver Could Be In Trouble
While the S&P 500 suffered a material correction on Jan. 20, silver continued its sideways price action. However, as time passes and silver stagnates, its 50-day moving average continues to rise. As a result, the white metal needs to rally soon, or a breakdown could occur in the coming days; and with the latter more likely than the former in our view, an S&P 500 drawdown could provide the necessary fuel.
For example, while we’ve warned about this on numerous occasions, Morgan Stanley’s Chief U.S. Equity Strategist Mike Wilson wrote on Jan. 30, “Investors seem to have forgotten the cardinal rule of ‘Don’t Fight the Fed.’”
He added:
This is “just another bear-market trap,” and “all the good news is now priced in,” which means “the reality is likely to return with month-end, and the Fed’s resolve to tame inflation.”
In a nutshell:
“We think the recent price action is more a reflection of the seasonal January effect and short covering after a tough end to December and a brutal year…. We think it’s important to note that typically when forward earnings growth goes negative, the Fed is actually cutting rates. That’s not the case this time around, [which is] an additional headwind for equities.”
So, while the crowd has been happy to ignore these developments, eventually, sentiment will collide with the fundamentals; and since the latter often wins out over the medium term, the momentum should reverse sharply in the months ahead.
Please see below:
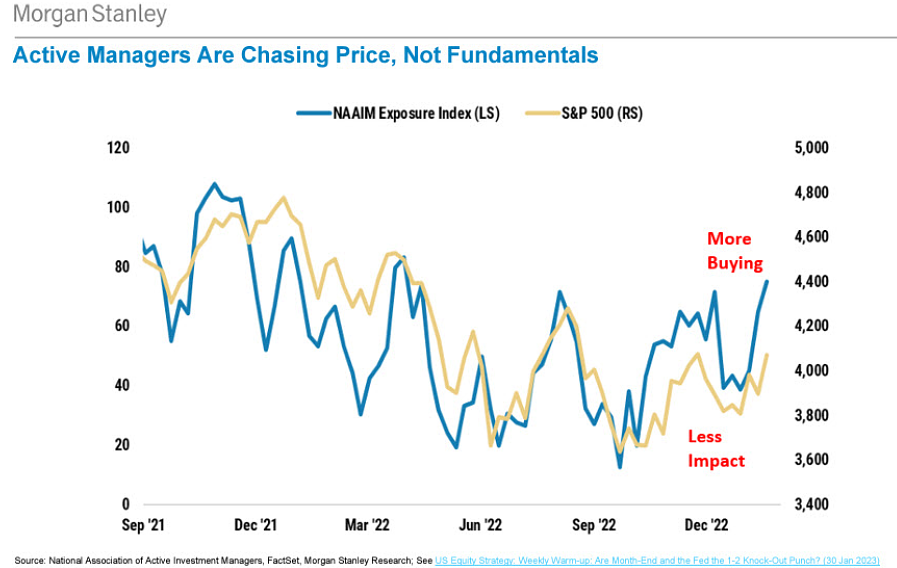 To explain, the blue line above tracks the National Association of Active Investment Managers’ (NAAIM) net exposure, while the gold line above tracks the S&P 500. If you analyze the relationship, you can see that registered investment advisors (RIAs) often chase stock rallies because they can’t afford to miss out on bullish performance. Consequently, RIAs’ recent allocation is more about FOMO than fundamentals.
Second, if (when) the S&P 500 suffers its earnings demise, the economic slack that often occurs alongside these events could trigger a volatility spike and push the USD Index to new highs.
Please see below:
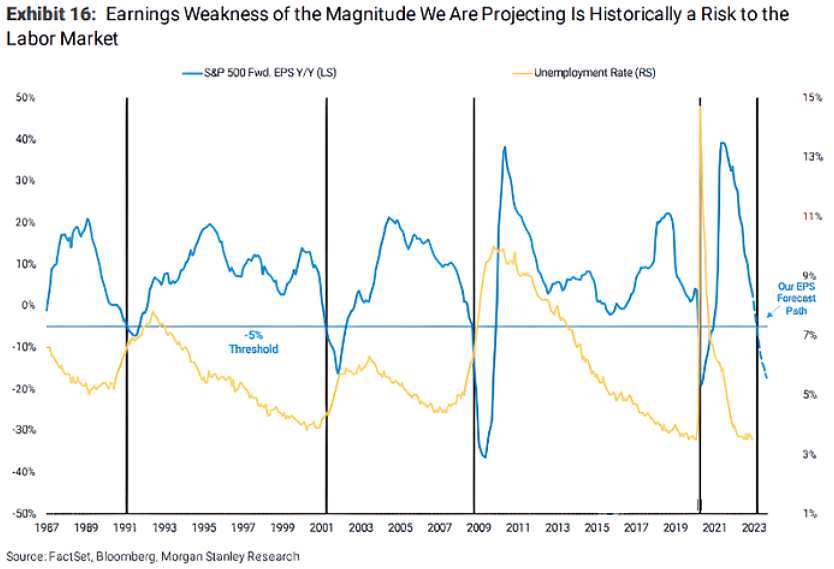
To explain, the blue line above tracks the YoY percentage change in Morgan Stanley’s forward earnings per share (EPS) model, while the gold line above tracks the U.S. unemployment rate. If you analyze the relationship, you can see that sharp YoY declines in S&P 500 EPS often result in major spikes in unemployment. Therefore, the next iteration should be no different, and the volatility could weigh heavily on the silver price.
Please see below:
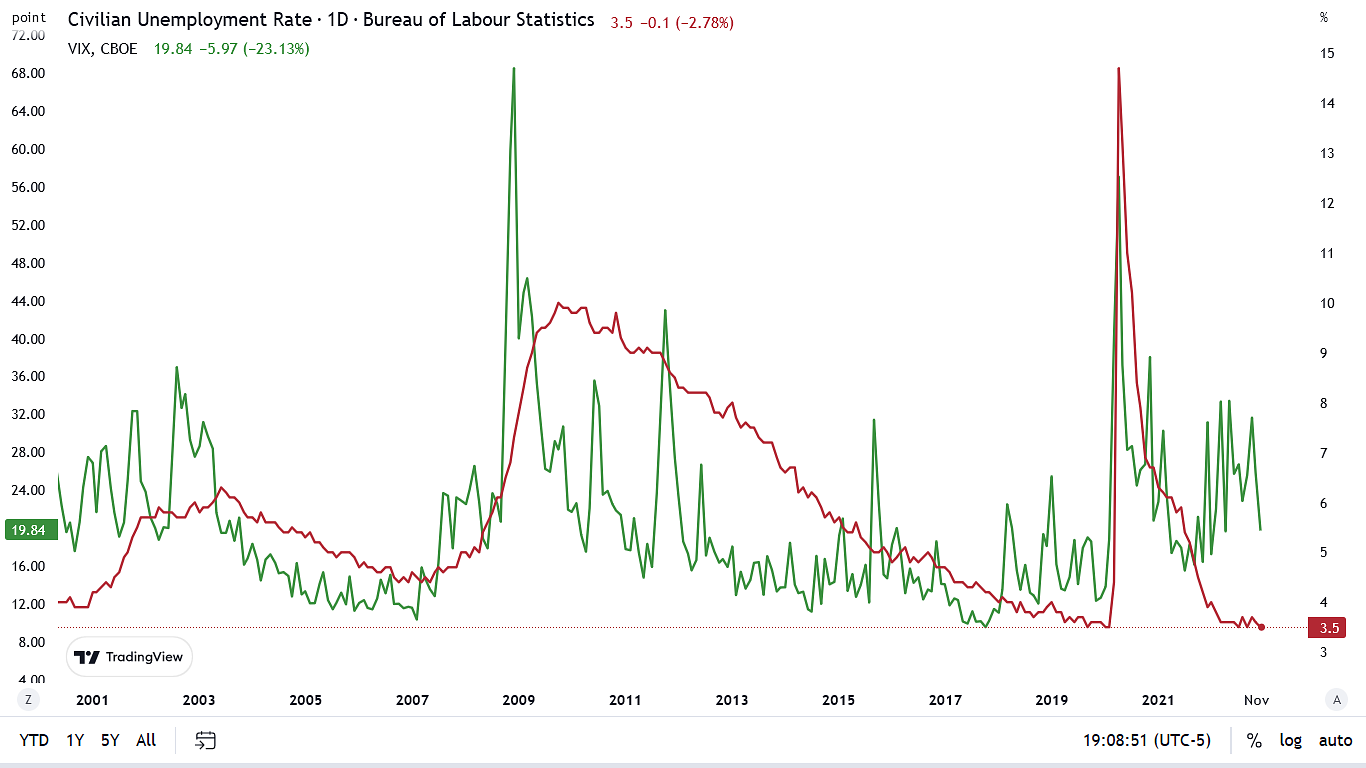 To explain, the red line above tracks the U.S. unemployment rate, while the green line above tracks the Cboe Volatility Index (VIX). As you can see, the last three spikes in unemployment coincided with panic bids for the VIX; and with the USD Index often a significant beneficiary when crises erupt, a rate-hike-induced reset of the U.S. labor market could haunt silver over the medium term.
Overall, there are so many moving parts this week that the short-term outlook is unclear. However, the fundamentals continue to support higher interest rates, and the loosening of financial conditions has only made inflation worse. As a reminder, Bridgewater Associates co-CIO Bob Prince summarized the argument on Jan. 6. We wrote on Jan. 17:
5%+ wage inflation is not consistent with 2% output inflation; and while we have warned about this for many months, the ramifications are far from priced in. As a result, the crowds’ disdain for the details should upend several risk assets, including gold, silver and mining stocks, in the months ahead.
 All in all, a profound shift in sentiment should occur over the medium term, and silver should trade materially below $24 before it’s all said and done.
Are investors wrong to ‘fight the Fed?’ What do you think drove the recent equity rally? How will silver respond if Wilson’s prediction proves prescient?
The Bottom Line
Sentiment should be all over the place this week, and it’s difficult to draw a conclusion from one day’s events. In other words, what mattered today may not matter tomorrow once a new narrative develops. But, our medium-term expectations remain on track, as very few of the conditions required to curb inflation have been met. Likewise, with the U.S. housing market ramping up again, the one area of the economy where the FOMC made substantial progress has now reversed. Therefore, we expect more hawkish fireworks in the months ahead.
In conclusion, the PMs were mixed on Jan. 30, as mining stocks underperformed once again. Moreover, the USD Index continues to form a bottom alongside real yields and the financial conditions index, and we expect all three to hit new highs before this bear market ends.
See less
Overview of the Upcoming Part of the Decline
- It seems to me that the corrective upswing is over (or about to be over) and that the next big move lower is already underway (or that it’s about to start).
- If we see a situation where miners slide in a meaningful and volatile way while silver doesn’t (it just declines moderately), I plan to – once again – switch from short positions in miners to short positions in silver. At this time, it’s too early to say at what price levels this could take place and if we get this kind of opportunity at all – perhaps with gold prices close to $1,500 - $1,550.
- I plan to switch from the short positions in junior mining stocks or silver (whichever I’ll have at that moment) to long positions in junior mining stocks when gold / mining stocks move to their 2020 lows (approximately). While I’m probably not going to write about it at this stage yet, this is when some investors might consider getting back in with their long-term investing capital (or perhaps 1/3 or 1/2 thereof).
- I plan to return to short positions in junior mining stocks after a rebound – and the rebound could take gold from about $1,450 to about $1,550, and it could take the GDXJ from about $20 to about $24. In other words, I’m currently planning to go long when GDXJ is close to $20 (which might take place when gold is close to $1,450), and I’m planning to exit this long position and re-enter the short position once we see a corrective rally to $24 in the GDXJ (which might take place when gold is close to $1,550).
- I plan to exit all remaining short positions once gold shows substantial strength relative to the USD Index while the latter is still rallying. This may be the case with gold prices close to $1,400 and GDXJ close to $15 . This moment (when gold performs very strongly against the rallying USD and miners are strong relative to gold after its substantial decline) is likely to be the best entry point for long-term investments, in my view. This can also happen with gold close to $1,400, but at the moment it’s too early to say with certainty.
- The above is based on the information available today, and it might change in the following days/weeks.
You will find my general overview of the outlook for gold on the chart below:
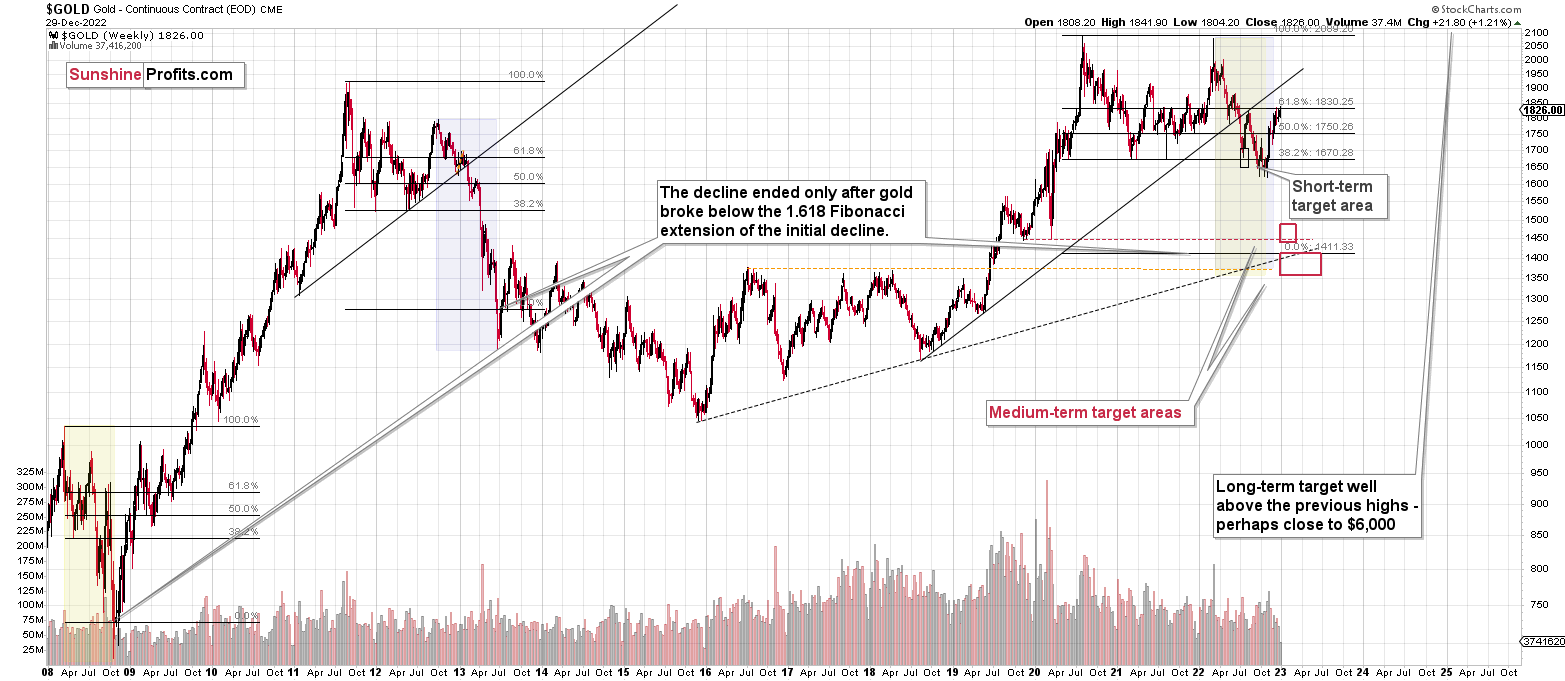
Please note that the above timing details are relatively broad and “for general overview only” – so that you know more or less what I think and how volatile I think the moves are likely to be – on an approximate basis. These time targets are not binding nor clear enough for me to think that they should be used for purchasing options, warrants, or similar instruments.
Letters to the Editor
We received a few messages over e-mail, but as we are moving to our new Golden Meadow platform, we will be transferring them below the articles as comments – and that’s where we’ll be replying to them.
On the platform, please ask your questions below the articles or in the spaces called “Ask the Community” or “Position Sizes” directly – it will help us deliver a reply sooner. In some cases, someone from the community might reply and help even before we do.
Please remember about the Pillars of our Community, especially about the Kindness of Speech Pillar.
Also, if there’s anything that you’re unhappy with, it’s best to send us a message at [email protected].
Please note that this section is going to go away within the next 1-8 weeks, as you can add comments/questions below the article on Golden Meadow – the platform that we’re using to provide our analyses. Your notification e-mails include an invitation link that allows you to access the “Gold Trading Alerts” space.
Also, if you haven’t had the chance to see the video, in which I’m talking about the new platform and why we essentially moved from Sunshine Profits to Golden Meadow, I strongly encourage you to do so:
Summary
Summing up, it seems that the major bottom in the USD Index is in, while the correction in stocks, gold, silver, and mining stocks is over or very close to being over.
The nature of the recent corrections was mostly technical and rumor-based. The rumor was that the Fed would be making a dovish U-turn soon, and it recently became clear that this was not going to be the case. Consequently, the corrective upswing is likely to be reversed, and medium-term downtrends are likely to resume.
In my opinion, the current trading position is going to become profitable in the following weeks, and quite possibly in the following days. And while I can’t promise any kind of performance, I fully expect it to become very profitable before it’s over and to prolong our 2022 winning streak.
After the final sell-off (that takes gold to about $1,350-$1,500), I expect the precious metals to rally significantly. The final part of the decline might take as little as 1-5 weeks, so it's important to stay alert to any changes.
As always, we'll keep you – our subscribers – informed.
To summarize:
Trading capital (supplementary part of the portfolio; our opinion): Full speculative short positions (300% of the full position) in junior mining stocks are justified from the risk to reward point of view with the following binding exit profit-take price levels:
Mining stocks (price levels for the GDXJ ETF): binding profit-take exit price: $20.32; stop-loss: none (the volatility is too big to justify a stop-loss order in case of this particular trade)
Alternatively, if one seeks leverage, we’re providing the binding profit-take levels for the JDST (2x leveraged). The binding profit-take level for the JDST: $22.87; stop-loss for the JDST: none (the volatility is too big to justify a SL order in case of this particular trade).
For-your-information targets (our opinion; we continue to think that mining stocks are the preferred way of taking advantage of the upcoming price move, but if for whatever reason one wants / has to use silver or gold for this trade, we are providing the details anyway.):
Silver futures downside profit-take exit price: $14.32
SLV profit-take exit price: $13.42
ZSL profit-take exit price: $48.87
Gold futures downside profit-take exit price: $1,504
HGD.TO – alternative (Canadian) 2x inverse leveraged gold stocks ETF – the upside profit-take exit price: $16.47
HZD.TO – alternative (Canadian) 2x inverse leveraged silver ETF – the upside profit-take exit price: $36.87
Long-term capital (core part of the portfolio; our opinion): No positions (in other words: cash)
Insurance capital (core part of the portfolio; our opinion): Full position
Whether you’ve already subscribed or not, we encourage you to find out how to make the most of our alerts and read our replies to the most common alert-and-gold-trading-related-questions.
Please note that we describe the situation for the day that the alert is posted in the trading section. In other words, if we are writing about a speculative position, it means that it is up-to-date on the day it was posted. We are also featuring the initial target prices to decide whether keeping a position on a given day is in tune with your approach (some moves are too small for medium-term traders, and some might appear too big for day-traders).
Additionally, you might want to read why our stop-loss orders are usually relatively far from the current price.
Please note that a full position doesn't mean using all of the capital for a given trade. You will find details on our thoughts on gold portfolio structuring in the Key Insights section on our website.
As a reminder - "initial target price" means exactly that - an "initial" one. It's not a price level at which we suggest closing positions. If this becomes the case (as it did in the previous trade), we will refer to these levels as levels of exit orders (exactly as we've done previously). Stop-loss levels, however, are naturally not "initial", but something that, in our opinion, might be entered as an order.
Since it is impossible to synchronize target prices and stop-loss levels for all the ETFs and ETNs with the main markets that we provide these levels for (gold, silver and mining stocks - the GDX ETF), the stop-loss levels and target prices for other ETNs and ETF (among other: UGL, GLL, AGQ, ZSL, NUGT, DUST, JNUG, JDST) are provided as supplementary, and not as "final". This means that if a stop-loss or a target level is reached for any of the "additional instruments" (GLL for instance), but not for the "main instrument" (gold in this case), we will view positions in both gold and GLL as still open and the stop-loss for GLL would have to be moved lower. On the other hand, if gold moves to a stop-loss level but GLL doesn't, then we will view both positions (in gold and GLL) as closed. In other words, since it's not possible to be 100% certain that each related instrument moves to a given level when the underlying instrument does, we can't provide levels that would be binding. The levels that we do provide are our best estimate of the levels that will correspond to the levels in the underlying assets, but it will be the underlying assets that one will need to focus on regarding the signs pointing to closing a given position or keeping it open. We might adjust the levels in the "additional instruments" without adjusting the levels in the "main instruments", which will simply mean that we have improved our estimation of these levels, not that we changed our outlook on the markets. We are already working on a tool that would update these levels daily for the most popular ETFs, ETNs and individual mining stocks.
Our preferred ways to invest in and to trade gold along with the reasoning can be found in the how to buy gold section. Furthermore, our preferred ETFs and ETNs can be found in our Gold & Silver ETF Ranking.
As a reminder, Gold & Silver Trading Alerts are posted before or on each trading day (we usually post them before the opening bell, but we don't promise doing that each day). If there's anything urgent, we will send you an additional small alert before posting the main one.
Thank you.
Przemyslaw K. Radomski, CFA
Founder, Editor-in-chief

