

Briefly: in our opinion, full (200% of the regular size of the position) speculative short positions in gold, silver and mining stocks are justified from the risk/reward perspective at the moment of publishing this alert.
Whoa, that was a tricky one! At one moment yesterday’s session looked like a clear reversal in gold, silver and mining stocks. But, before the session was over, the clarity remained only the in case of the yellow metal. It would have been be extremely unlikely for only one part of the precious metals sector to rally while the rest continued to decline. Should one trust gold’s reversal, as it’s the most prominent part of the PM sector, or should one go with the majority, which suggests that not much happened? Was that a reversal for the entire precious metals sector or not?
Likely not. But that’s not the most important question and answer. The most important question is if it’s worth acting on what happened, and in this case, the reply is clearer – no way. At least not based on what we saw yesterday. Even if we are going to see a counter-trend rally from here, it’s likely to be rather temporary and not significant. But, if we don’t see a rally, we could see a sharp slide much lower (well below $1,200). It doesn’t seem that taking profits off the table is justified in such a risk-to-reward case.
Let’s take a look at the details. This time, we’ll start with the forex section and the USD Index chart (charts courtesy of http://stockcharts.com).
USD’s Tricky Reversal
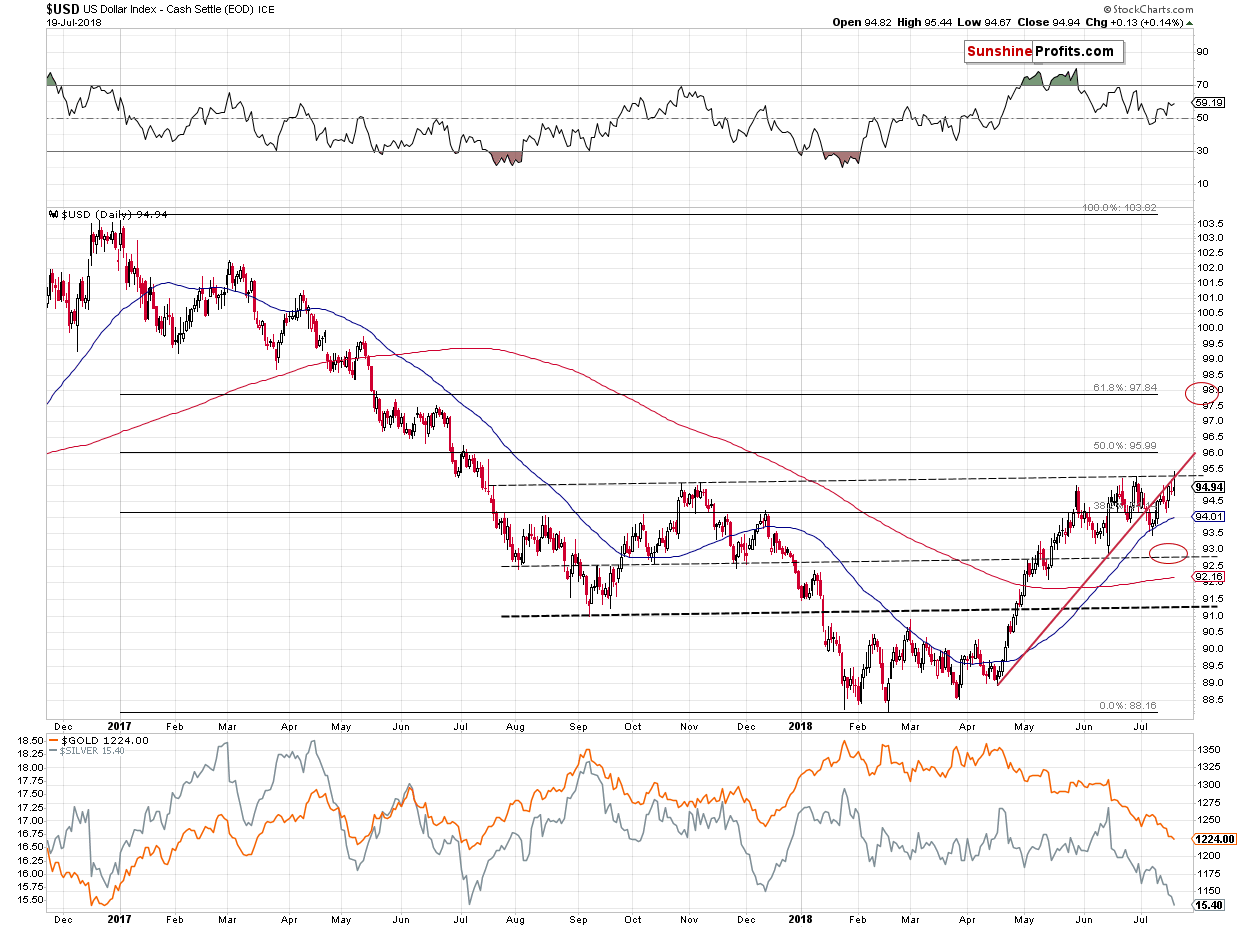
The USD Index rallied yesterday, but before the day was over, it moved back below the previous highs and the rising red support / resistance line. This is confirmed by data provided by both Stockcharts and finance.yahoo.com, so it seems reliable.
The invalidation of two breakouts is a bearish phenomenon on its own, especially when the daily session is a shooting star candlestick. That’s a classic and strong bearish combination.
But, the USD Index is… Well, and index, and it’s important to keep in mind the situations in the currencies that are included in it. The key technical action seems to have happened in the Japanese yen and it’s not as critical as the USDX reversal makes it seem.
Before moving to the Japanese currency, let’s put the USD Index’s moves into perspective.
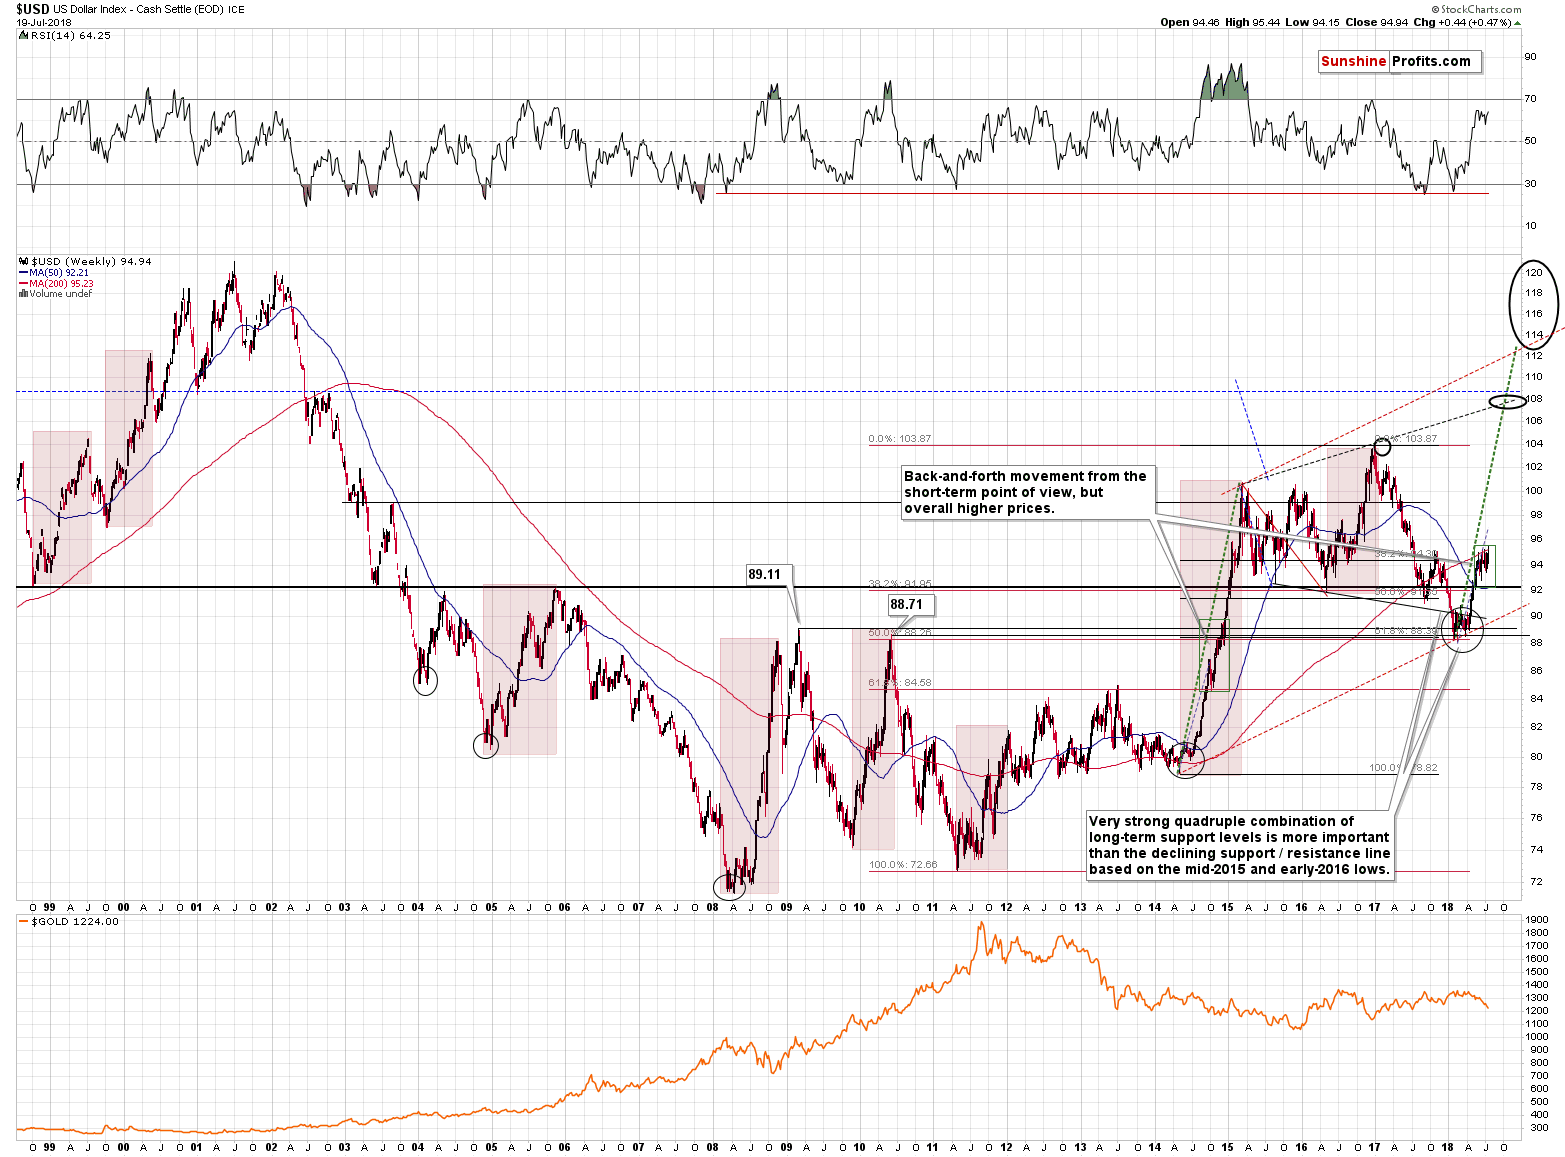
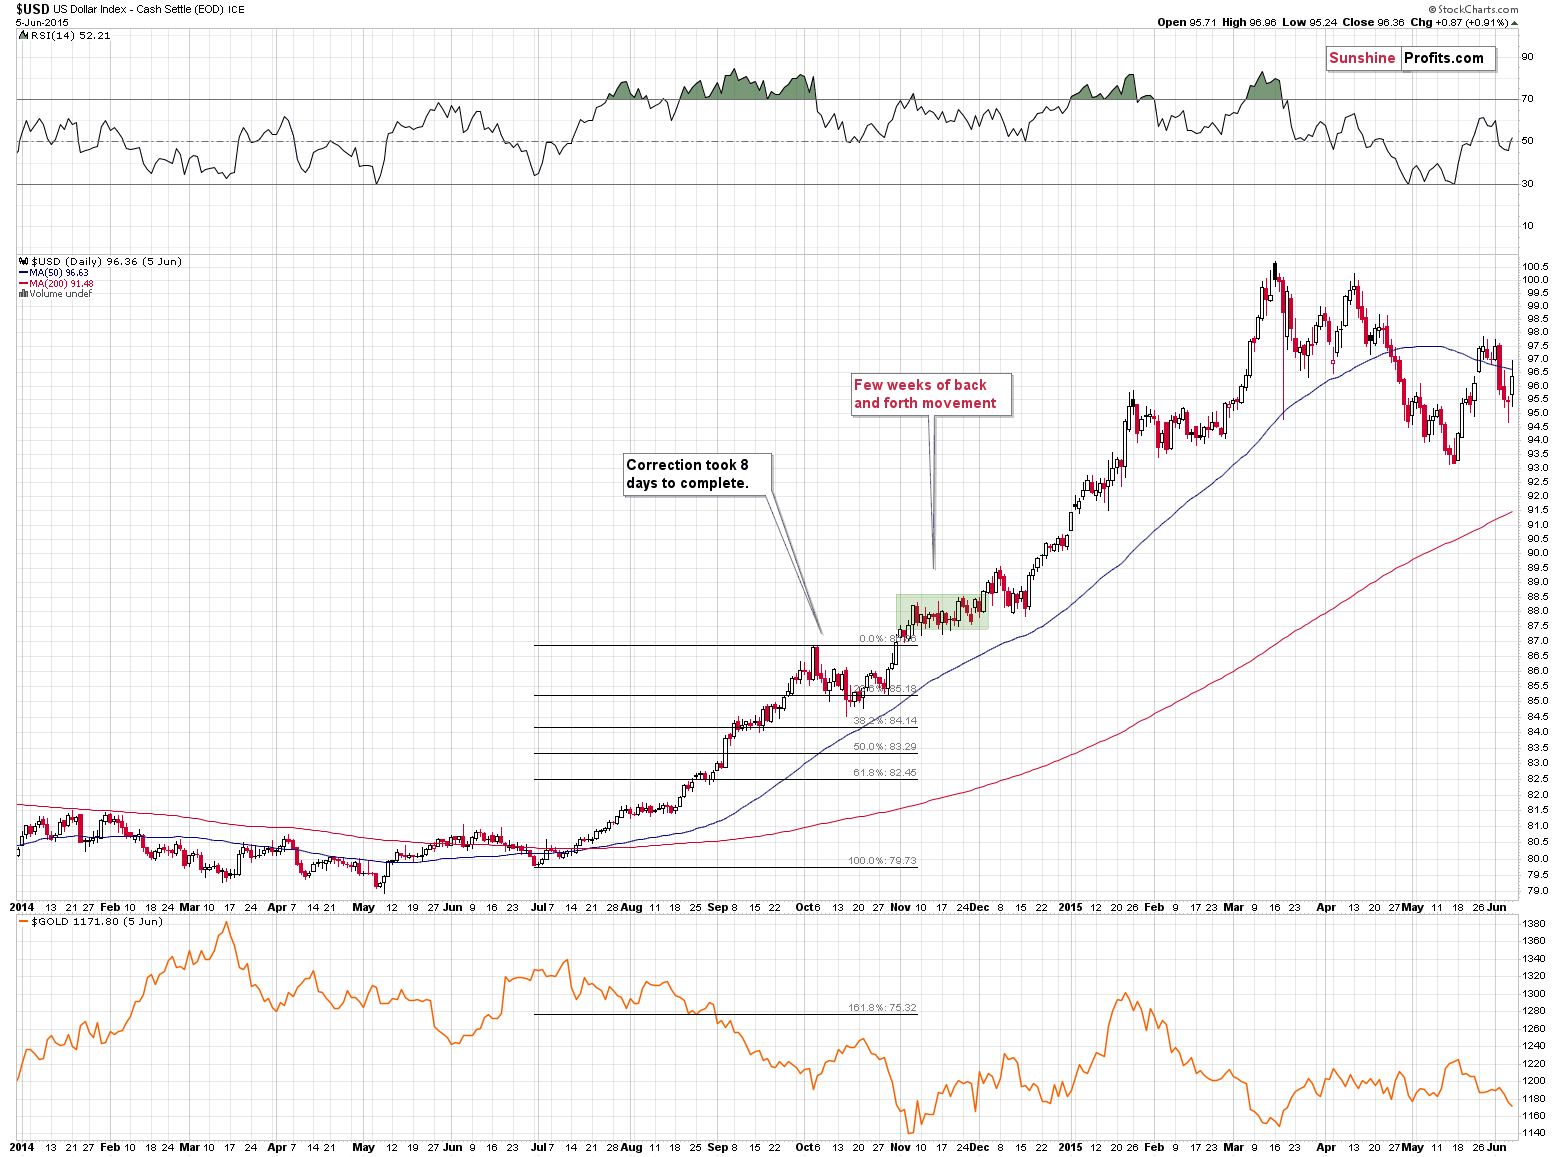
The important detail is that the current back and forth movement with a bullish trend is something that’s in tune with what we saw during the previous major rally in the U.S. currency (2014-2015). Naturally, the moves are not 100% identical, but they share so many similarities that one can expect the moves to play out in a similar manner in the future as well. This will remain likely until we see big deviations from the analogy. We haven’t seen them so far.
On the long-term chart you can see that the USDX paused the decline somewhat between one third and one half of the rally, but overall kept on climbing and it seems that we’re seeing something similar since late-May. The key detail here is that gold is declining even without the USD’s rally. This means that once the USD rally is back with full force, gold is likely to truly plunge.
Having said that, let’s take a look at the Japanese yen.
Yen’s Pause
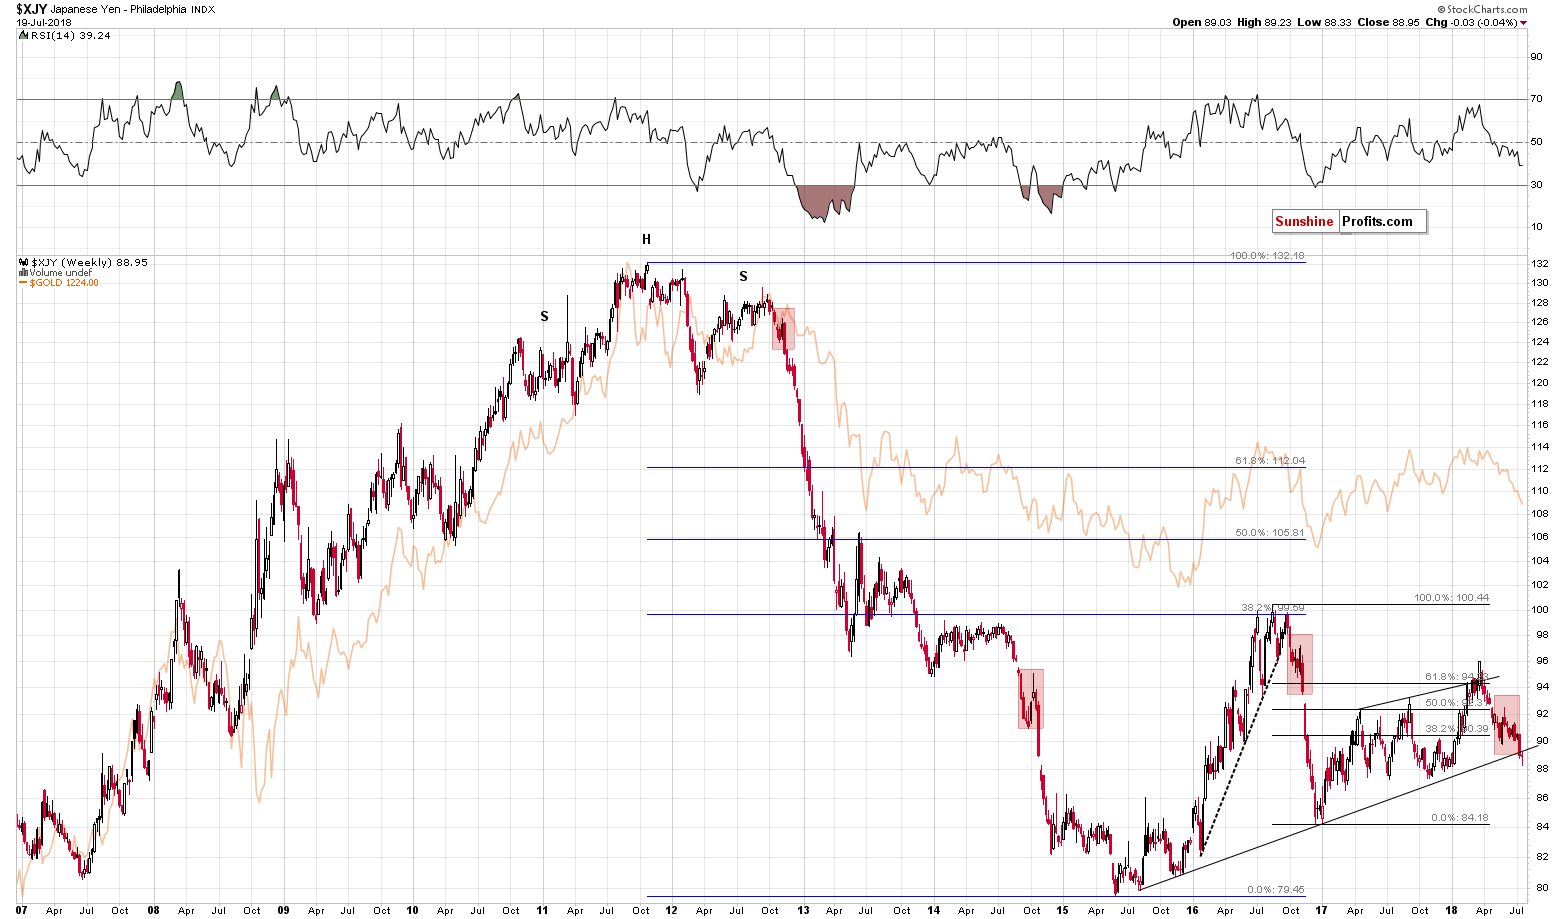
The Japanese yen (USD/JPY) has recently broken below a key long-term support line and its now verifying this breakdown. Consequently, the currency could move higher in the very short term, but the rising long-term support/resistance line marks the likely end of the decline.
Why is an invalidation unlikely? Because of the similarity of the preceding action to the three cases from the past few years – they were all followed by sharp declines without meaningful upswings beforehand. We marked them with red rectangles.
When using charts based on the logarithmic scale (as the one above), the mentioned long-term support/resistance line is at about 89.5.
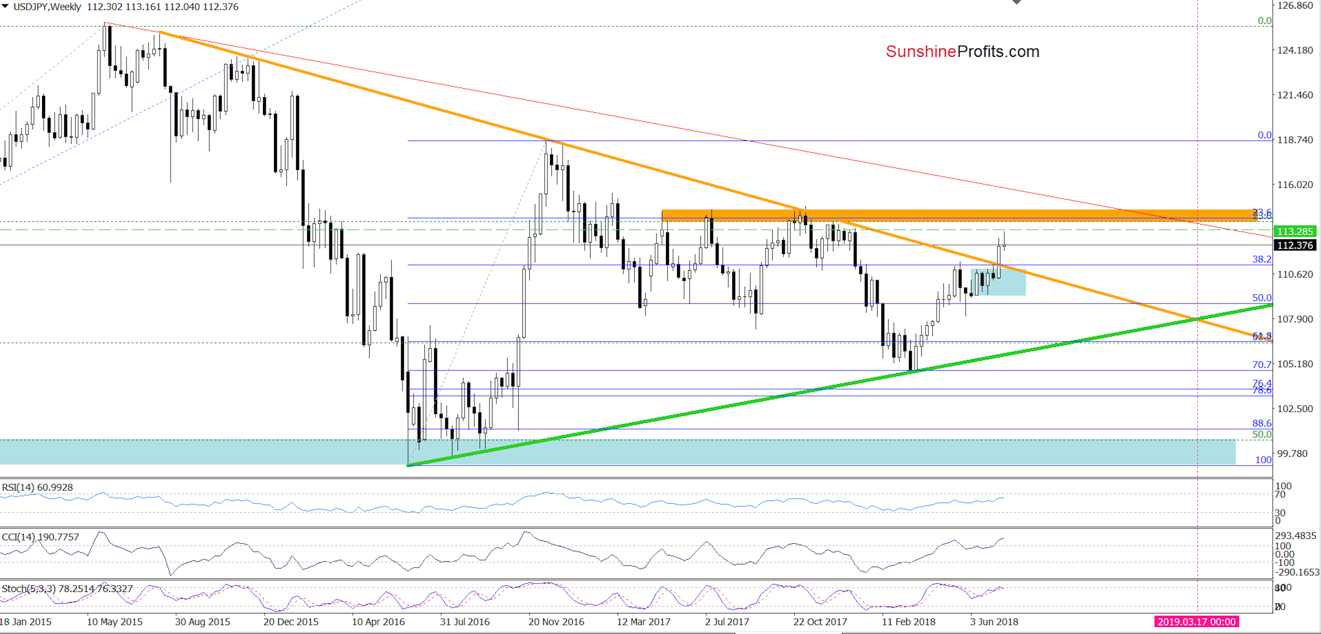
But, when using the linear scale, this line (marked with orange) is still relatively far. We could see a bit more than a repeat of yesterday’s intraday action before the correction is over.
By the way, the above chart is inverted, because it features the same currency exchange rate from the other perspective (JPY/USD, while the previous chart featured USD/JPY). We are generally using USD/JPY in the Gold & Silver Trading Alerts, because it’s easier to compare the currency’s price with the one of gold if they move in the same direction; and we are using the USD/JPY pair in our Forex Trading Alerts as that’s how this currency exchange rate is usually traded on its own.
So, on average, we might – at best – expect another daily move that’s a bit bigger than what we saw yesterday. It may be a lot in the case of short-term oriented forex trades, but when discussing the possible impact on the precious metals sector, it doesn’t seem that significant, because of all the other factors that point to much lower PM prices in the following weeks and months.
In the previous Alerts, we emphasized that based on the proximity to the apex of the triangle, we might see a short-term reversal and that it’s unlikely to be a big deal. So far, we’re seeing exactly that.
Keeping the above in mind, let’s take a look at yesterday’s action in gold, silver and mining stocks.
Gold’s Clear Reversal
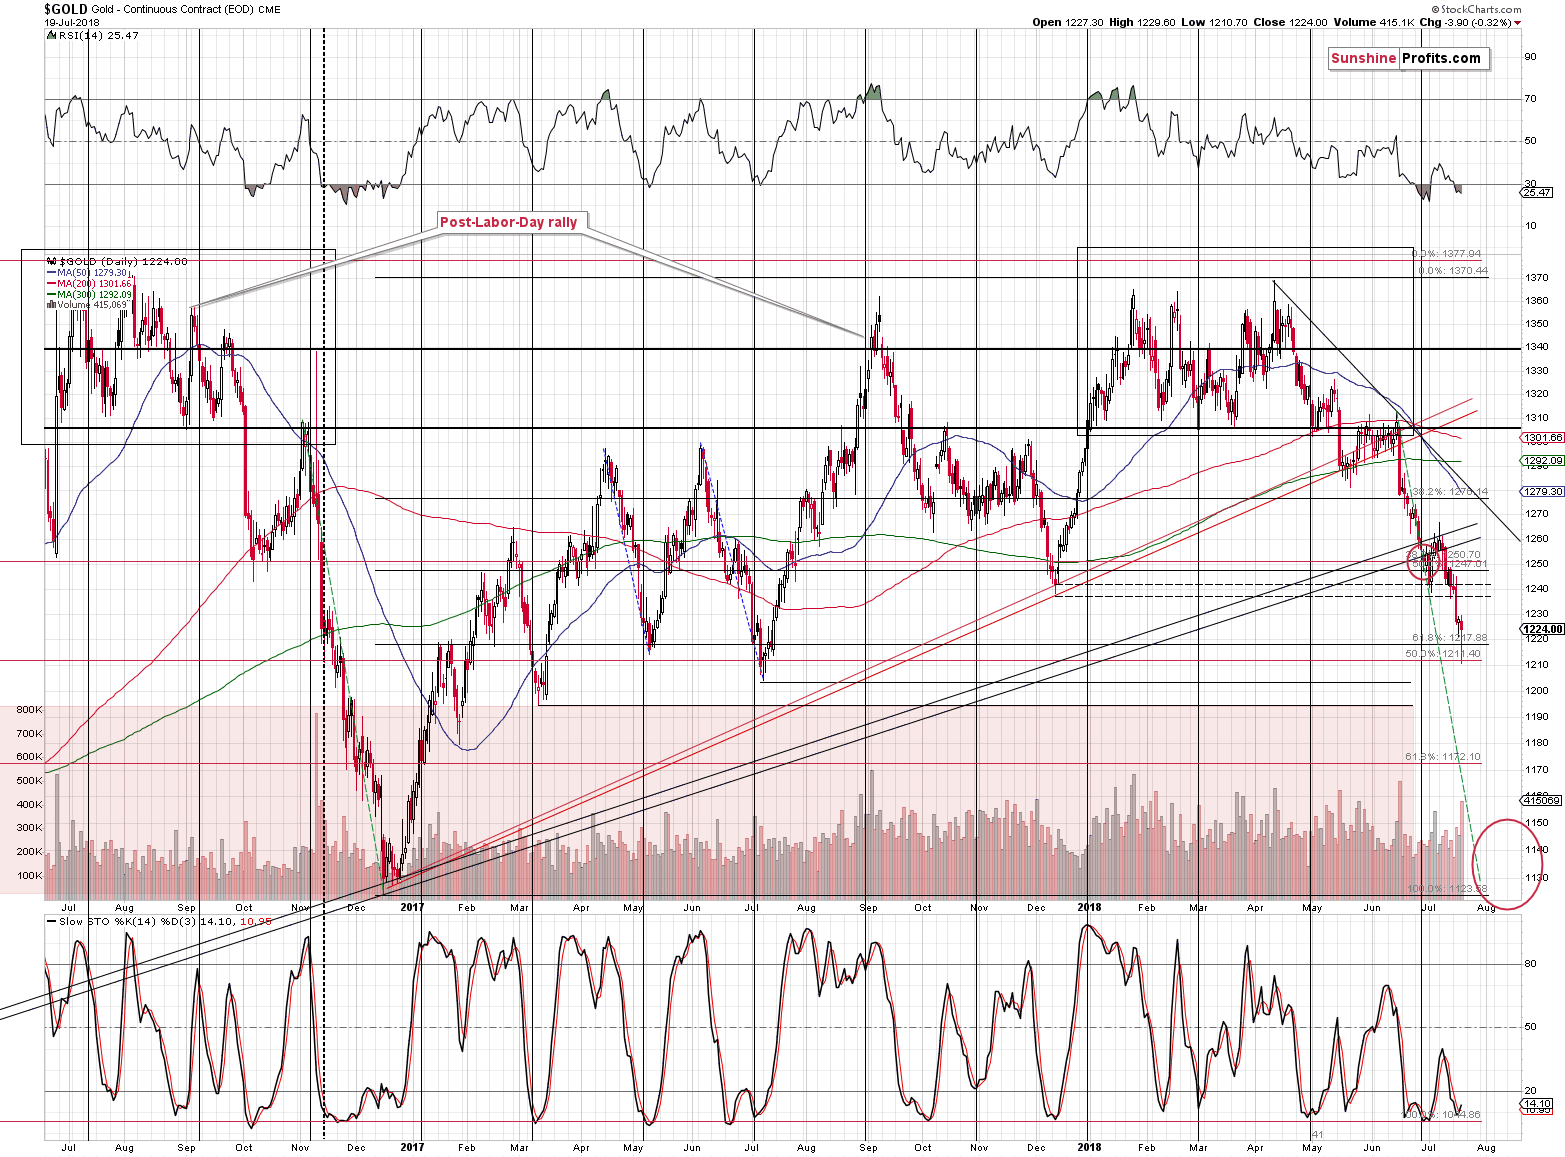
Gold reversed on significant volume after moving temporarily to two Fibonacci retracements and the May and July 2017 lows. That’s a classic buy signal.
Let’s assume, for a minute, that we’re going to get a rally from here. How high would it be likely to take gold? If the yen might – at most – move by as much as it did yesterday on an intraday basis and then a bit more, then perhaps we might see something similar in gold.
Given the nearby resistance levels, this means that gold could simply move back to the early July 2018 bottom or the December 2017 bottom – to about $1,240. A bit more above this level if we focus on the analogy to the yen, and a bit less if we consider the fact that during the previous (early July) corrective upswing the initial rally (which took place on July 3rd) was actually most of the entire corrective upswing in gold.
Is a $15 upswing really worth taking the risk of missing out on profits from a huge slide in prices (below $1,200, perhaps even to $1,130)? No. That’s why we’ll stick to the current short position despite the classic buy signal. This is a technical blasphemy, but taking the bigger picture into account, it seems to be a justified one.
But silver confirmed the reversal!
Silver’s Reversal
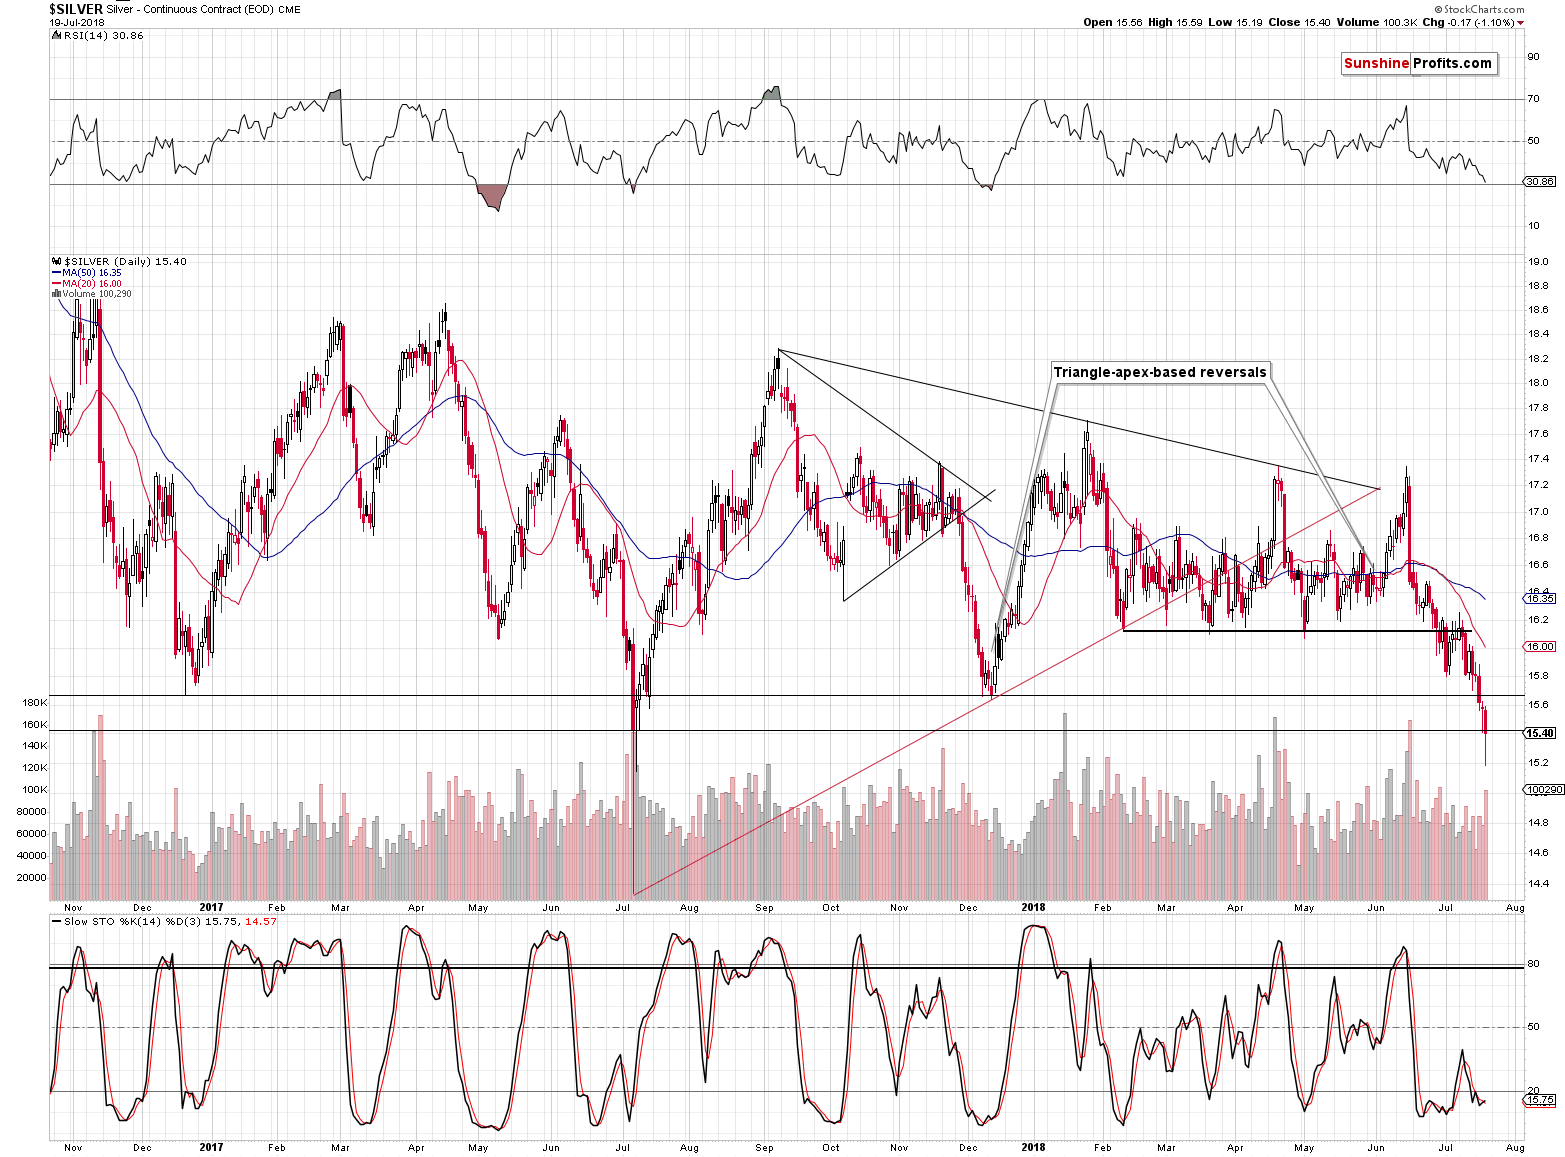
That’s debatable. Silver reversed on an intraday basis, but it also declined visibly in terms of daily closing prices and during true reversals we shouldn’t see visible declines. A small decline overall is fine, but an almost $0.20 one seems to be too much, especially that based on kitcosilver.com’s prices yesterday’s decline was actually $0.24.
Moreover, please note that silver has actually broken below the previous 2017 low in terms of the closing prices. The lowest closing price of 2017 is $15.43 and no matter if we consider Stockcharts’ data or kitcosilver.com’s data, we still get a breakdown.
Consequently, instead of being viewed as a reversal, yesterday’s session could be viewed as a breakdown on sizable volume that was followed by a correction back to the previously broken level. Since silver closed below it, the implications are bearish.
Ok, so maybe the metals won’t rally much, but what about the miners? They rallied substantially and we profited on this rally. Why don’t we repeat that?
Mining Stocks’ Weakness
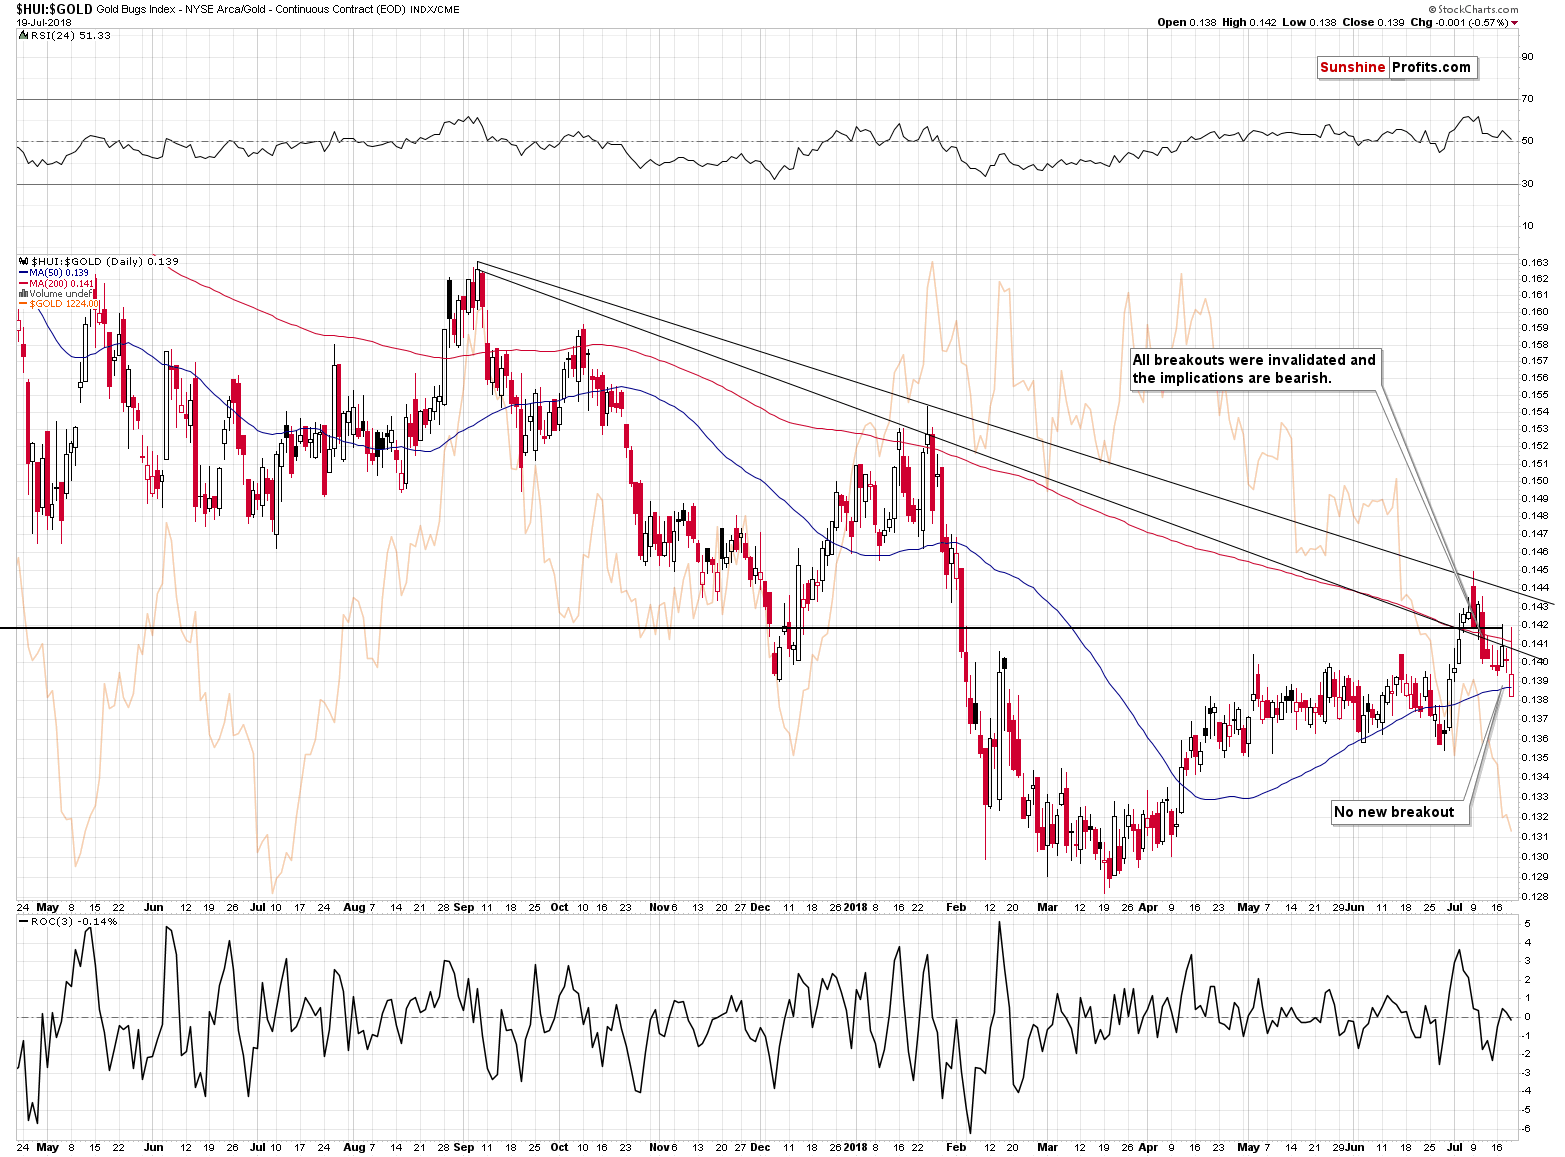
We are not likely to repeat that because a few weeks ago miners to gold ratio had room to rally and now it doesn’t. The ratio moved back below the previous resistance levels, invalidating all temporary breakouts. This has bearish, not bullish implications and it seems that we already saw the results yesterday.
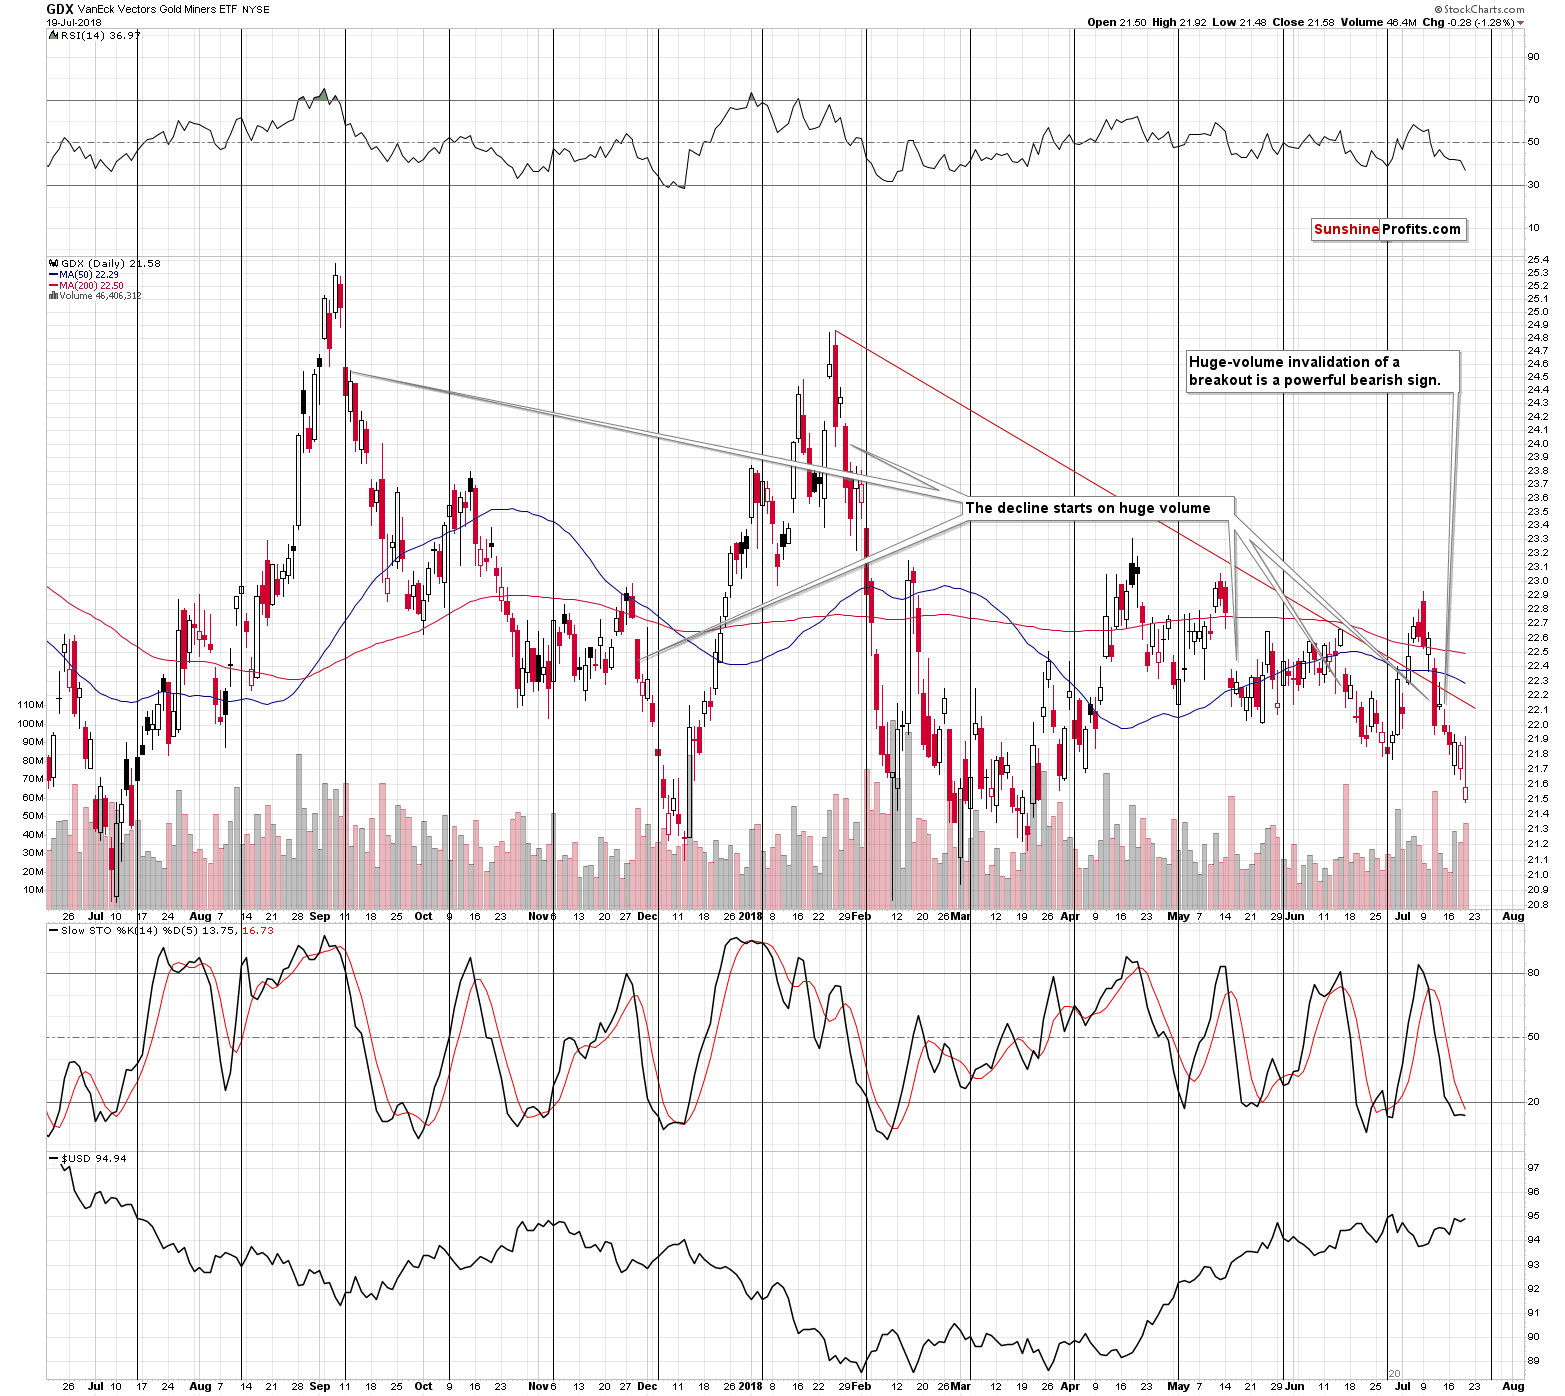
Gold reversed in a profound manner, but mining stocks didn’t. In fact, GDX closed the session only 10 cents above its intraday low. That’s a sign of weakness, not strength that would confirm a bullish reversal.
The intraday performance was particularly interesting yesterday. Miners declined along with gold and then they moved higher along with it – even moving above the previous day’s closing price. And just as most traders thought that the outlook for the PMs reversed… It all changed. Gold declined a few dollars and mining stocks gave up most of the entire intraday upswing. It looked as if the buyers run out of capital or simply gave up, giving in to the overwhelming power of the sellers.
Yesterday’s session, therefore, has bearish implications, not bullish ones.
Having said that, let’s move to something that seems to have gone under the radar.
Platinum’s Breakdown
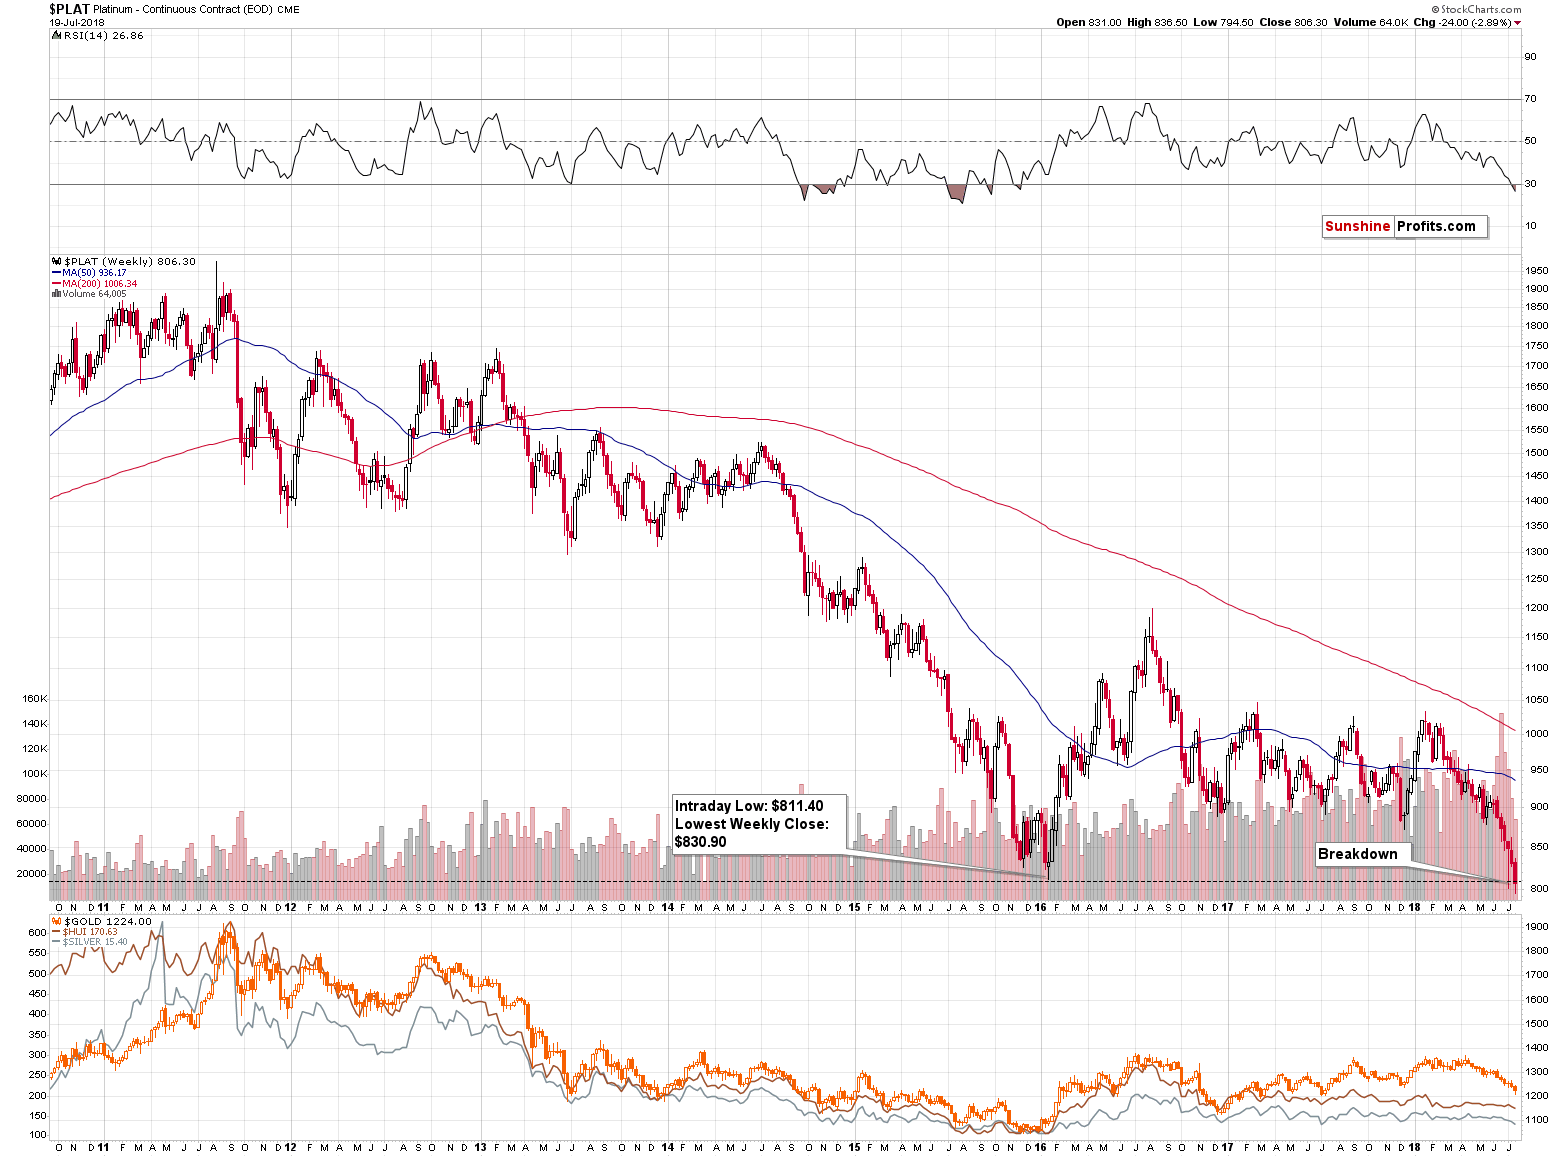
When platinum plunged more than two weeks ago, it did so on significant volume and based on geopolitical news (we commented on it extensively in the July 3rd Alert) it looked very unstable and a corrective rally was extremely likely. And we saw it. But the rally that was likely to happen based on it has already taken place and platinum returned to its medium-term downtrend.
During yesterday’s session it moved (and closed) below the previous lows. This time, it was rather quiet – the volume was average and there was no direct news that would cause the decline. This makes us think that this time the breakdown will be successful. Naturally, we would prefer to wait for additional two daily closes below the previous lows and a weekly close, but the mentioned circumstances make a confirmation of the breakdown quite likely.
A slide in platinum – and one would likely follow a confirmation of the breakdown – is likely to translate into declines in the rest of the precious metals sector.
Before summarizing, we would like to show you something that should make it clear why trying to catch each and every corrective upswing in gold is currently a bad idea.
It’s the analogy to what happened in 2013.
Gold’s 2013 Analogy
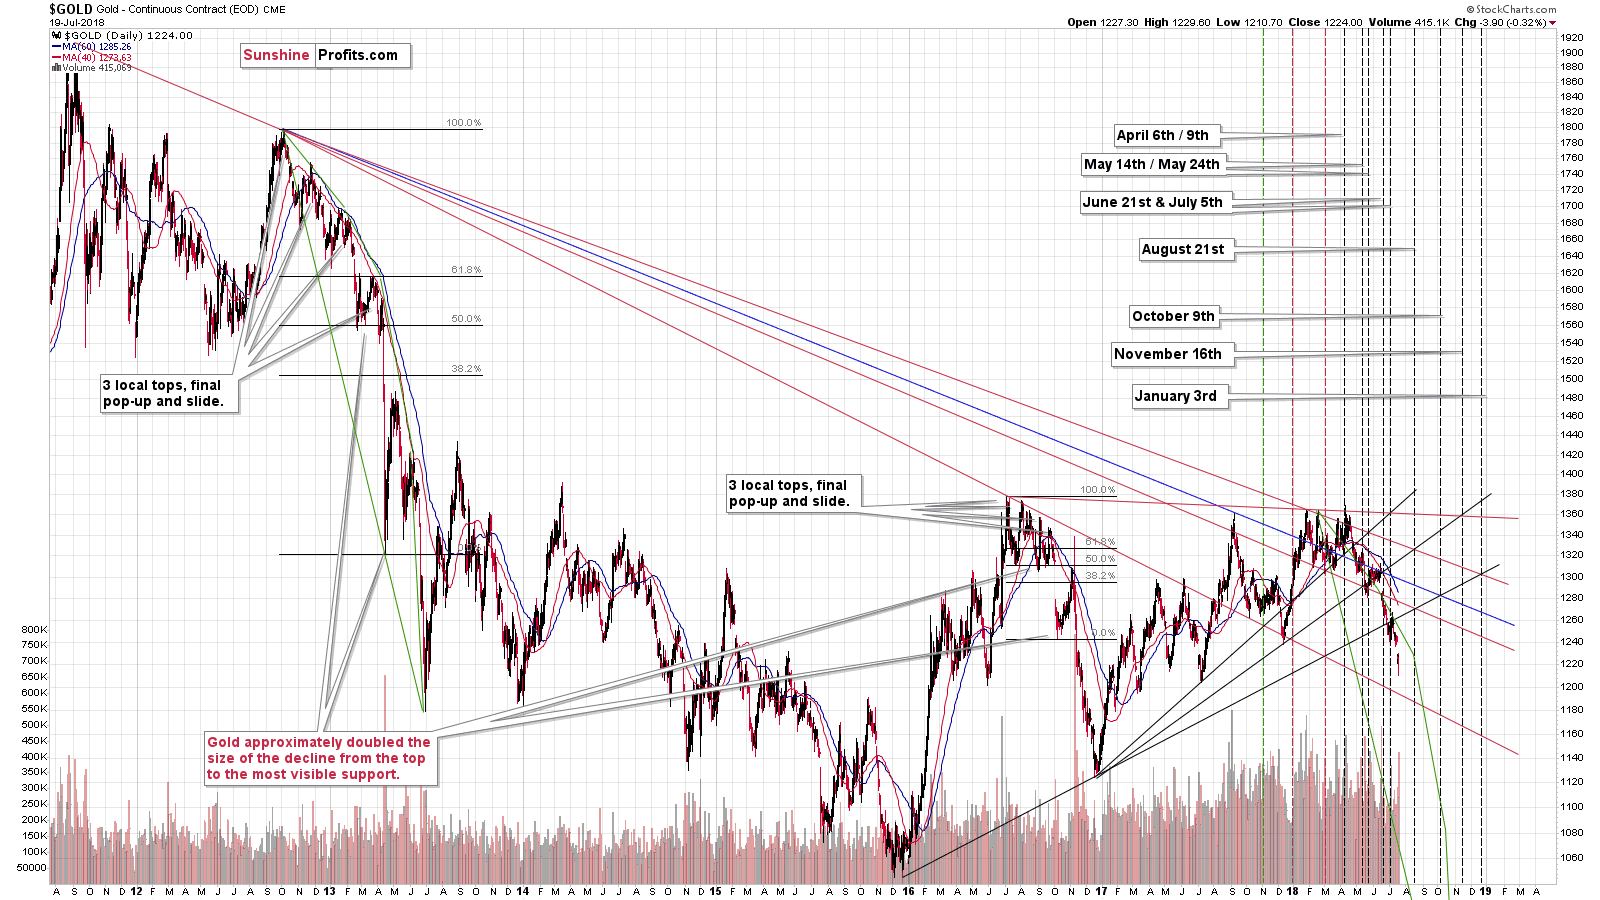
We don’t want to go into the details as to why the current situation is similar to the 2012 – 2013 decline as we’ve done in the previous Alerts (it was some time ago, so we will get back to this topic once again, but not today as, if we did, we would not be able to deliver the Alert in a timely manner). We want to focus on the implications.
The implications are represented by the green lines – they show how gold performed during the previous decline. The bow-like pattern is created based on gold’s highs during the decline and based on the line connecting the final pre-decline top and the final medium-term bottom.
In 2012 and in early 2013, there was back and forth action – that was the early part of the decline. It all changed very fast and gold declined from the upper part of the bow pattern, right to its bottom part – that was the initial April bottom. Saying that gold could decline $200 in a day, or a week may seem crazy right now, but that’s exactly what happened several years ago; and it can happen again. The move of this magnitude would surely erase any long position that we might have and there would be very little time to react and open a short position (or none at all if the move took place overnight).
Is it a good idea to risk missing at $200 move (or even a $100 or $50 one) for a chance to profit on a $15 rally (assuming being able to exit close to the top, which may not be the case if the move takes place overnight)? Absolutely not.
That’s why we are so reluctant to adjust the short positions unless there is a powerful combination of bullish signals. And it’s also why we may ignore very short-term upswings in the near future – it’s simply a part of the strategy.
Summary
Summing up, the outlook for the precious metals is extremely bearish for the following weeks and months, and it’s not bullish enough for the short term to justify adjusting the current short positions.
The extra-large short positions in gold, silver, and mining stocks are definitely justified from the risk to reward point of view. It’s likely that the profits on the short position that we had opened only several days ago will increase much more before this trade is over, even if they correct temporarily first.
As always, we’ll keep you – our subscribers – informed.
To summarize:
Trading capital (supplementary part of the portfolio; our opinion): Full short positions (200% of the full position) in gold, silver and mining stocks are justified from the risk/reward perspective with the following stop-loss orders and initial target price levels:
- Gold: initial target price: $1,142; stop-loss: $1,272; initial target price for the DGLD ETN: $63.96; stop-loss for the DGLD ETN $46.38
- Silver: initial target price: $14.42; stop-loss: $16.46; initial target price for the DSLV ETN: $32.97; stop-loss for the DSLV ETN $24.07
- Mining stocks (price levels for the GDX ETF): initial target price: $19.12; stop-loss: $23.64; initial target price for the DUST ETF: $37.97; stop-loss for the DUST ETF $20.87
In case one wants to bet on junior mining stocks' prices (we do not suggest doing so – we think senior mining stocks are more predictable in the case of short-term trades – but if one wants to do it anyway, we provide the details), here are the stop-loss details and initial target prices:
- GDXJ ETF: initial target price: $28.10; stop-loss: $34.82
- JDST ETF: initial target price: $74.83 stop-loss: $42.78
Long-term capital (core part of the portfolio; our opinion): No positions (in other words: cash)
Insurance capital (core part of the portfolio; our opinion): Full position
Important Details for New Subscribers
Whether you already subscribed or not, we encourage you to find out how to make the most of our alerts and read our replies to the most common alert-and-gold-trading-related-questions.
Please note that the in the trading section we describe the situation for the day that the alert is posted. In other words, it we are writing about a speculative position, it means that it is up-to-date on the day it was posted. We are also featuring the initial target prices, so that you can decide whether keeping a position on a given day is something that is in tune with your approach (some moves are too small for medium-term traders and some might appear too big for day-traders).
Plus, you might want to read why our stop-loss orders are usually relatively far from the current price.
Please note that a full position doesn’t mean using all of the capital for a given trade. You will find details on our thoughts on gold portfolio structuring in the Key Insights section on our website.
As a reminder – “initial target price” means exactly that – an “initial” one, it’s not a price level at which we suggest closing positions. If this becomes the case (like it did in the previous trade) we will refer to these levels as levels of exit orders (exactly as we’ve done previously). Stop-loss levels, however, are naturally not “initial”, but something that, in our opinion, might be entered as an order.
Since it is impossible to synchronize target prices and stop-loss levels for all the ETFs and ETNs with the main markets that we provide these levels for (gold, silver and mining stocks – the GDX ETF), the stop-loss levels and target prices for other ETNs and ETF (among other: UGLD, DGLD, USLV, DSLV, NUGT, DUST, JNUG, JDST) are provided as supplementary, and not as “final”. This means that if a stop-loss or a target level is reached for any of the “additional instruments” (DGLD for instance), but not for the “main instrument” (gold in this case), we will view positions in both gold and DGLD as still open and the stop-loss for DGLD would have to be moved lower. On the other hand, if gold moves to a stop-loss level but DGLD doesn’t, then we will view both positions (in gold and DGLD) as closed. In other words, since it’s not possible to be 100% certain that each related instrument moves to a given level when the underlying instrument does, we can’t provide levels that would be binding. The levels that we do provide are our best estimate of the levels that will correspond to the levels in the underlying assets, but it will be the underlying assets that one will need to focus on regarding the signs pointing to closing a given position or keeping it open. We might adjust the levels in the “additional instruments” without adjusting the levels in the “main instruments”, which will simply mean that we have improved our estimation of these levels, not that we changed our outlook on the markets. We are already working on a tool that would update these levels on a daily basis for the most popular ETFs, ETNs and individual mining stocks.
Our preferred ways to invest in and to trade gold along with the reasoning can be found in the how to buy gold section. Additionally, our preferred ETFs and ETNs can be found in our Gold & Silver ETF Ranking.
As a reminder, Gold & Silver Trading Alerts are posted before or on each trading day (we usually post them before the opening bell, but we don't promise doing that each day). If there's anything urgent, we will send you an additional small alert before posting the main one.
=====
Latest Free Trading Alerts:
He did it again. It seems that Powell does not like gold. The price of the yellow metal declined more than 1 percent amid his testimony to the Congress, just as after February’s hearing. What did Powell say?
=====
Hand-picked precious-metals-related links:
PRECIOUS-Gold edges up as U.S. dollar trades below 1-year highs
WGC ‘optimistic’ about gold’s H2 performance
Bitcoin could take a major chunk of change from gold, crypto expert says
AngloGold Chairman Warns South Africa on ‘Reckless’ Mining Rules
=====
In other news:
Trump says he's 'ready' to put tariffs on all $505 billion of Chinese goods imported to the US
Stocks Struggle; Treasuries Slip Along With Dollar: Markets Wrap
Trump criticizes Federal Reserve interest rate policy despite strong economy
Trump’s Fed Bashing Could Backfire by Stiffening Rate-Hike Resolve
Trump breaks taboo on Fed, says ‘not thrilled’ about rate hikes
Draghi Will Just About Lift ECB Interest Rate Before Leaving
Copper Dips Below $6,000 as China Sends Metals Into Freefall
Global Economy Lives on the Edge as Crisis Veterans Sound Alarms
Are Diamonds ‘Common’? MIT Finds Quadrillion Tons Hidden Deep Below Earth’s Surface
China's yuan plunges again. Is a currency war coming?
=====
Thank you.
Sincerely,
Przemyslaw Radomski, CFA
Founder, Editor-in-chief, Gold & Silver Fund Manager
Gold & Silver Trading Alerts
Forex Trading Alerts
Oil Investment Updates
Oil Trading Alerts

