

Briefly: in our opinion, full (300% of the regular position size) speculative short positions in junior mining stocks are justified from the risk/reward point of view at the moment of publishing this Alert.
PLEASE NOTE:
Dear Subscribers,
As the Author will be traveling this week, upcoming Gold & Silver Trading Alerts will not include regular technical analysis. Instead, they will focus on the fundamental aspects. The next regular technical analysis will be published on Monday, August 15. PR will inform you about significant changes (which are unlikely).
Stay tuned!
With short squeezes abound on Aug. 8, gold rallied by 0.78%, silver by 3.89%, the GDX ETF by 2.74% and the GDXJ ETF by 2.90%. In contrast, the USD Index declined by 0.16% and U.S. Treasury yields retreated. However, a reversal of fortunes should materialize over the medium term as the PMs’ technical and fundamental outlooks continue to worsen.
It’s Not a Choice
As investors navigate the uncertain economic environment, the question on everyone’s mind is: when will the Fed pivot? With the U.S. economy slowing and unprecedented debt levels putting America in a precarious position, the consensus assumes that the Fed will let inflation rage to avoid widespread bankruptcies. Therefore, gold, silver, and mining stocks will surge as the dovish pivot approaches.
Moreover, our subscriber shared an article that outlines “why the Fed will have to change course.” In a nutshell: it presents the same arguments that perma-investors have cited since the Fed threatened to taper its asset purchases. However, while these narratives garner plenty of attention, they’re out of touch with economic reality and historical precedent.
For example, I’ve stated on many occasions that dealing with inflation is not a choice, and while the consensus assumes that a Fed pivot will set everything alight, a realization is the worst-possible economic outcome.
To explain, let’s conduct a history lesson. The Fed wrote an essay about “The Great Inflation” from 1965 to 1982. Moreover, when discussing the origins of the crisis, the report stated:
“Motivated by a mandate to create full employment with little or no anchor for the management of reserves, the Federal Reserve accommodated large and rising fiscal imbalances and leaned against the headwinds produced by energy costs. These policies accelerated the expansion of the money supply and raised overall prices without reducing unemployment.”
Sound familiar? More importantly, when inflation raged and a weakened U.S. economy led to a rise in unemployment, Americans and politicians soon realized that inflation was the greater evil. The report stated:
“As businesses and households came to appreciate, indeed anticipate, rising prices, any trade-off between inflation and unemployment became a less favorable exchange until, in time, both inflation and unemployment became unacceptably high. This, then, became the era of ‘stagflation’.”
“In 1964, when this story began, inflation was 1 percent and unemployment was 5 percent. Ten years later, inflation would be over 12 percent and unemployment was above 7 percent. By the summer of 1980, inflation was near 14.5 percent, and unemployment was over 7.5 percent.”
Remember, inflation is like termites; it eats away at the U.S. economy until it crumbles. Therefore, the greater risk is not curbing inflation. The report continued:
“Once in the position of having unacceptably high inflation and high unemployment, policymakers faced an unhappy dilemma. Fighting high unemployment would almost certainly drive inflation higher still, while fighting inflation would just as certainly cause unemployment to spike even higher.”
However, with the destructive nature of inflation now obvious (we’re not there yet in 2022), the answer to the “trade-off” was clear, and the narrative shifted dramatically. For starters:
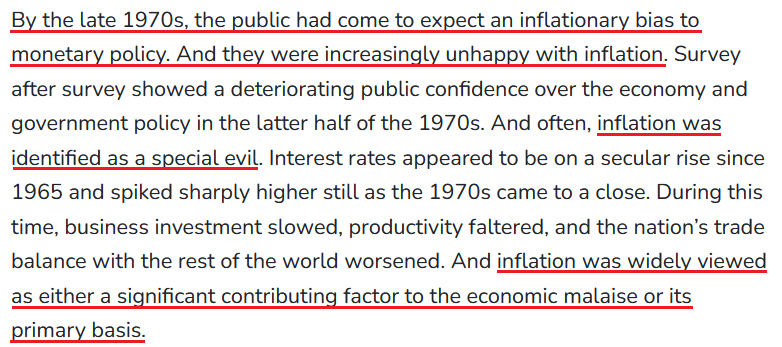 Source: U.S. Fed
Then:
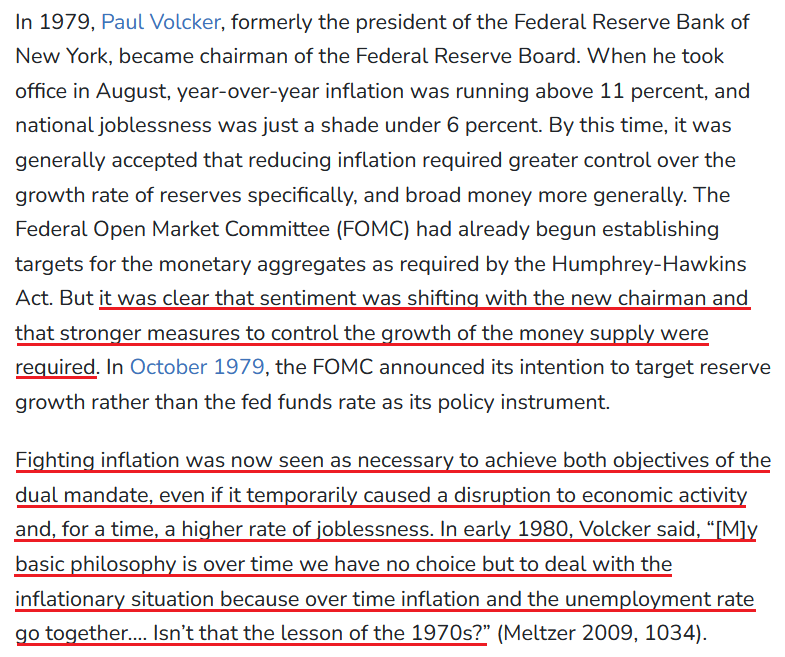 Source: U.S. Fed
As such, the idea that the Fed can pivot and inflation will subside may be the biggest bubble in the financial markets. Not only does it lack economic logic, but it is antithetical to historical precedent. To that point, while the chorus calls for Fed easing, I warned on Aug. 5 that unanchored inflation forced the Fed to raise interest rates during the 1970s and 1980s recessions. I wrote:
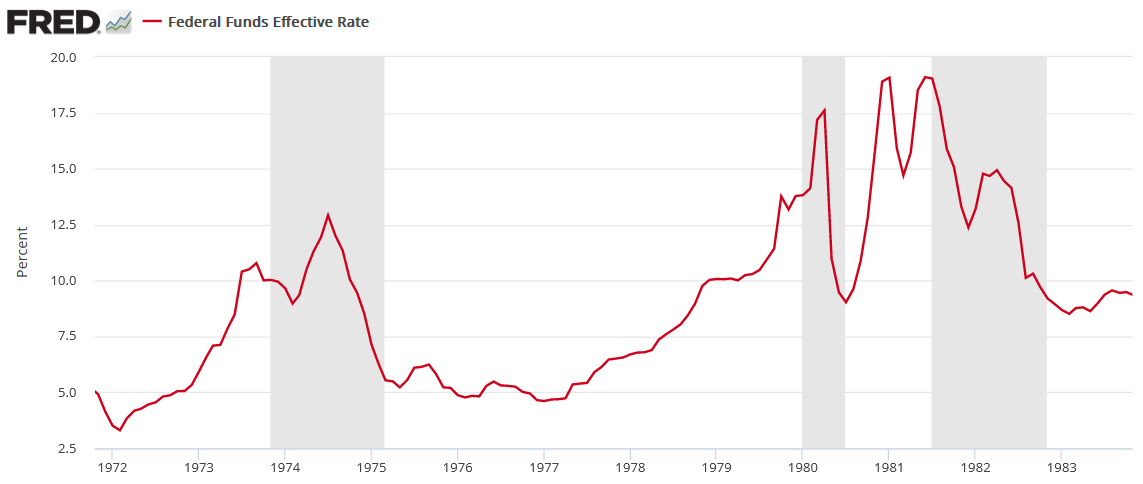
To explain, the red line above tracks the FFR during the 1970s and 1980s, and the vertical gray bars represent recessions. For one, unanchored inflation forced the Fed to raise interest rates during (not just before) all three recessions. In addition, the ~1974 and ~1982 recessions show how after the Fed cut rates to support economic growth, the central bank had to reverse course and raise the FFR once again. As such, the consensus underestimates how difficult it is to slay inflation once it gets going.
Furthermore, it’s important to remember that Arthur Burns was the Fed Chairman from 1970 to 1978, and he was much less hawkish than Paul Volcker (who was Chairman from 1979 to 1987). As a result, the rate cuts on the chart above that began in 1973 and then reversed sharply higher in 1974 were administered by Burns. However, when the Richmond Fed did a post-mortem on the monetary mistake, the findings mirrored the false narratives that are prevalent today. An excerpt read:
“Volcker still deserves credit for resisting political pressure to ease during the 1981–82 recession, which might have led to a continuation of the stop-go approach the Fed was seen as pursuing under Burns. What distinguishes Volcker from Burns in the minds of many is the fact that he followed through after initial disinflationary policy moves, a consistent approach that helped build and maintain the Fed’s credibility for keeping inflation in check.”
For context, a “stop-go approach” means the Fed cuts interest rates and then has to raise them once again. However, the mistakes of the past highlight how the Fed’s inflation gambit ends the same either way.
Please see below:
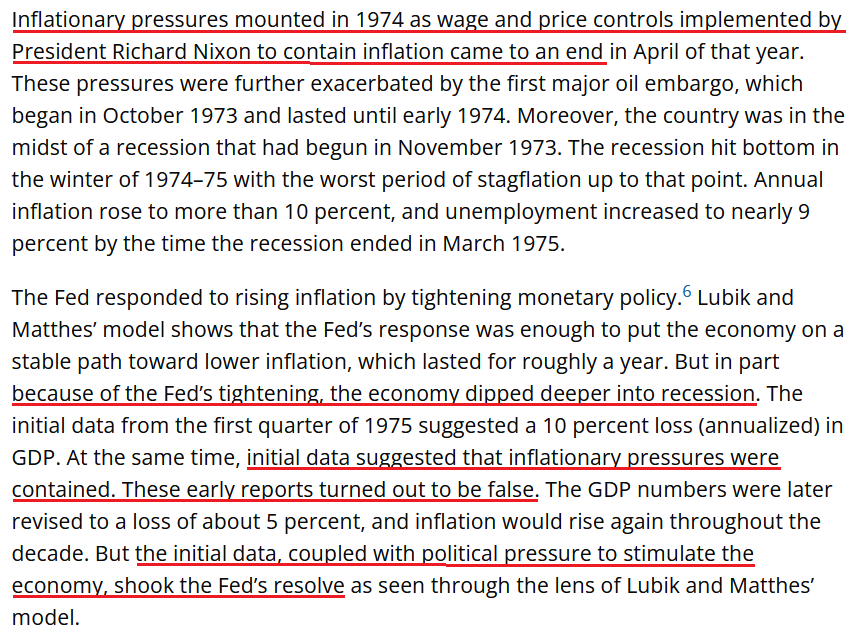 Source: Richmond Fed
Thus, doesn’t that also sound familiar?
- We have politicians redefining the definition of a recession while investors clamor for a dovish pivot.
- The slightest drop in commodity prices, inflation expectations or the Consumer Price Index (CPI) is heralded as “peak inflation,” and therefore, the Fed can ease.
As such, Fed Chairman Jerome Powell can follow Volcker's path and raise the U.S. federal funds rate (FFR) to capsize inflation. Or, he can follow Burns' path and implement a "stop-go approach." However, history shows that both paths end with a much higher FFR.
Furthermore, don't you think that investors were calling for dovish pivots in the 1970s and 1980s? The Richmond Fed cited how "political pressure to stimulate the economy shook the Fed's resolve." As a result, it's naïve to assume that politicians and investors didn't argue about why the Fed needed to pivot back then.
However, the common denominator is that inflation didn't (and doesn't) magically disappear. In reality, economic pain is needed to reduce the pricing pressures. Thus, while I've stated it several times, if Powell chooses the Burns' path, the culminating recession will be much worse than if he chooses the Volcker path.
Fade the Squeeze
With gold, silver, and mining stocks rallying on Aug. 8, you may be a little unsettled by the recent price action. However, it’s important to understand the drivers of the move, and why the optimism is unlikely to last. To explain, I wrote on Aug. 5:
While the financial markets have turned back the clock to the summer of 2020, the fundamental environment couldn’t be more different. Moreover, with gold, silver, and mining stocks benefiting from the speculative fervor, fighting inflation should prove more challenging than investors realize (…). Michael Burry – who is famous for shorting the housing market in 2008 – highlighted retail investors’ renewed “Silliness” on Aug. 4.
Please see below:
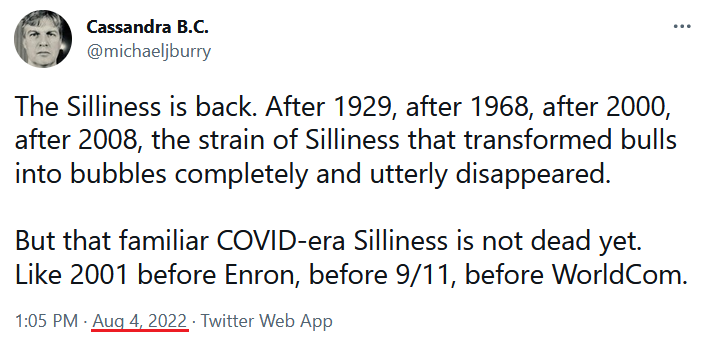
Therefore, with the “Silliness” continuing on Aug. 8, the rising tide helped uplift the PMs.
Please see below:
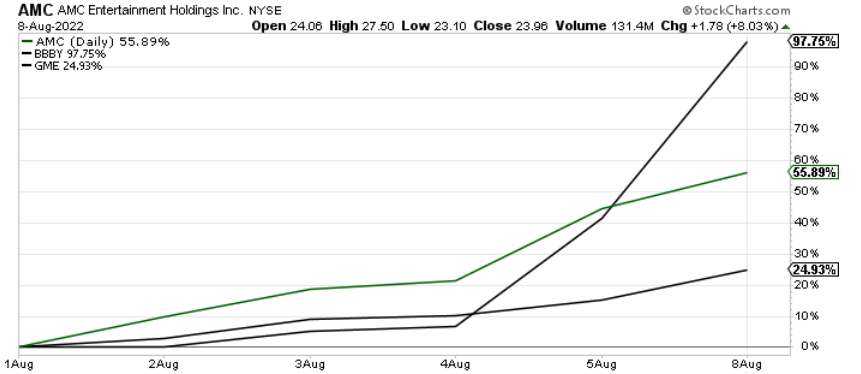
To explain, the green and black lines above track the one-week performances of meme stocks like GameStop. AMC and Bed Bath & Beyond. As you can see, the latter has soared by nearly 100% as the bubble buyers reasserted themselves.
Likewise, Goldman Sachs’ basket of the most-shorted stocks has risen for nine straight days, matching the longest winning streak on record.
Please see below:
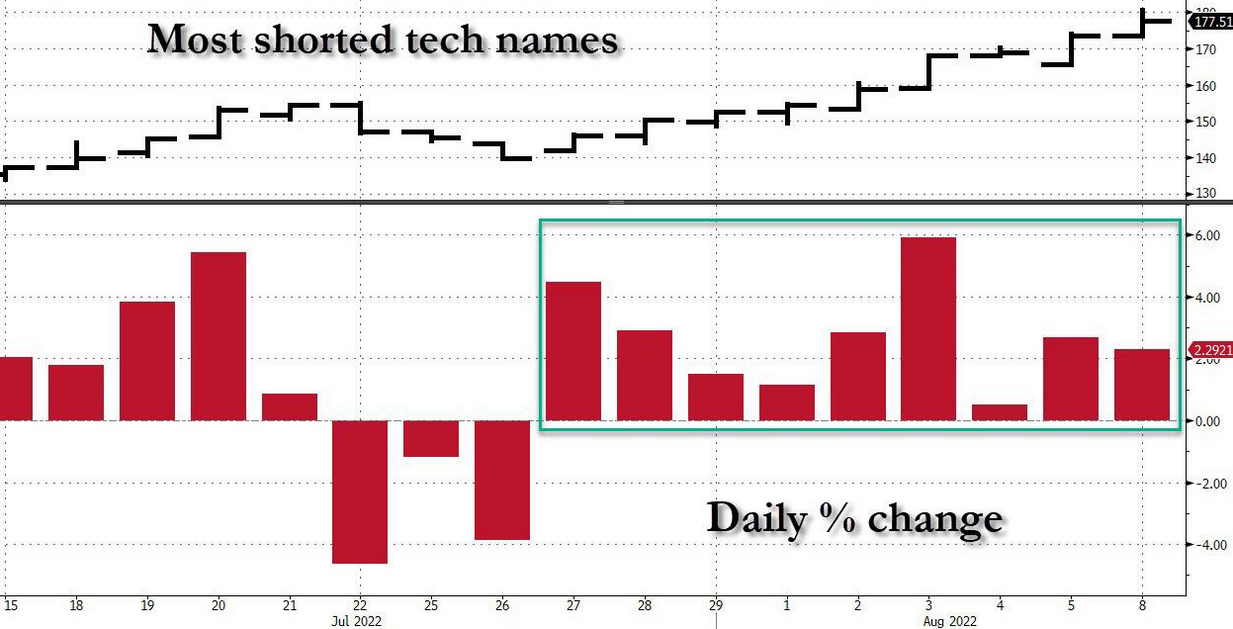 Source: Bloomberg/ZeroHedge
To explain, the red bars on the right side of the chart above highlight how the short squeeze has intensified as the most speculative U.S. stocks make a comeback.
Furthermore, retail’s gain has been hedge funds’ pain.
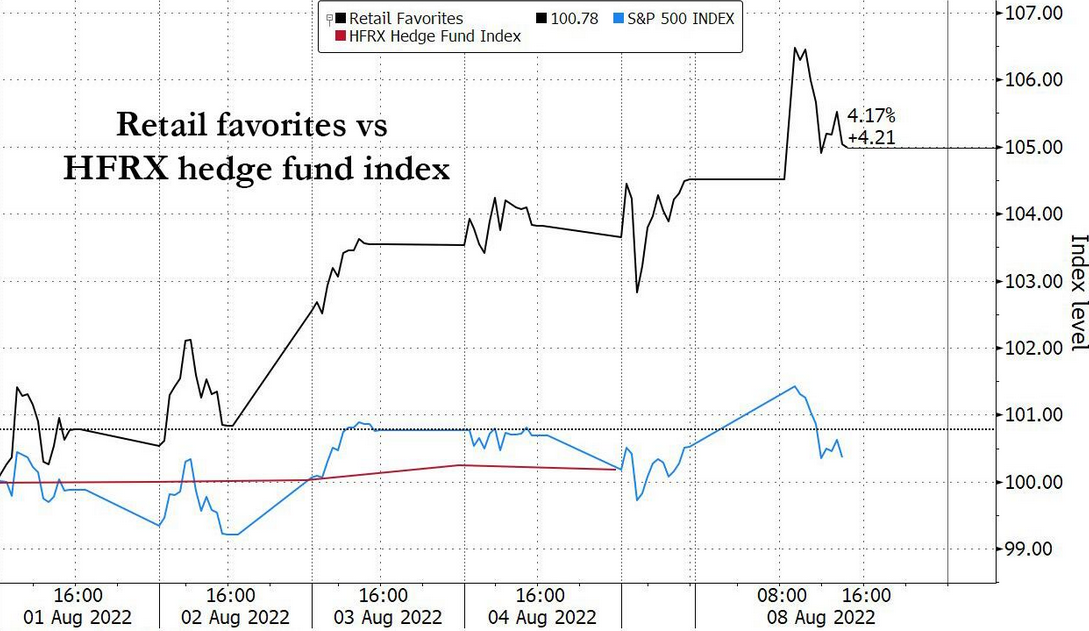 Source: Bloomberg/ZeroHedge
To explain, the black line above tracks an index of retail investors’ favorite stocks, while the blue line above tracks the HFRX hedge fund index. If you analyze the relationship, you can see that the spiking retail basket has led to mixed performance as hedge funds scramble to unwind their short positions.
As a result, the above developments are the main drivers of the PMs’ recent strength. However, as 2021 showed, gravity is undefeated, and the gains are unlikely to hold.
The Bottom Line
Investors live on a faulty foundation of “this time is different.” First, inflation was a supply-side phenomenon. Then, it was broadening but still “transitory.” Now, we’ve reached neutrality and rate cuts can commence in 2023. However, the prospect is ridiculous, and while history highlights the catastrophic pitfalls of dismissing inflation, the consensus doesn’t learn from their mistakes. Moreover, with a meme stock like Bed Bath & Beyond nearly doubling in a week, does it seem like we’re anywhere near neutral?
In conclusion, the PMs rallied on Aug. 8, as the speculative frenzy continued. However, short squeezes were part of the PMs’ journeys to lower lows in 2021 and 2022, and this time should be no different. Therefore, it’s prudent to focus on the big picture and ignore the day-to-day noise.
Overview of the Upcoming Part of the Decline
- It seems to me that the corrective upswing is either over or about to be over, and that the next big move lower is about to start.
- If we see a situation where miners slide in a meaningful and volatile way while silver doesn’t (it just declines moderately), I plan to – once again – switch from short positions in miners to short positions in silver. At this time, it’s too early to say at what price levels this could take place and if we get this kind of opportunity at all – perhaps with gold prices close to $1,600.
- I plan to exit all remaining short positions once gold shows substantial strength relative to the USD Index while the latter is still rallying. This may be the case with gold prices close to $1,400. I expect silver to fall the hardest in the final part of the move. This moment (when gold performs very strongly against the rallying USD and miners are strong relative to gold after its substantial decline) is likely to be the best entry point for long-term investments, in my view. This can also happen with gold close to $1,400, but at the moment it’s too early to say with certainty.
- The above is based on the information available today, and it might change in the following days/weeks.
You will find my general overview of the outlook for gold on the chart below:
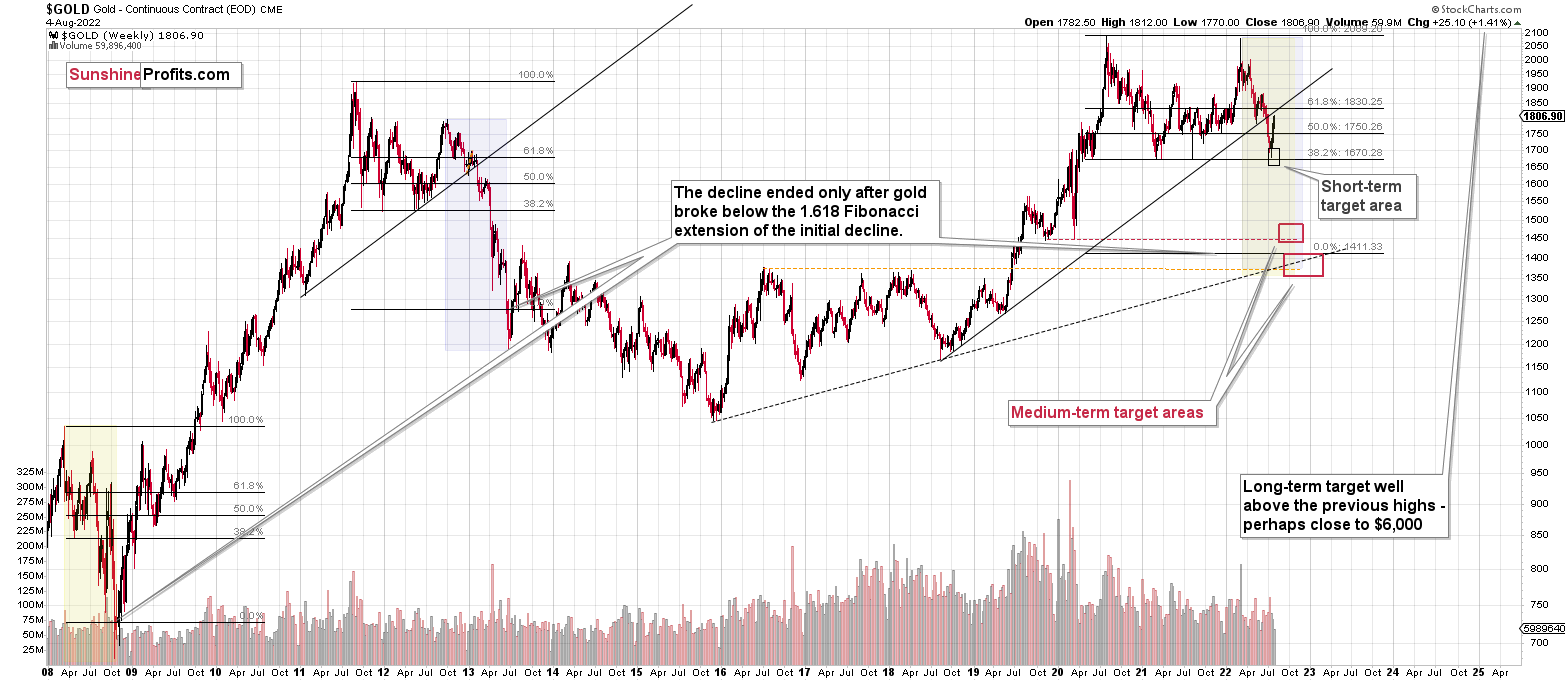
Please note that the above timing details are relatively broad and “for general overview only” – so that you know more or less what I think and how volatile I think the moves are likely to be – on an approximate basis. These time targets are not binding nor clear enough for me to think that they should be used for purchasing options, warrants, or similar instruments.
Summary
Summing up, it seems that the corrective upswing is over (or close to being over), which means that the powerful medium-term downtrend can now resume.
Last week, we closed yet another profitable trade in a row. This year’s profits are already enormous, but it seems likely to me that they will grow even more in the following weeks and months. Making money on corrections during powerful trends is a difficult feat, but you managed to do just that – congratulations!
On an administrative note, I will be traveling this week, and therefore, Gold & Silver Trading Alerts posted during next week will not include the regular technical analysis – they will focus on the fundamental aspects instead. The next regular technical analysis will be posted on Monday, Aug. 15. I will keep you informed if anything major changes (which is unlikely).
Moreover, please note that it’s not only the profits on the long positions that are so great about this success – it’s also the ability to get back on the short side of the market at more favorable (higher) prices, thus increasing the likely profits from the current trade. Congratulations, once again!
Also, please note that I will be updating the targets for the leveraged ETFs as we move closer to them, as their prices will depend on the path prices take to reach their targets.
After the final sell-off (that takes gold to about $1,350-$1,500), I expect the precious metals to rally significantly. The final part of the decline might take as little as 1-5 weeks, so it's important to stay alert to any changes.
As always, we'll keep you – our subscribers – informed.
To summarize:
Trading capital (supplementary part of the portfolio; our opinion): Full speculative short positions (300% of the full position) in junior mining stocks are justified from the risk to reward point of view with the following binding exit profit-take price levels:
Mining stocks (price levels for the GDXJ ETF): binding profit-take exit price: $20.32; stop-loss: none (the volatility is too big to justify a stop-loss order in case of this particular trade)
Alternatively, if one seeks leverage, we’re providing the binding profit-take levels for the JDST (2x leveraged). The binding profit-take level for the JDST: $29.87; stop-loss for the JDST: none (the volatility is too big to justify a SL order in case of this particular trade).
For-your-information targets (our opinion; we continue to think that mining stocks are the preferred way of taking advantage of the upcoming price move, but if for whatever reason one wants / has to use silver or gold for this trade, we are providing the details anyway.):
Silver futures downside profit-take exit price: $12.32
SLV profit-take exit price: $11.32
ZSL profit-take exit price: $79.87
Gold futures downside profit-take exit price: $1,504
HGD.TO – alternative (Canadian) 2x inverse leveraged gold stocks ETF – the upside profit-take exit price: $19.87
HZD.TO – alternative (Canadian) 2x inverse leveraged silver ETF – the upside profit-take exit price: $49.87
Long-term capital (core part of the portfolio; our opinion): No positions (in other words: cash)
Insurance capital (core part of the portfolio; our opinion): Full position
Whether you’ve already subscribed or not, we encourage you to find out how to make the most of our alerts and read our replies to the most common alert-and-gold-trading-related-questions.
Please note that we describe the situation for the day that the alert is posted in the trading section. In other words, if we are writing about a speculative position, it means that it is up-to-date on the day it was posted. We are also featuring the initial target prices to decide whether keeping a position on a given day is in tune with your approach (some moves are too small for medium-term traders, and some might appear too big for day-traders).
Additionally, you might want to read why our stop-loss orders are usually relatively far from the current price.
Please note that a full position doesn't mean using all of the capital for a given trade. You will find details on our thoughts on gold portfolio structuring in the Key Insights section on our website.
As a reminder - "initial target price" means exactly that - an "initial" one. It's not a price level at which we suggest closing positions. If this becomes the case (as it did in the previous trade), we will refer to these levels as levels of exit orders (exactly as we've done previously). Stop-loss levels, however, are naturally not "initial", but something that, in our opinion, might be entered as an order.
Since it is impossible to synchronize target prices and stop-loss levels for all the ETFs and ETNs with the main markets that we provide these levels for (gold, silver and mining stocks - the GDX ETF), the stop-loss levels and target prices for other ETNs and ETF (among other: UGL, GLL, AGQ, ZSL, NUGT, DUST, JNUG, JDST) are provided as supplementary, and not as "final". This means that if a stop-loss or a target level is reached for any of the "additional instruments" (GLL for instance), but not for the "main instrument" (gold in this case), we will view positions in both gold and GLL as still open and the stop-loss for GLL would have to be moved lower. On the other hand, if gold moves to a stop-loss level but GLL doesn't, then we will view both positions (in gold and GLL) as closed. In other words, since it's not possible to be 100% certain that each related instrument moves to a given level when the underlying instrument does, we can't provide levels that would be binding. The levels that we do provide are our best estimate of the levels that will correspond to the levels in the underlying assets, but it will be the underlying assets that one will need to focus on regarding the signs pointing to closing a given position or keeping it open. We might adjust the levels in the "additional instruments" without adjusting the levels in the "main instruments", which will simply mean that we have improved our estimation of these levels, not that we changed our outlook on the markets. We are already working on a tool that would update these levels daily for the most popular ETFs, ETNs and individual mining stocks.
Our preferred ways to invest in and to trade gold along with the reasoning can be found in the how to buy gold section. Furthermore, our preferred ETFs and ETNs can be found in our Gold & Silver ETF Ranking.
As a reminder, Gold & Silver Trading Alerts are posted before or on each trading day (we usually post them before the opening bell, but we don't promise doing that each day). If there's anything urgent, we will send you an additional small alert before posting the main one.
Thank you.
Przemyslaw Radomski, CFA
Founder, Editor-in-chief

