

Briefly: in our opinion, full (300% of the regular position size) speculative short positions in junior mining stocks are justified from the risk/reward point of view at the moment of publishing this Alert.
In yesterday’s analysis, I compared the current situation in the precious metals to the one in stocks that we saw last year. It appears that the similarity remains up-to-date as gold is up in today’s pre-market trading (at the moment of writing these words).
As you may recall, last year, stocks didn’t decline until the second session of the year. Of course, the history doesn’t have repeat itself to the letter, but I wouldn’t make too much of the upswing in the first few days of the year. Here’s what we wrote about this matter yesterday:
Do you remember the “January rally” that we saw in early 2022? It lasted less than two days. Stocks moved higher in the first session of the year, and they formed an intraday top during the second session of the year.
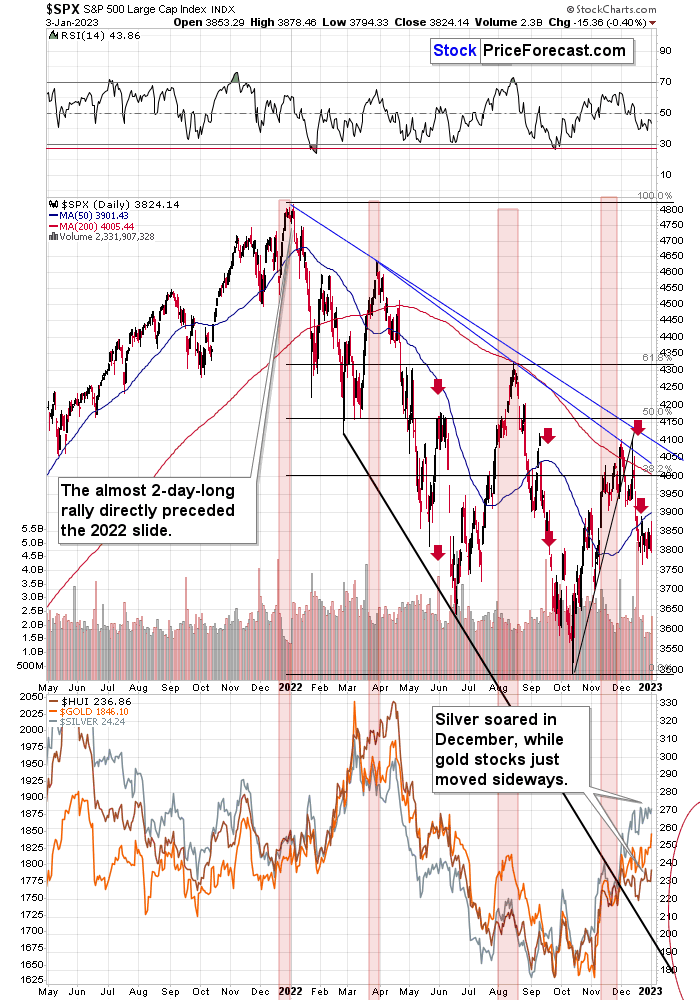
And then, the S&P 500 moved from about 4,800 to levels below 3,600.
So, looking at the early-January performance might be misleading.
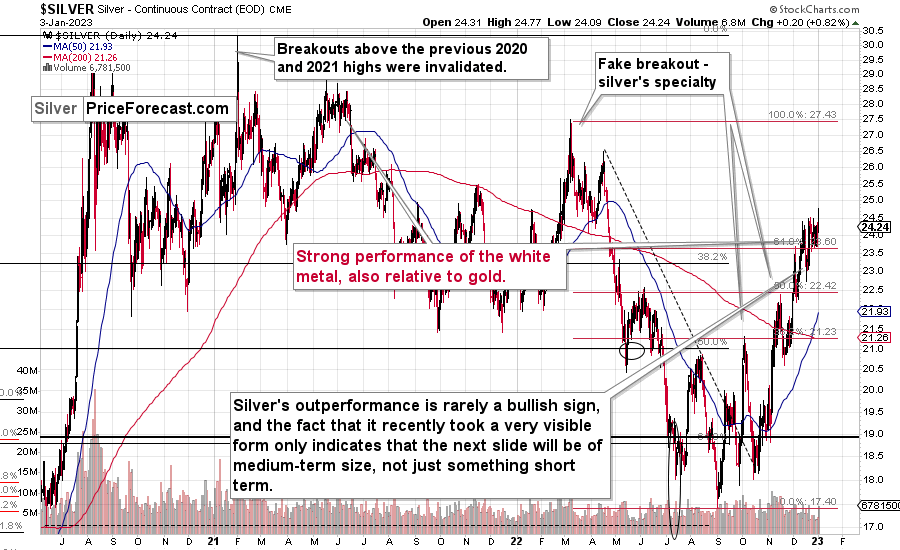
The lower part of the above chart features gold, silver, and the HUI Index (proxy for gold stocks). As you can see, silver outperformed gold strongly in December, while gold stocks did almost nothing, greatly underperforming gold. That’s a very powerful bearish indication for the following weeks. After all, that’s exactly what tends to happen close to market tops – silver outperforms, while gold stocks lag.
Interestingly, stocks started this year with a bearish reversal.
Of course, these are not the reasons for the decline per se – I listed multiple thereof (e.g., rising real interest rates) in my previous analyses.
The other key driver of gold prices (besides real interest rates) is the USD Index, and it just showed strength.
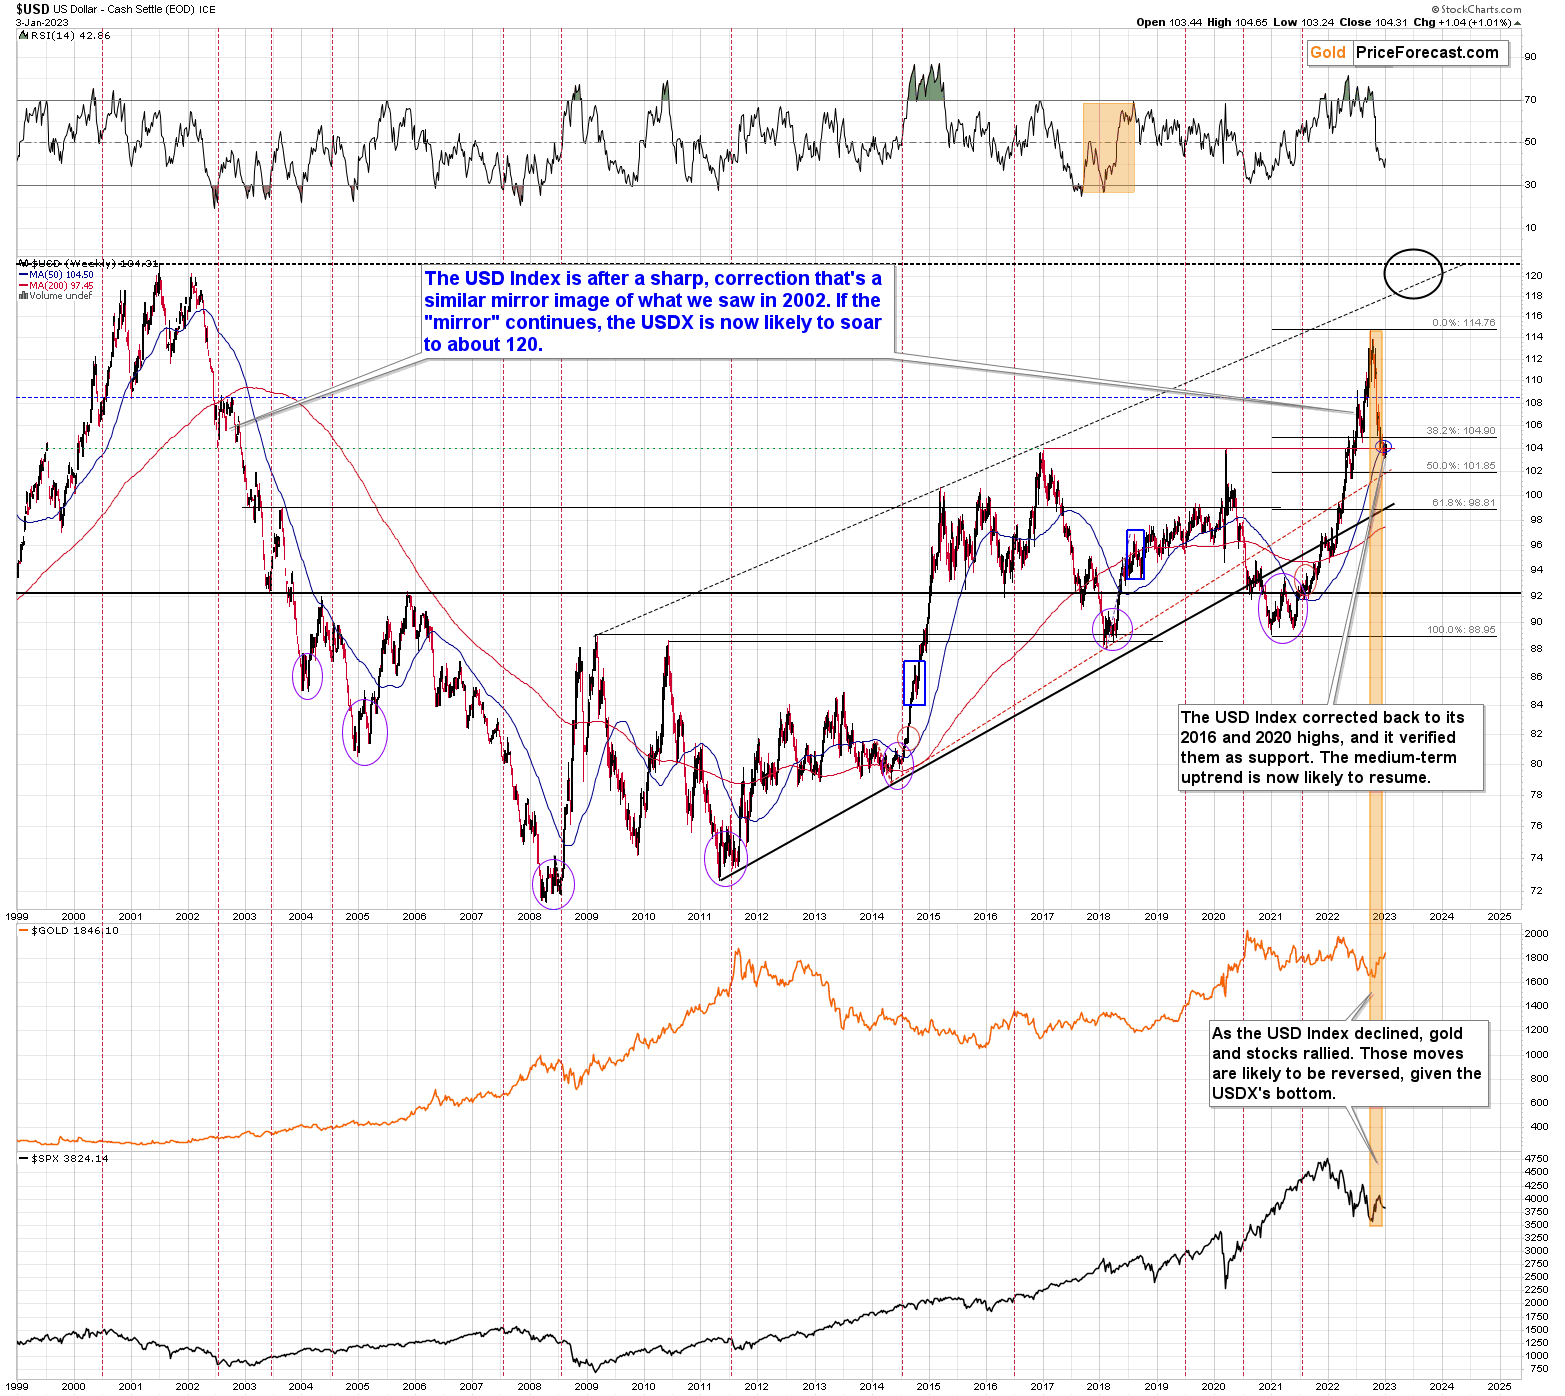
The USDX is down in today’s pre-market trading, but it moved substantially higher yesterday. High enough to make it clear that the very strong support provided by the 2016 and 2020 highs held.
This, in turn, means that another medium-term rally in the USDX is likely to begin any day now – and perhaps it’s already underway.
From the short-term point of view, we only saw a daily rally so far, and this rally is being corrected right now, which means that the USDX is still in preparation mode.
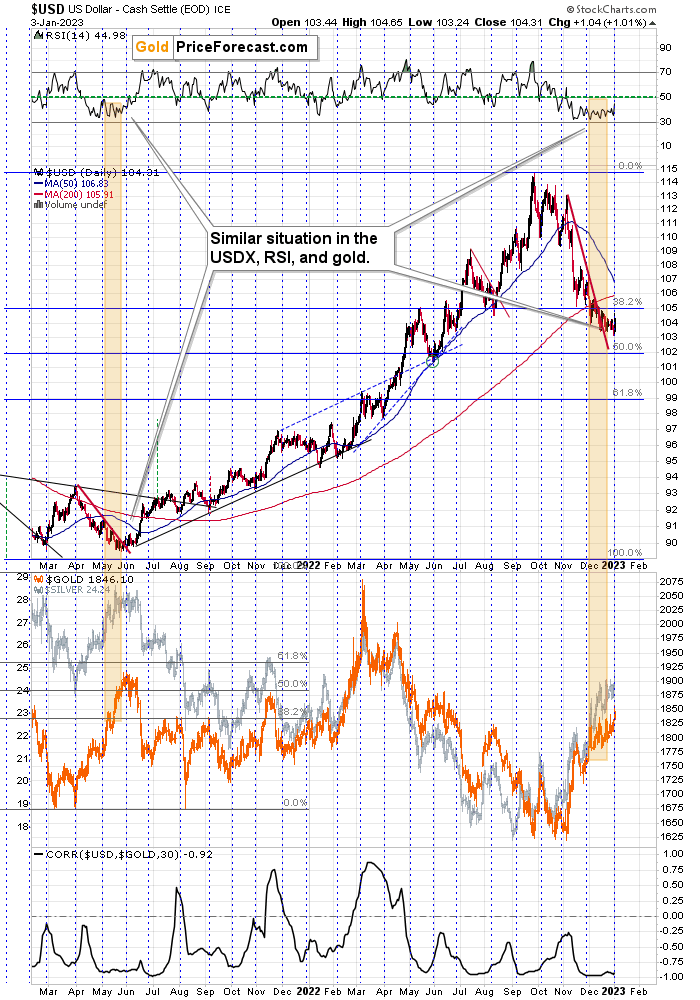
Still, the above short-term chart continues to provide us with bullish implications because of the great similarity between the recent action in the USDX itself and the RSI based on it (not to mention the correlation with gold that you can see on the bottom of the above chart) and what happened in mid-2021.
The lengthy bottom was followed by a small breakout at first, and then by a bigger rally. Both gold and silver fell substantially at that time, and it was the start of an even bigger decline in junior mining stocks.
What we saw yesterday was perhaps analogous to that small breakout that started it all previously.
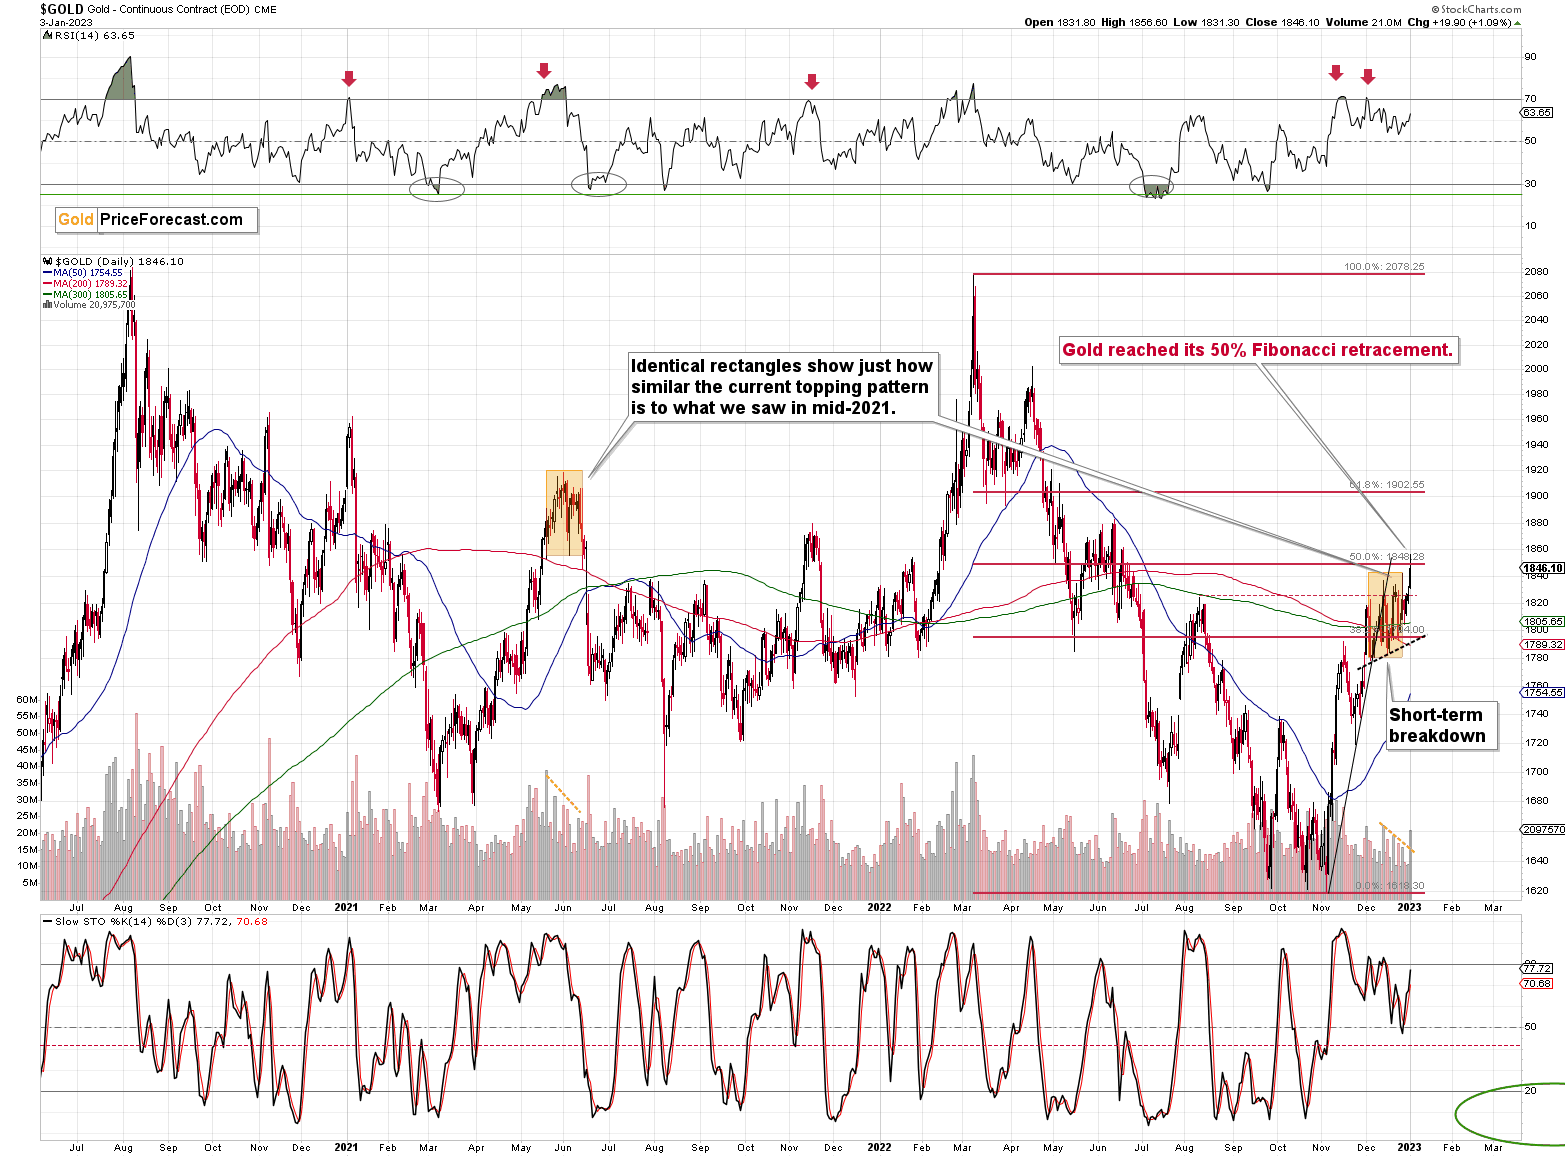
The gold price itself moved to its 50% Fibonacci retracement level, and then moved back down. It reversed on an intraday basis on relatively big volume. It didn’t erase most of the rally, so the bearish indications from the reversal candlestick are not strong. However, the fact that gold moved to one of its key retracements is notable.
In today’s pre-market trading, gold futures moved a bit above that level, but the breakout is not yet confirmed.
Silver reversed in a much more profound and clear manner. In silver’s case, the reversal was clear, and it was confirmed by relatively big volume. This is a bearish indication for the short term.
In today’s pre-market trading silver moved a bit higher, but it didn’t manage to move above yesterday’s intraday highs.
Junior miners moved very close to their previous highs, but then reversed and ended the day visibly below them.
Consequently, nothing really changed, and the overall shape of yesterday’s session was bearish – as it’s the case with daily reversals.
All in all, the short-term outlook for the precious metals didn’t really improve and it remains bearish for the following weeks.
Also, let’s take a broader look at the situation.
The chart below features the HUI Index to S&P 500 Index ratio. In other words, it’s an approximate relative performance of gold stocks vs. all stocks.
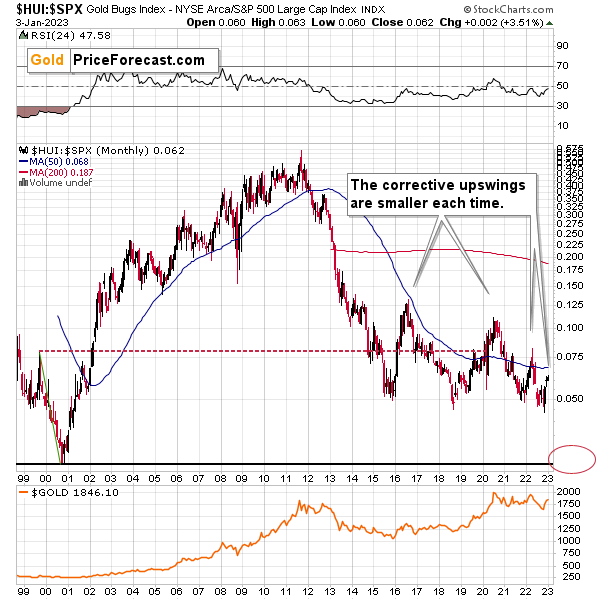
First of all, the above chart emphasizes just how weak the precious metals sector has really been in the past decade and more.
For those, who think that the precious metals sector remained in the bull mode throughout the years, here comes the shocker:
Gold stocks’ performance since 1999 has been worse than the one of the S&P 500 Index.
Gold hasn’t moved above its 2011 highs in a sustainable manner, even despite war in Europe, but the real weakness since 2011 is visible only after you look at how much gold stocks declined compared to the general stock market. The ratio is now just a little above 10% of what it used to be at the 2011 peak.
Interestingly, the corrective upswings in the ratio have been smaller and smaller. This is the fourth corrective upswing since the 2015 / 2016 bottom. Given the above, it seems that when the ratio finally breaks below the 0.05 level, it will slide profoundly once again. Even if the slide is not as huge as it was between 2013 and 2016, it could be big enough to cause serious pain in the precious metals sector – just as we saw in 2008.
There is a very strong support at the 2000 bottom – the all-time low of 0.026. A move there implies an over 50% cut in the prices of gold stocks, even if the stock market doesn’t decline.
With the S&P 500 at about 3,800, the above would imply a bottom below the 100 level.
And if the S&P 500 slides, then the bottom could take place even lower – perhaps at the 80 level.
As a reminder, 100 is the level that the HUI Index reached at its 2016 bottom. Consequently, the above implies a truly spectacular slide in the following months.
Having said that, let’s take a look at the markets from a more fundamental point of view.
Could Stagflation Save Gold In 2023?
While the Big Tech bloodbath continued on Jan. 3 and the USD Index soared, gold, silver and mining stocks continued their ascents. Moreover, despite a hawkish Fed, higher real yields and weakness gripping other risk assets, the PMs have outperformed in recent weeks.
As a result, with the permabulls salivating over the short-term price action, even CNBC has boarded the hype train.
Please see below:
 Source: CNBC
Although, while the gold bugs attempt to wish the fundamentals into existence, the realities on the ground are much different.
For example, the new narrative proclaims that instead of a recession, stagflation could grip the U.S. economy, sparking a renaissance for hard assets and despair for everything else. Therefore, a repeat of the 1970s is on the horizon.
Yet, while we were extremely bullish on inflation in 2021 and noted the similarities to the imbalances created during the 1970s, there are also material differences between the two periods. Consequently, the years-long malaise of high inflation, high unemployment, and weak growth (bullish for gold) is unlikely to materialize this time around.
For one, the crowd assumed that “transitory” inflation was a function of supply-side constraints. But we warned about the pitfalls of that thesis on Mar. 31. We wrote:
There is a misnomer in the financial markets that inflation is a supply-side phenomenon. In a nutshell: COVID-19 restrictions, labor shortages, and manufacturing disruptions are the reasons for inflation’s reign. As such, when these issues are no longer present, inflation will normalize, and the U.S. economy will enjoy a “soft landing.”
However, investors’ faith in the narrative will likely lead to plenty of pain over the medium term. For example, we’ve noted for some time that the U.S. economy remains in a healthy position. And with U.S. consumers flush with cash and a red-hot labor market helping to bloat their wallets, their propensity to spend keeps economic data elevated.
Likewise, while most investors assumed that consumer spending and inflation would fall off a cliff when enhanced unemployment benefits ended in September, the reality is that neither will die easy.
To that point, while the crowd scratched their heads for months wondering why inflation wouldn’t abate, they finally saw the light in December. We wrote on Dec. 1:
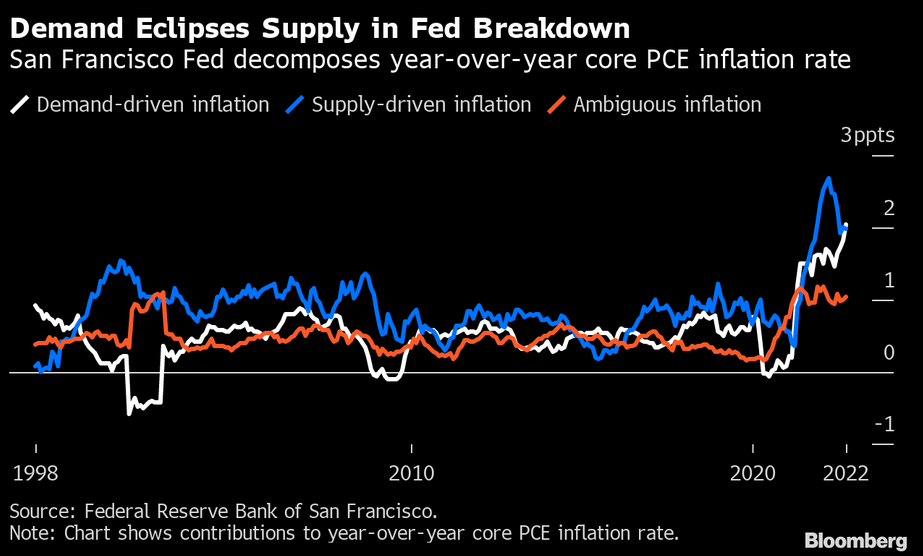
The San Francisco Fed attempted to decompose the drivers of the core Personal Consumption Expenditures (PCE) Index’s year-over-year (YoY) increase. The blue, white, and orange lines above represent supply, demand and ambiguous inflation.
If you analyze the right side of the chart, you can see that the white line (demand) has now surpassed the blue line (supply) as the primary driver of inflation. Thus, while supply chains have normalized and shipping rates have declined by upwards of ~80% YoY, output inflation has barely budged. As such, resilient demand has been the culprit, and the crowd doesn’t grasp how difficult this will make the Fed’s job in 2023.
Please remember that supply-side inflation is associated with currency crises. When a country's currency collapses, the FX-adjusted cost of imports soars, which causes the price of everyday essentials to rise, and forces consumers to foot the bill regardless of their budgets.
Conversely, when a currency is stable, FX-adjusted import costs follow suit, and consumers can't be forced to pay higher prices for most goods, leaving supply and demand to determine the equilibrium.
Think about it: discretionary companies like Ralph Lauren, Chipotle Mexican Grill and Marriott International increased their prices substantially in 2021. But, if Americans were unwilling to pay, their inventories would build, and they would lower their prices to match the demand outlook.
Consequently, this cycle's data screamed demand-side inflation, not supply-side. Furthermore, with the USD Index rising sharply from mid-2021, it was another indicator that supply-side issues were not the problem. As a result, that's why we were bullish on U.S. economic growth and the U.S. federal funds rate (FFR) throughout 2021 and 2022.
So, while the storytellers proclaim that 1970s-style stagflation is around the corner, the current, and likely, performance of the USD Index contrasts that narrative.
Please see below:
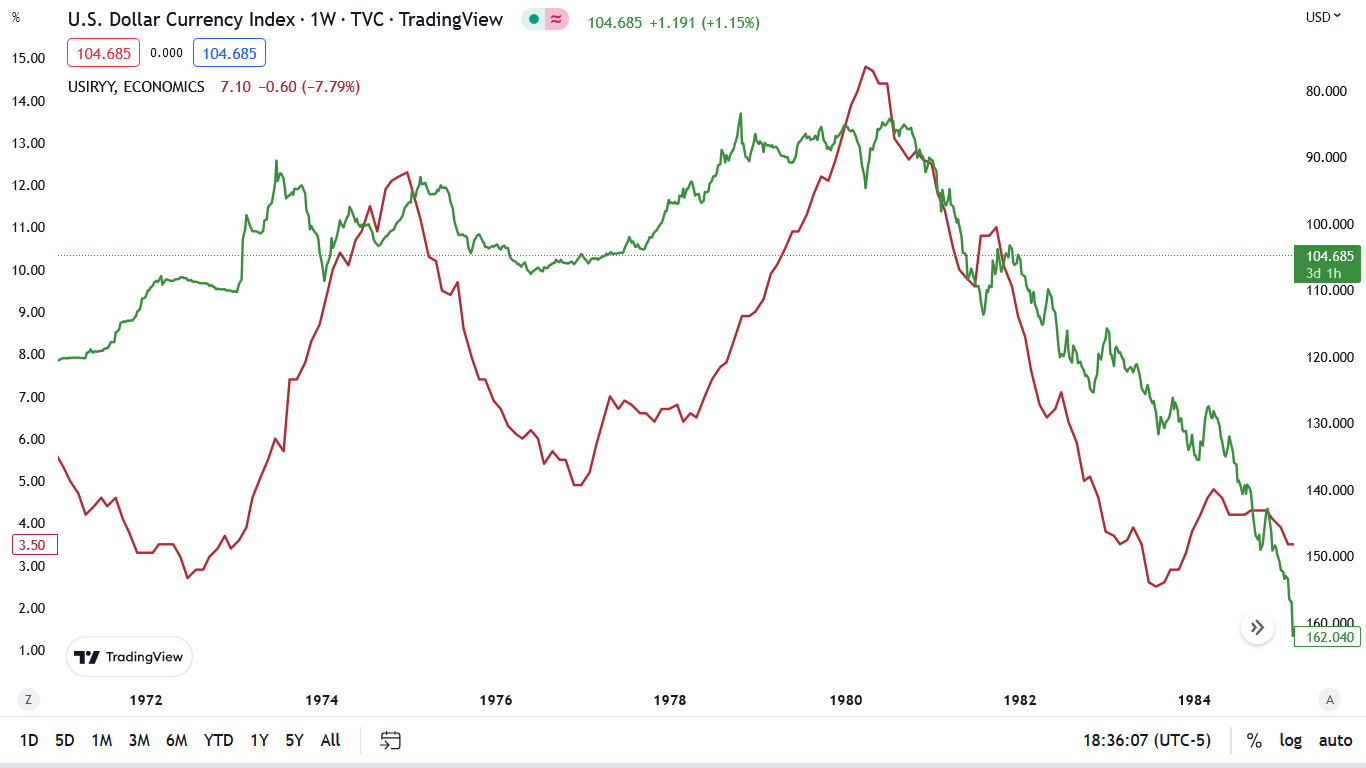
To explain, the red line above tracks the YoY percentage change in the headline CPI during the 1970s/early 1980s, while the green line above tracks the inverted (down means up) USD Index.
If you analyze the relationship, you can see that when inflation soared in the early 1970s, it culminated with the USD index falling from ~120 to ~90. Likewise, the second inflation surge in the late 1970s culminated with the USD Index falling from ~108 to ~83.
Yet, the right side of the chart shows that when the USD Index soared from mid-1980 on (green line falling), the YoY CPI collapsed and returned toward the Fed’s 2% target.
The moral of the story is that the inflationary malaise of the 1970s occurred alongside substantial declines in the USD Index, which intensified supply-side inflation and helped create the stagflationary backdrop.
However, that’s not the case today. The USD Index ended the Jan. 3 session north of 104, and we don’t see it falling to ~90 or ~83 in 2023. In contrast, we expect new highs to materialize, and the notion of stagflation is rooted in an uninformed analysis of the historical record.
Now, if stagflation is an unlikely event, then what’s uplifting the gold price? Well, it’s all about rotations. With a resilient economic climate not providing the catalysts for liquidations, a ‘Lehman moment’ is unlikely in the near term.
Therefore, with investors avoiding tech like the plague, they’re hiding out in ‘old economy’ sectors.
Please see below:
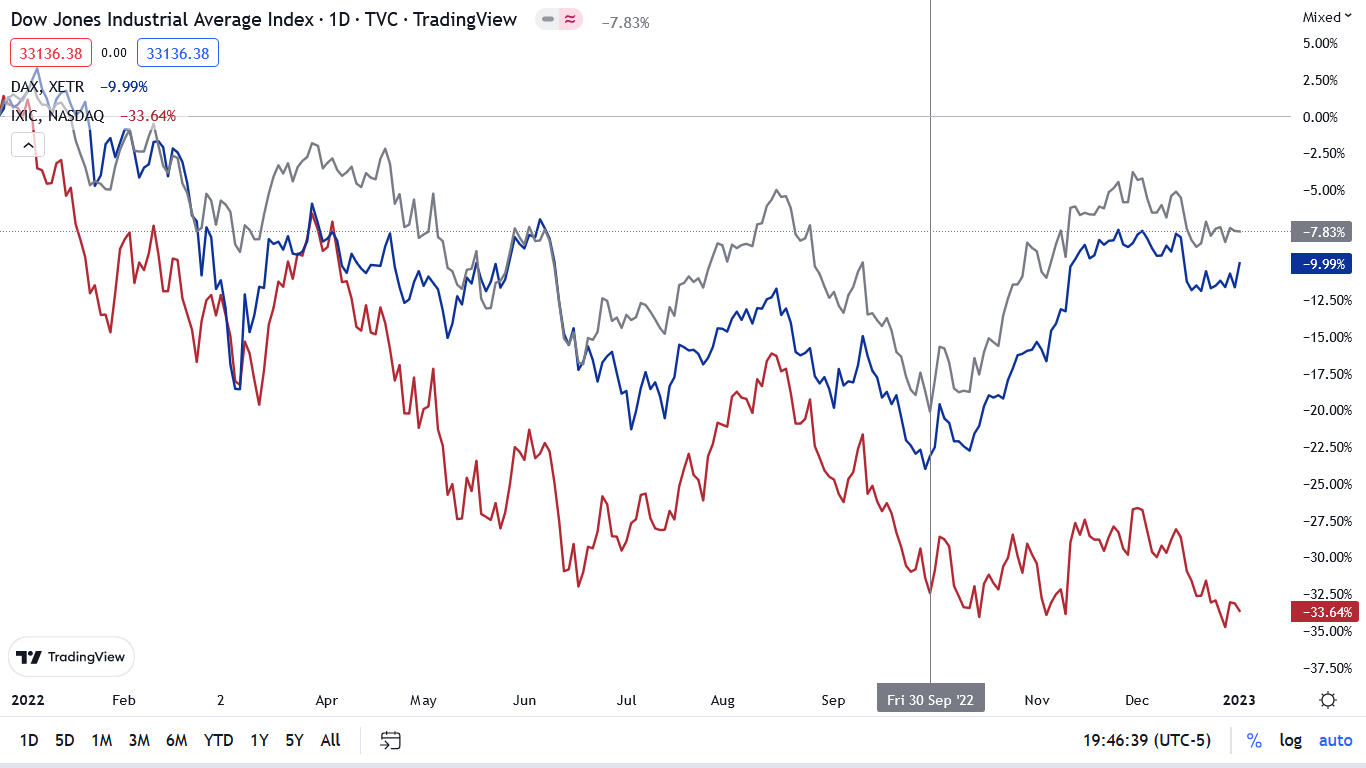
To explain, the gray, blue and red lines above track the one-year performances of the Dow Jones Industrial Average (DJIA), the DAX Index (German benchmark) and the NASDAQ Composite. As you can see, the NASDAQ Composite has substantially underperformed its ‘old economy’ counterparts.
In addition, if you analyze the vertical gray line near the right side of the chart, you can see that the DJIA and the DAX Index have risen sharply off their recent lows, even as the NASDAQ Composite hit new lows. Thus, while the QE kings have been slaughtered, money has simply moved into other areas of the market.
But, while the NASDAQ Composite was the first to bounce off the March 2020 lows and is now the first to fall, the ‘old economy’ sectors should suffer a similar plight in the months ahead. It’s simply a matter of time before the demand destruction that crippled Big Tech comes for financials, industrials, materials, and energy.
Overall, rotations and false narratives have uplifted the gold price; and while the metals seem invincible right now, there was a time when Apple and Tesla were considered untouchable, and look at them now. So, while we remain bullish on the PMs’ long-term prospects, a final sell-off should occur before the next bull market begins.
Will Silver Stay Cool During the Dry Season?
While the PMs attempt to front-run a potential dovish pivot, the thesis is built on the premise that the FFR is approaching its peak. In essence, if the worst of the liquidity drain is near, the crowd will position for the shift by purchasing the PMs in advance.
However, we warned on Dec. 22, that like in 2021, investors misjudge the hawkish implications of unanchored inflation. We wrote:
Nine of the last 10 inflation fights ended with recessions since 1948; and if inflation was easy to defeat, the historical ramifications wouldn’t be so ominous. In addition, we warned that the FFR has eclipsed the peak YoY core CPI in every inflation fight since 1961. Likewise, since the YoY core CPI peaked (for now) at 6.66% in September 2022, the historically-implied peak FFR is at least 6.67%.
Overall, investors believe inflation will subside with little economic damage, and this misguided optimism uplifts gold, silver, and mining stocks. But, a realization requires the Fed to accomplish something it’s only done once since 1948, and as it relates to a lower FFR than the peak YoY core CPI, something it’s never done. Therefore, we’re happy to take the other side of the trade.
So, while the white metal opened the New Year in style, the medium-term silver bulls underestimate the impending liquidity drain.
Please see below:
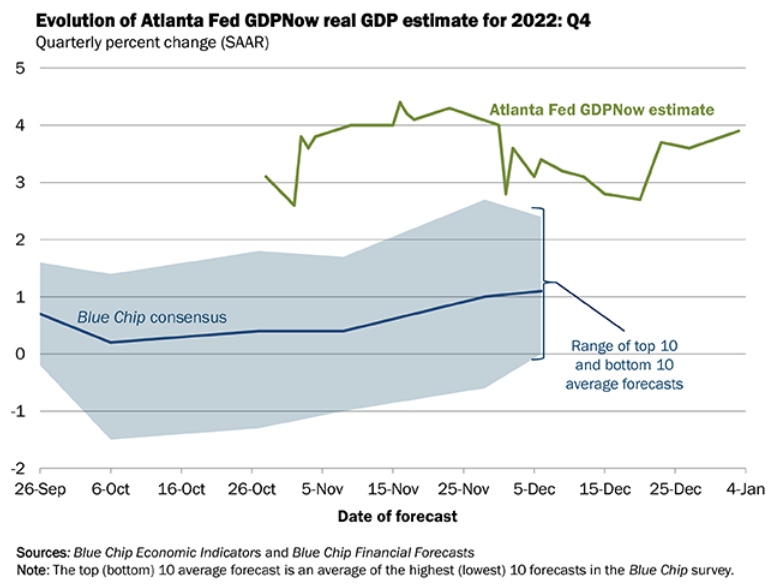
To explain, the Atlanta Fed increased its Q4 real GDP growth estimate (the green line above) from 3.7% on Dec. 23 to 3.9% on Jan. 3. As a result, resilient economic growth is bullish for the FFR, and provides Fed Chairman Jerome Powell with more leeway to remain hawkish for longer.
As such, while we warned that demand was the main driver of inflation, the resilience of GDP growth supports the thesis. Moreover, it’s another indicator of why the FFR needs to align with history and rise by much more than the consensus expects, and the ‘this time is different’ crowd should suffer as the liquidity drain continues.
To that point, we warned on Dec. 13 that investors’ optimism and pessimism impact the Fed’s inflation fight. We wrote:
The crowd believes that lower inflation is a linear process of positive results. However, the pessimism that confronted the financial markets from mid-August to mid-October lowered asset prices and helped calm today’s inflation metrics. Conversely, with that pessimism reversing recently and financial conditions loosening, the current optimism sets the stage for higher inflation over the medium term.
Furthermore, market participants don’t realize that the inflation merry-go-round will spin if they keep overreacting to relatively immaterial progress. In other words: investors’ hopes for a dovish pivot actually reduce the chances of one occurring.
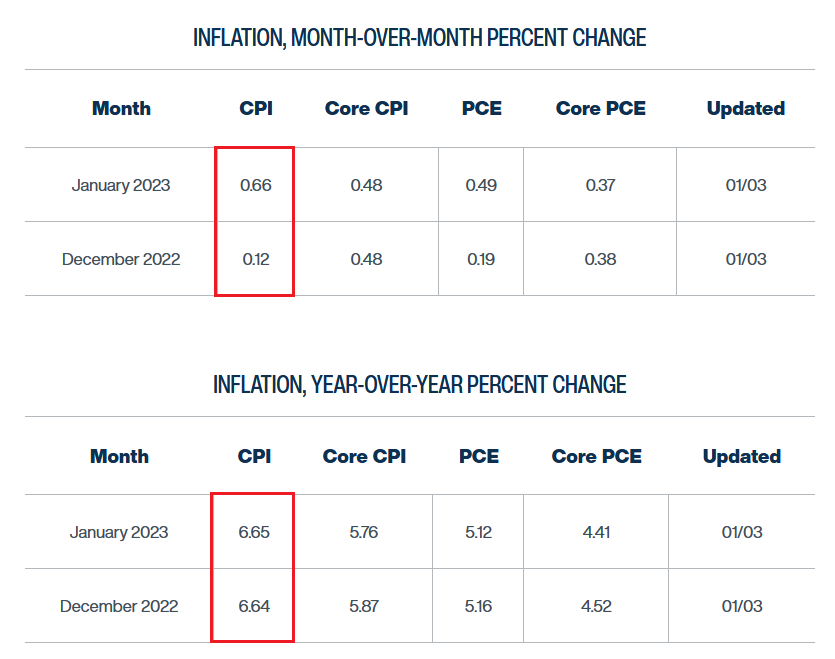
Thus, with the latest update from the Cleveland Fed highlighting the phenomenon, one month’s pivot enthusiasm is next month’s disappointment.
Please see below:
 Source: Cleveland Fed
To explain, the red rectangle at the top of the table above shows that a 0.12% month-over-month (MoM) increase in the headline CPI is expected in December, while a 0.66% MoM rise is expected in January. Consequently, the ‘old economy’ optimism that's occurred in recent weeks may keep the headline CPI from making any progress on a YoY basis (the red rectangle at the bottom).
Also, the second column to the right shows that the core CPI is expected to remain uplifted, as 0.48% MoM increases lead to only a small dip on a YoY basis.
Please note, a 0.66% MoM increase annualizes to 8.2%, while a 0.48% MoM increase annualizes to 5.9%. Therefore, the crowd’s pivot optimism has largely eroded the recent inflation progress, and the fundamentals continue to unfold as expected.
Remember, we warned repeatedly that ‘peak CPI’ is irrelevant. In reality, what matters is how much economic pain is required to normalize the metric to 2%; and with history highlighting the difficulty of achieving this goal, inflation’s propensity to jump around is far from priced in, and a higher FFR should drastically shift sentiment over the medium term.
On top of that, we also warned on numerous occasions that wage inflation is the canary in the coal mine. In a nutshell: with Americans' ability and willingness to spend poised to keep inflation uplifted, it puts more pressure on the Fed to suppress demand.
Likewise, with 26 states implementing minimum wage increases in 2023, the misguided policy will only spur more inflation. Holly Sklar, CEO of Business for a Fair Minimum Wage, said:
“Putting needed raises in minimum wage workers’ pockets [is] really the most efficient way you can boost the economy. Those are the people who have to go right back around and spend it.”
As a result, while she views the initiative as a positive, the strategy is akin to putting out a fire by pouring on more gasoline.
Please see below:
 Source: CNBC
Overall, silver has outperformed gold in recent weeks, but our experience shows that this phenomenon is bearish. So, while the white metal remains uplifted for now, the fundamentals signal a drastically different outcome over the medium term.
The Bottom Line
Absent liquidations, money has to go somewhere in the financial markets; and with the PMs currently in vogue, the algorithms see little reason to shift their allocations. But the fundamentals remain profoundly bearish, and many of the issues that plagued the PMs in 2021 and 2022 are far from resolved. As such, we’ve seen the price action cloud investors’ judgment before, and this iteration looks no different.
In conclusion, the PMs rallied on Jan. 3, despite the S&P 500’s drawdown. Moreover, while the USD Index rose, the U.S. 10-Year real yield declined by five basis points. However, we expect both metrics to hit new highs in the months ahead.
Overview of the Upcoming Part of the Decline
- It seems to me that the corrective upswing is over (or about to be over) and that the next big move lower is already underway (or that it’s about to start).
- If we see a situation where miners slide in a meaningful and volatile way while silver doesn’t (it just declines moderately), I plan to – once again – switch from short positions in miners to short positions in silver. At this time, it’s too early to say at what price levels this could take place and if we get this kind of opportunity at all – perhaps with gold prices close to $1,500 - $1,550.
- I plan to switch from the short positions in junior mining stocks or silver (whichever I’ll have at that moment) to long positions in junior mining stocks when gold / mining stocks move to their 2020 lows (approximately). While I’m probably not going to write about it at this stage yet, this is when some investors might consider getting back in with their long-term investing capital (or perhaps 1/3 or 1/2 thereof).
- I plan to return to short positions in junior mining stocks after a rebound – and the rebound could take gold from about $1,450 to about $1,550, and it could take the GDXJ from about $20 to about $24. In other words, I’m currently planning to go long when GDXJ is close to $20 (which might take place when gold is close to $1,450), and I’m planning to exit this long position and re-enter the short position once we see a corrective rally to $24 in the GDXJ (which might take place when gold is close to $1,550).
- I plan to exit all remaining short positions once gold shows substantial strength relative to the USD Index while the latter is still rallying. This may be the case with gold prices close to $1,400 and GDXJ close to $15 . This moment (when gold performs very strongly against the rallying USD and miners are strong relative to gold after its substantial decline) is likely to be the best entry point for long-term investments, in my view. This can also happen with gold close to $1,400, but at the moment it’s too early to say with certainty.
- The above is based on the information available today, and it might change in the following days/weeks.
You will find my general overview of the outlook for gold on the chart below:
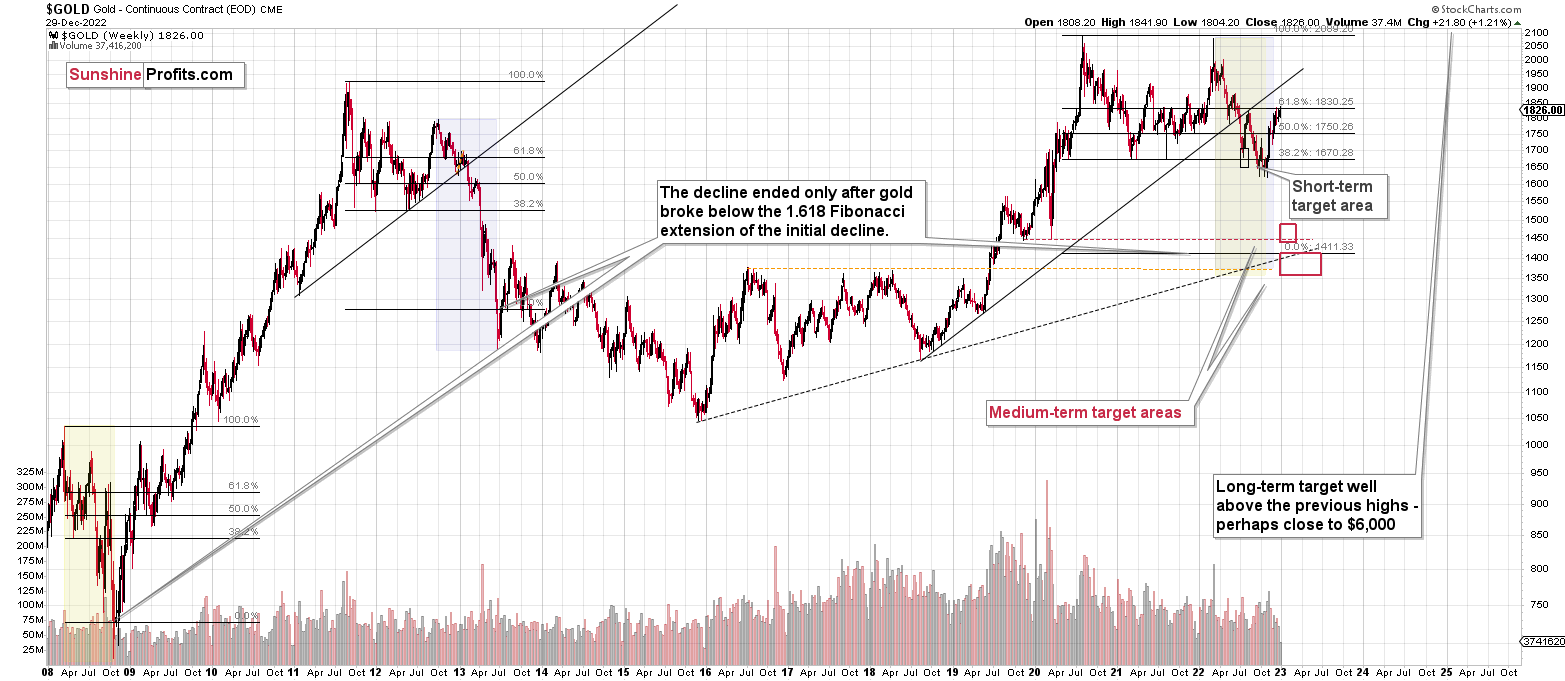
Please note that the above timing details are relatively broad and “for general overview only” – so that you know more or less what I think and how volatile I think the moves are likely to be – on an approximate basis. These time targets are not binding nor clear enough for me to think that they should be used for purchasing options, warrants, or similar instruments.
Letters to the Editor
We received a few messages over e-mail, but as we are moving to our new Golden Meadow platform, we will be transferring them below the articles as comments – and that’s where we’ll be replying to them.
On the platform, please ask your questions below the articles or in the spaces called “Ask the Community” or “Position Sizes” directly – it will help us deliver a reply sooner. In some cases, someone from the community might reply and help even before we do.
Please remember about the Pillars of our Community, especially about the Kindness of Speech Pillar.
Also, if there’s anything that you’re unhappy with, it’s best to send us a message at [email protected].
Please note that this section is going to go away within the next 1-8 weeks, as you can add comments/questions below the article on Golden Meadow – the platform that we’re using to provide our analyses. Your notification e-mails include an invitation link that allows you to access the “Gold Trading Alerts” space.
Also, if you haven’t had the chance to see the video, in which I’m talking about the new platform and why we essentially moved from Sunshine Profits to Golden Meadow, I strongly encourage you to do so:
Summary
Summing up, it seems that the major bottom in the USD Index is in, while the correction in stocks, gold, silver, and mining stocks is over or very close to being over.
The nature of the recent corrections was mostly technical and rumor-based. The rumor was that the Fed would be making a dovish U-turn soon, and it recently became clear that this was not going to be the case. Consequently, the corrective upswing is likely to be reversed, and medium-term downtrends are likely to resume.
In my opinion, the current trading position is going to become profitable in the following weeks, and quite possibly in the following days. And while I can’t promise any kind of performance, I fully expect it to become very profitable before it’s over and to prolong our 2022 winning streak.
After the final sell-off (that takes gold to about $1,350-$1,500), I expect the precious metals to rally significantly. The final part of the decline might take as little as 1-5 weeks, so it's important to stay alert to any changes.
As always, we'll keep you – our subscribers – informed.
To summarize:
Trading capital (supplementary part of the portfolio; our opinion): Full speculative short positions (300% of the full position) in junior mining stocks are justified from the risk to reward point of view with the following binding exit profit-take price levels:
Mining stocks (price levels for the GDXJ ETF): binding profit-take exit price: $20.32; stop-loss: none (the volatility is too big to justify a stop-loss order in case of this particular trade)
Alternatively, if one seeks leverage, we’re providing the binding profit-take levels for the JDST (2x leveraged). The binding profit-take level for the JDST: $22.87; stop-loss for the JDST: none (the volatility is too big to justify a SL order in case of this particular trade).
For-your-information targets (our opinion; we continue to think that mining stocks are the preferred way of taking advantage of the upcoming price move, but if for whatever reason one wants / has to use silver or gold for this trade, we are providing the details anyway.):
Silver futures downside profit-take exit price: $14.32
SLV profit-take exit price: $13.42
ZSL profit-take exit price: $48.87
Gold futures downside profit-take exit price: $1,504
HGD.TO – alternative (Canadian) 2x inverse leveraged gold stocks ETF – the upside profit-take exit price: $16.47
HZD.TO – alternative (Canadian) 2x inverse leveraged silver ETF – the upside profit-take exit price: $36.87
Long-term capital (core part of the portfolio; our opinion): No positions (in other words: cash)
Insurance capital (core part of the portfolio; our opinion): Full position
Whether you’ve already subscribed or not, we encourage you to find out how to make the most of our alerts and read our replies to the most common alert-and-gold-trading-related-questions.
Please note that we describe the situation for the day that the alert is posted in the trading section. In other words, if we are writing about a speculative position, it means that it is up-to-date on the day it was posted. We are also featuring the initial target prices to decide whether keeping a position on a given day is in tune with your approach (some moves are too small for medium-term traders, and some might appear too big for day-traders).
Additionally, you might want to read why our stop-loss orders are usually relatively far from the current price.
Please note that a full position doesn't mean using all of the capital for a given trade. You will find details on our thoughts on gold portfolio structuring in the Key Insights section on our website.
As a reminder - "initial target price" means exactly that - an "initial" one. It's not a price level at which we suggest closing positions. If this becomes the case (as it did in the previous trade), we will refer to these levels as levels of exit orders (exactly as we've done previously). Stop-loss levels, however, are naturally not "initial", but something that, in our opinion, might be entered as an order.
Since it is impossible to synchronize target prices and stop-loss levels for all the ETFs and ETNs with the main markets that we provide these levels for (gold, silver and mining stocks - the GDX ETF), the stop-loss levels and target prices for other ETNs and ETF (among other: UGL, GLL, AGQ, ZSL, NUGT, DUST, JNUG, JDST) are provided as supplementary, and not as "final". This means that if a stop-loss or a target level is reached for any of the "additional instruments" (GLL for instance), but not for the "main instrument" (gold in this case), we will view positions in both gold and GLL as still open and the stop-loss for GLL would have to be moved lower. On the other hand, if gold moves to a stop-loss level but GLL doesn't, then we will view both positions (in gold and GLL) as closed. In other words, since it's not possible to be 100% certain that each related instrument moves to a given level when the underlying instrument does, we can't provide levels that would be binding. The levels that we do provide are our best estimate of the levels that will correspond to the levels in the underlying assets, but it will be the underlying assets that one will need to focus on regarding the signs pointing to closing a given position or keeping it open. We might adjust the levels in the "additional instruments" without adjusting the levels in the "main instruments", which will simply mean that we have improved our estimation of these levels, not that we changed our outlook on the markets. We are already working on a tool that would update these levels daily for the most popular ETFs, ETNs and individual mining stocks.
Our preferred ways to invest in and to trade gold along with the reasoning can be found in the how to buy gold section. Furthermore, our preferred ETFs and ETNs can be found in our Gold & Silver ETF Ranking.
As a reminder, Gold & Silver Trading Alerts are posted before or on each trading day (we usually post them before the opening bell, but we don't promise doing that each day). If there's anything urgent, we will send you an additional small alert before posting the main one.
Thank you.
Przemyslaw K. Radomski, CFA
Founder, Editor-in-chief

