

Briefly: In our opinion, full (150% of the regular full position) speculative short positions in gold, silver and mining stocks are justified from the risk/reward perspective at the moment of publishing this alert.
Silver and mining stocks declined for yet another day, but this time gold ended the session with a (slight, but still) gain. How can we interpret the latter? Is it a sign of strength?
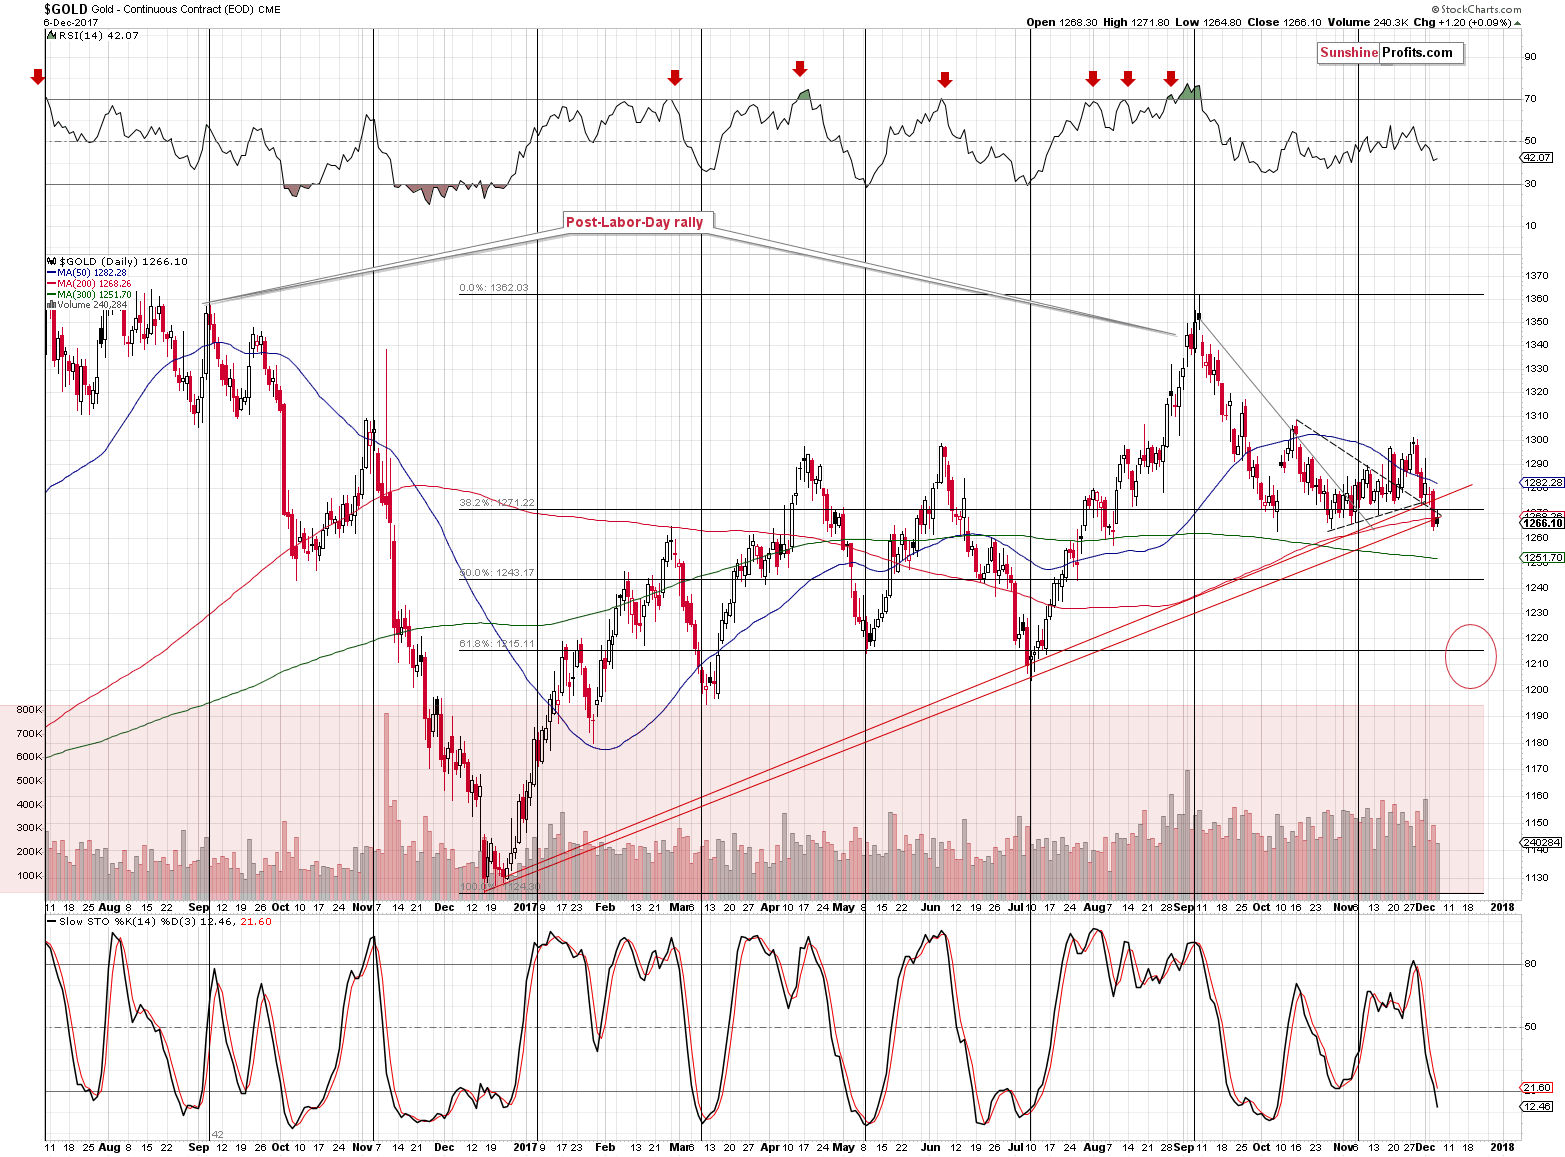
In short, not at all. In yesterday’s alert we emphasized that gold’s breakdown was one of the key developments that one should consider while analyzing the precious metals market. The tiny upswing that we saw in gold yesterday was a classic example of a post-breakout pause. Let’s take a closer look (chart courtesy of http://stockcharts.com).
In yesterday’s alert, we wrote exactly the following:
Gold closed yesterday’s session below both rising support lines, but the most important thing is that it closed it below the line based on the daily closing prices (it’s currently at about $1,275) and that the move below it was rather significant.
The breakdown is not yet confirmed, but it appears that it will be confirmed shortly, especially if the USD continues to move higher. The next support is just above $1,200, so that’s where gold is most likely headed. As discussed earlier today, the bigger the consolidation, the bigger the move is likely to follow and in this case, it means that gold should move visibly lower, not just several dollars lower. Again, it doesn’t seem that the decline is close to being over – at least not in terms of price.
Another daily close below both rising support lines is a step closer toward a confirmation of the breakdown and the fact that the volume was low adds to the credibility of the bearish case. The same goes for today’s pre-market action. At the moment of writing these words, gold is about $5 lower, so the odds are that the session will end below the rising support/resistance lines once again and that the breakdown will be fully confirmed.
The mentioned lines are clearly visible, so it’s very likely that this breakdown will be viewed as a key technical development for many traders and that it will result in lower prices relatively soon.
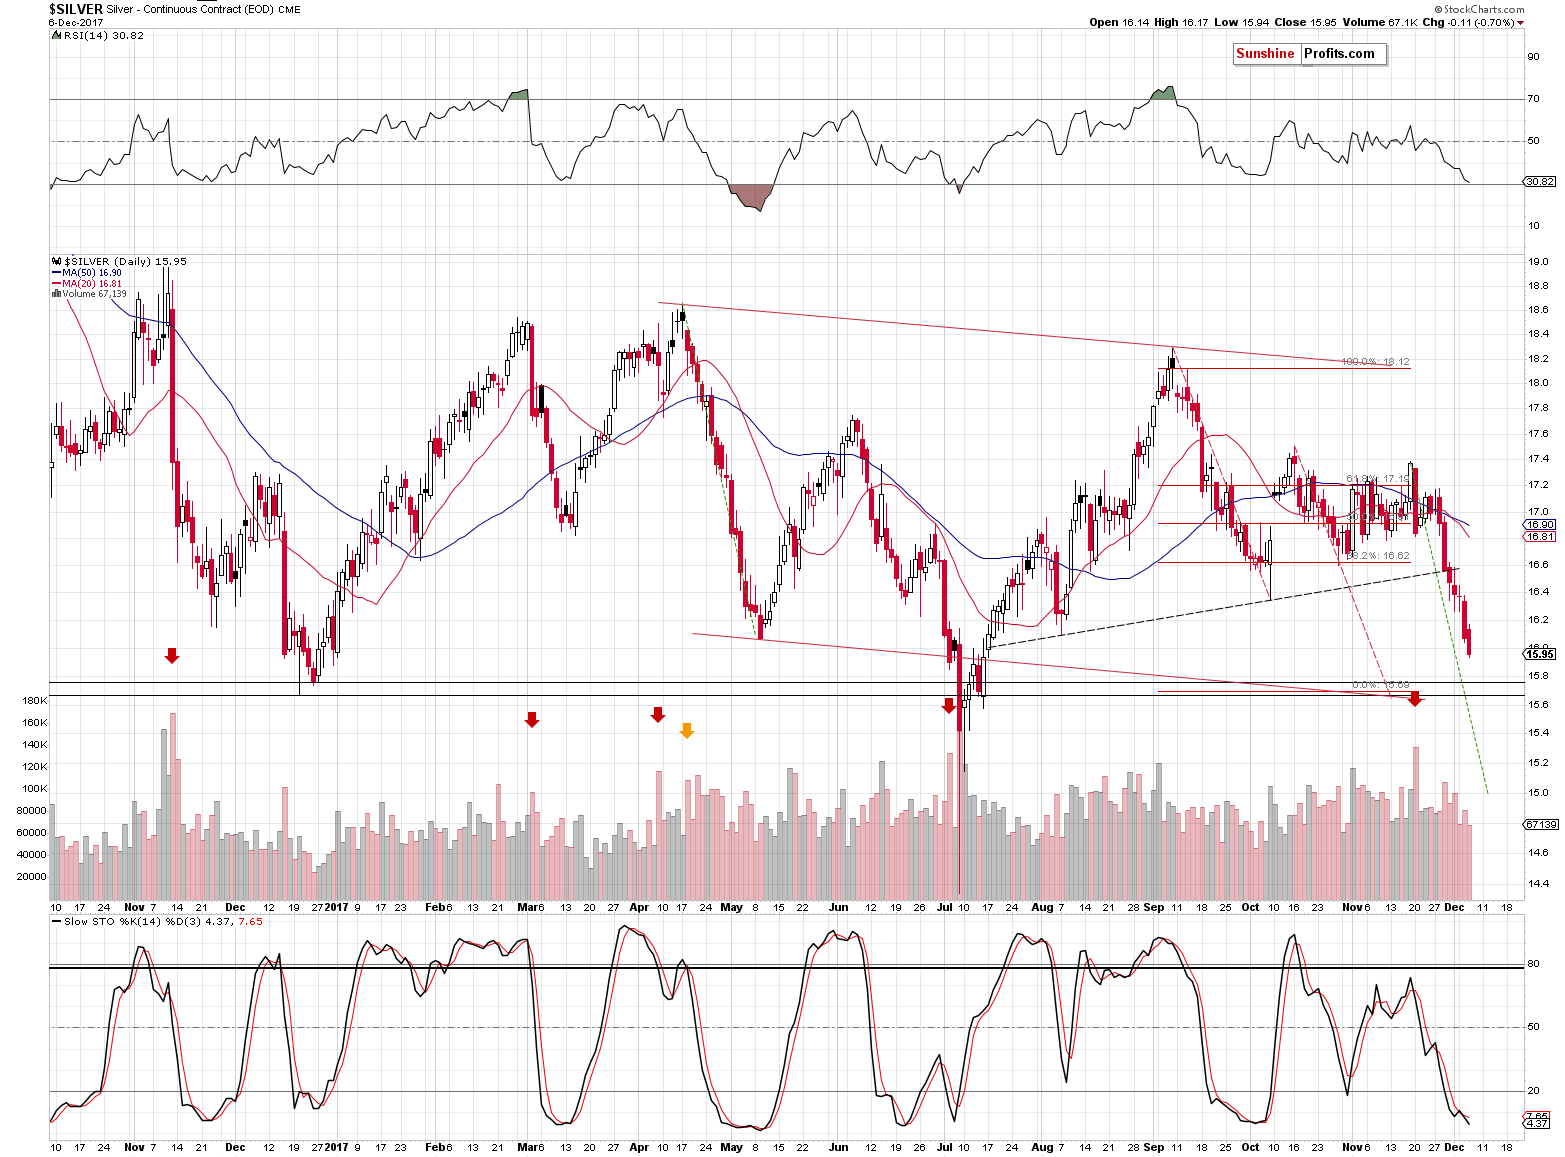
Meanwhile, the price of silver continues to march lower. Everything that we wrote previously about the white metal remains up-to-date:
The silver price is already at about $16 and the price target between $15.60 and $15.80 is now very close. However, if gold is going to slide to $1,210 or so, then silver’s bottom between $15.60 and $15.80 would imply a lot of strength in the latter. The problem is that there is no reason to assume such strength in the white metal as it’s been declining more than gold in the past several days. Naturally, this tendency could reverse, but so far we see no signs thereof.
So, if silver is going to move below $15.60 to be in greater tune with gold, then what price level could stop it?
It seems best to use comparative analysis and there are two ways in which we can approach it. One is to assume that the gold to silver ratio will not change and that the decline will be directly proportional. With gold at $1,268 and the target at $1,210, this means a decline of about 4.6%. An analogous decline in silver would imply a move to $15.37. This seems to be too high, because after all silver has been underperforming the yellow metal.
The second way to approach the situation is to check for the size of the most recent move and see how much thereof will need to be repeated for the target to be reached. This approach is more dynamic as it takes into account the most recent trends in both markets. We’ll use the “recent high – yesterday’s close” comparison. Gold moved from $1,301.30 to $1,264.90 – it declined by $36.4. In order to bottom at $1,210, it needs to decline by an additional $54.90. This means that it would need to decline by about 150% of what it has already declined.
Silver already declined from $17.18 to $16.07, which is a $1.11 move. 150% of $1.11 is $1.665. Deducting the above from yesterday’s close provides us with a target of approximately $14.40, which is almost exactly at July’s crazy overnight bottom. This level may seem ridiculous, but well, that’s exactly what may be in the cards.
How to translate it into profit-take levels? It seems that it will be better to be more extreme than conservative because we are mainly basing the entire targets on gold and the USD (and the miners’ relative strength, but the latter is definitely not present at this time) and if the above markets point to a temporary reversal, we will close the silver position anyway. Consequently, even if the short position is not closed automatically as the profit-take level is too low, we will still most likely close it at a favorable level thanks to the gold and USD analysis. If, however, we have the exit level too high, we will be thrown out of the market and we might miss a large part of the move and there will be little that we could do about it afterwards.
The one thing that we would like to add today is that silver just broke below its May bottom and since it continues to move lower in today’s pre-market trading, it seems that the breakdown will be confirmed.
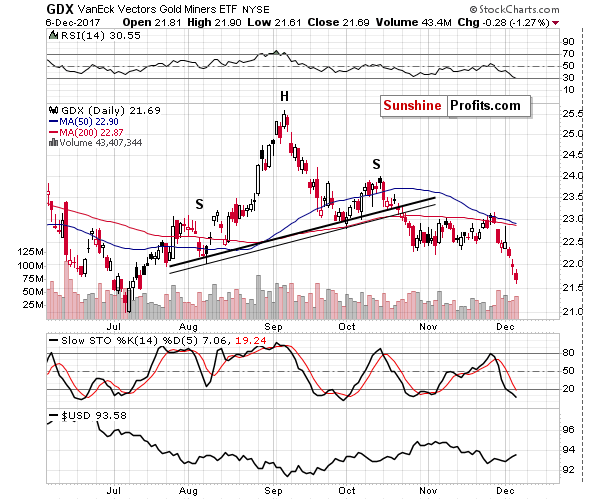
Mining stocks continued to decline and underperform gold and it can’t be explained by looking at the general stock market – it paused yesterday and the past few months saw almost consistently higher S&P 500 levels. The implications of yesterday’s session are clearly bearish. Moreover, we realize that we wrote this dozens of times, but it’s worth repeating once again – the extent to which mining stocks underperform gold and the time in which they’ve been doing so (months) is a major confirmation of the analogy between the current situation and the pre-2013 slide. The implications are extremely bearish for the following weeks and months… Especially that we just saw a major breakdown.
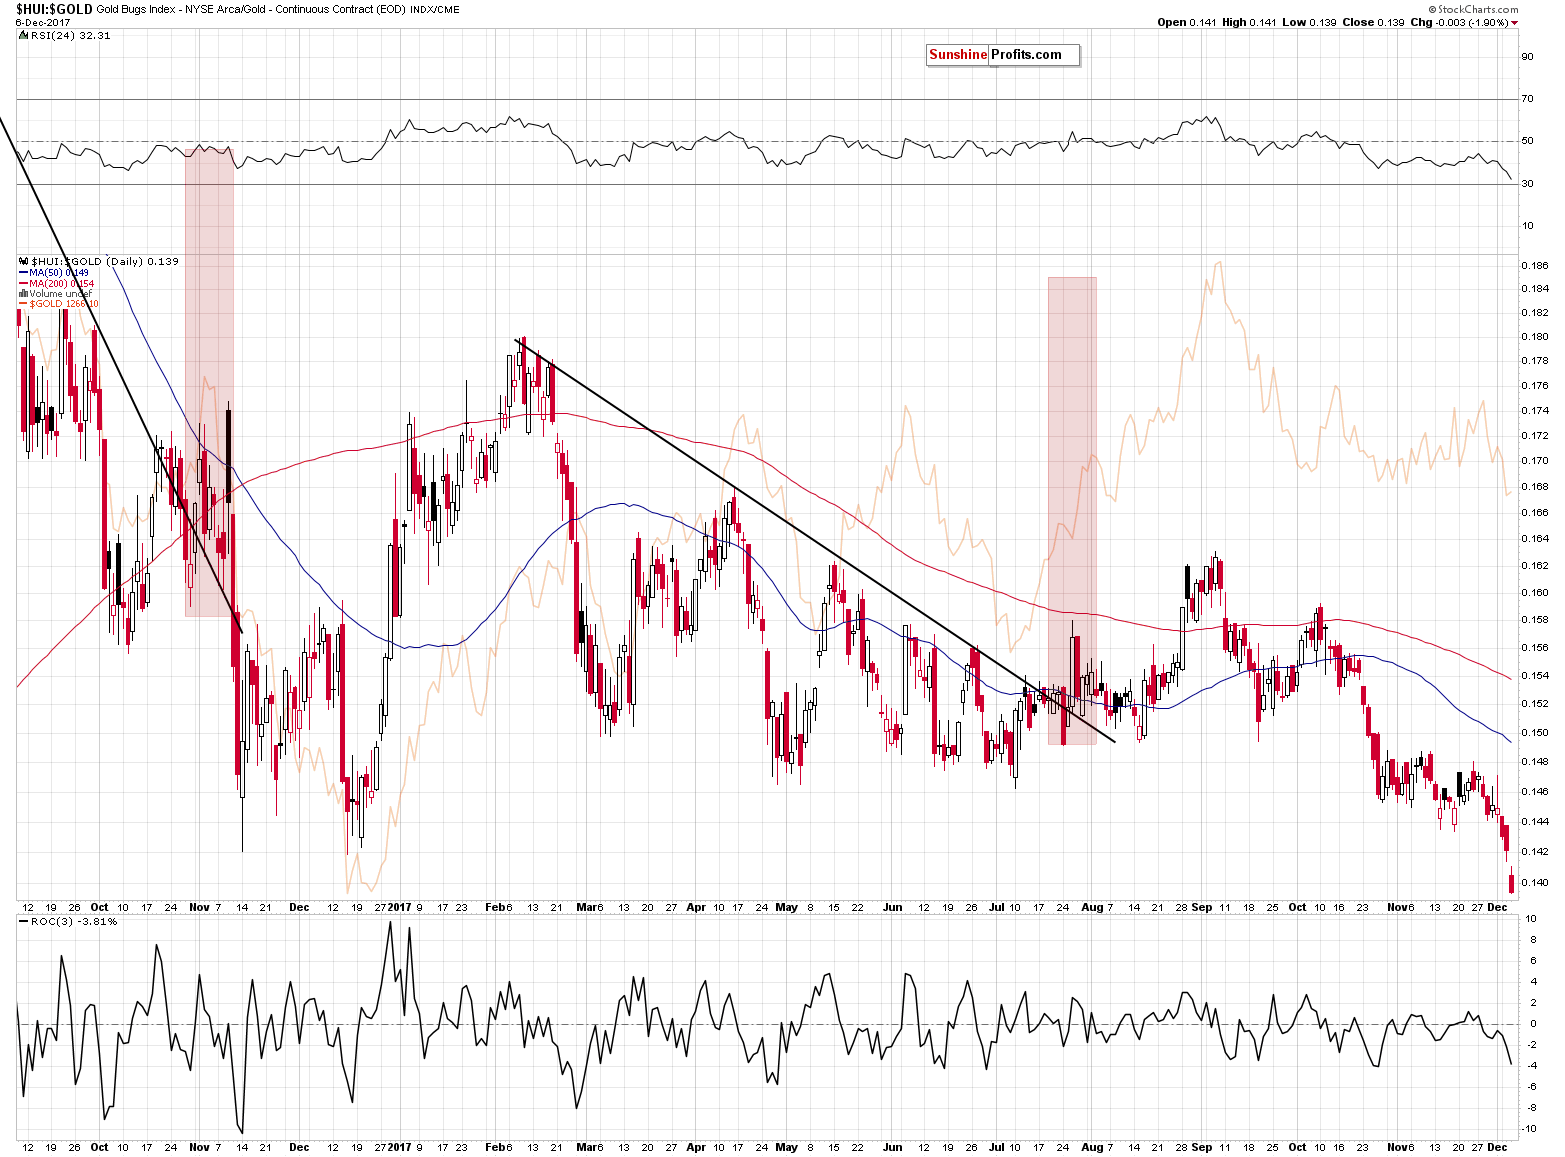
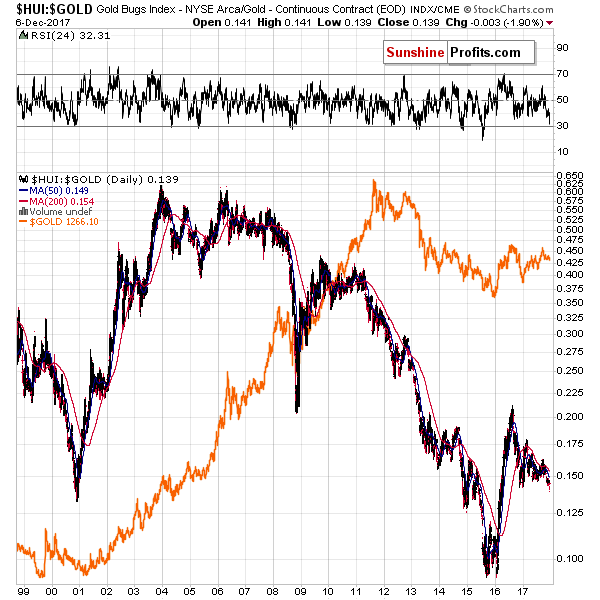
The gold stocks to gold ratio just broke decisively below its 2016 bottom. The breakdown was already visible based on Tuesday’s closing prices, but it was tiny. It was yesterday’s price action that made it clear.
The long-term chart shows that the implications are much bigger than it might appear at first sight. The reason is that there is almost no important support all the way down until the 2015 bottom (below 0.1) with the small exceptions of the 2000 low and the 2014 low.
Interestingly, both mentioned lows took place in the final part of the respective years, which makes it quite likely that we could see a temporary turnaround from those levels this month. If the ratio was to temporarily (!) bottom at about 0.13 and gold was to bottom at about $1,220, then this implies a target for the HUI Index just a little below 160. In yesterday’s alert, we wrote about 163 as the likely temporary target based on a dynamic analogy to the size of the decline that we had already seen. The above charts seem to confirm it.
Summing up, it seems that the decline in the precious metals market is not very close to being over. We might see a visible corrective upswing next week, but this correction could start at much lower levels based on the breakdown in gold and the way PMs react to the changes in the USD Index. For now, the outlook remains bearish and there are myriads of signals that support a decline in the price of gold in December.
As always, we will keep you – our subscribers – informed.
To summarize:
Trading capital (supplementary part of the portfolio; our opinion): Short positions (150% of the full position) in gold, silver and mining stocks are justified from the risk/reward perspective with the following stop-loss orders and exit price levels / profit-take orders:
- Gold: exit price: $1,218; stop-loss: $1,366; exit price for the DGLD ETN: $51.98; stop-loss for the DGLD ETN $38.74
- Silver: exit price: $14.63; stop-loss: $19.22; exit price for the DSLV ETN: $33.88; stop-loss for the DSLV ETN $17.93
- Mining stocks (price levels for the GDX ETF): exit price: $19.22; stop-loss: $26.34; exit price for the DUST ETF: $39.88; stop-loss for the DUST ETF $21.37
In case one wants to bet on junior mining stocks' prices (we do not suggest doing so – we think senior mining stocks are more predictable in the case of short-term trades – if one wants to do it anyway, we provide the details), here are the stop-loss details and exit prices:
- GDXJ ETF: exit price: $27.82; stop-loss: $45.31
- JDST ETF: exit price: $94.88 stop-loss: $43.12
Long-term capital (core part of the portfolio; our opinion): No positions (in other words: cash)
Insurance capital (core part of the portfolio; our opinion): Full position
Important Details for New Subscribers
Whether you already subscribed or not, we encourage you to find out how to make the most of our alerts and read our replies to the most common alert-and-gold-trading-related-questions.
Please note that the in the trading section we describe the situation for the day that the alert is posted. In other words, it we are writing about a speculative position, it means that it is up-to-date on the day it was posted. We are also featuring the initial target prices, so that you can decide whether keeping a position on a given day is something that is in tune with your approach (some moves are too small for medium-term traders and some might appear too big for day-traders).
Plus, you might want to read why our stop-loss orders are usually relatively far from the current price.
Please note that a full position doesn’t mean using all of the capital for a given trade. You will find details on our thoughts on gold portfolio structuring in the Key Insights section on our website.
As a reminder – “initial target price” means exactly that – an “initial” one, it’s not a price level at which we suggest closing positions. If this becomes the case (like it did in the previous trade) we will refer to these levels as levels of exit orders (exactly as we’ve done previously). Stop-loss levels, however, are naturally not “initial”, but something that, in our opinion, might be entered as an order.
Since it is impossible to synchronize target prices and stop-loss levels for all the ETFs and ETNs with the main markets that we provide these levels for (gold, silver and mining stocks – the GDX ETF), the stop-loss levels and target prices for other ETNs and ETF (among other: UGLD, DGLD, USLV, DSLV, NUGT, DUST, JNUG, JDST) are provided as supplementary, and not as “final”. This means that if a stop-loss or a target level is reached for any of the “additional instruments” (DGLD for instance), but not for the “main instrument” (gold in this case), we will view positions in both gold and DGLD as still open and the stop-loss for DGLD would have to be moved lower. On the other hand, if gold moves to a stop-loss level but DGLD doesn’t, then we will view both positions (in gold and DGLD) as closed. In other words, since it’s not possible to be 100% certain that each related instrument moves to a given level when the underlying instrument does, we can’t provide levels that would be binding. The levels that we do provide are our best estimate of the levels that will correspond to the levels in the underlying assets, but it will be the underlying assets that one will need to focus on regarding the signs pointing to closing a given position or keeping it open. We might adjust the levels in the “additional instruments” without adjusting the levels in the “main instruments”, which will simply mean that we have improved our estimation of these levels, not that we changed our outlook on the markets. We are already working on a tool that would update these levels on a daily basis for the most popular ETFs, ETNs and individual mining stocks.
Our preferred ways to invest in and to trade gold along with the reasoning can be found in the how to buy gold section. Additionally, our preferred ETFs and ETNs can be found in our Gold & Silver ETF Ranking.
As a reminder, Gold & Silver Trading Alerts are posted before or on each trading day (we usually post them before the opening bell, but we don't promise doing that each day). If there's anything urgent, we will send you an additional small alert before posting the main one.
=====
Latest Free Trading Alerts:
This week, the WGC released a market update entitled “Technology – a brighter outlook?”. What are the main conclusions of the report?
Will Technology Spur Gold Demand?
S&P 500 index was unchanged on Wednesday, as investors continued to hesitate following recent record-breaking run-up. Will uptrend extend? Or is this some topping pattern ahead of medium-term downward correction?
More Uncertainty, As Stock Market Indexes Trade Along New Record Highs
=====
Hand-picked precious-metals-related links:
PRECIOUS-Gold slides to 4-month low as dollar edges up
Gold's Cycle Shows Metal May Retest Lows of $1,050 - Wells Fargo's 2018 Outlook
Newmont Poised to Oust Barrick as World's Top Gold Producer
This Gold Dealer Is Now Selling More Bitcoin Than Precious Metals
51% of Respondents Chooses Bitcoin Over Gold and Fiat: Ron Paul Survey
WGC: World Official Gold Holdings, December 2017
=====
In other news:
Dollar hits two-week high on U.S. tax reform optimism, world shares climb
Pound Halts Two-Day Slide as May Plans Last-Ditch Brexit Offer
Bitcoin soars past $15,000, just hours after crossing $14,000
Gaming platform Steam ditches bitcoin support, citing 'high fees and volatility'
=====
Thank you.
Sincerely,
Przemyslaw Radomski, CFA
Founder, Editor-in-chief, Gold & Silver Fund Manager
Gold & Silver Trading Alerts
Forex Trading Alerts
Oil Investment Updates
Oil Trading Alerts

