

Briefly: in our opinion, full (300% of the regular position size) speculative short positions in junior mining stocks are justified from the risk/reward point of view at the moment of publishing this Alert.
Today’s analysis is going to be all about gold, and for a good reason. Based on yesterday’s and Monday’s sessions, November is now a down month for gold. Please let that sink in.
Gold ended last week above $1,850, with almost everyone in the market cheering and making bets, on how soon gold will move above $1,900 and then rally to new yearly highs. It was after the completion of the inverse head-and-shoulders pattern, after all!
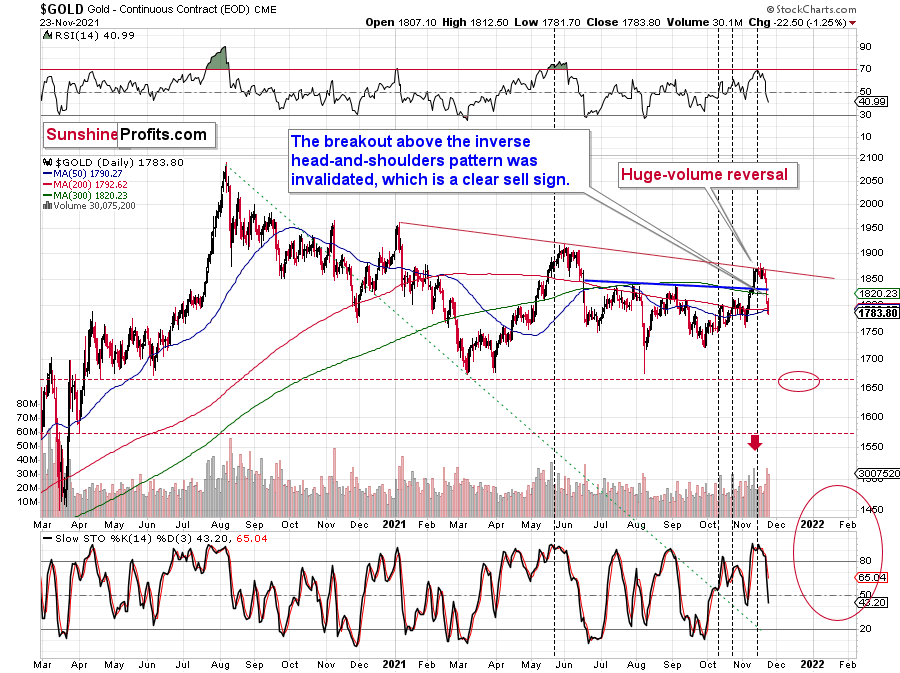
Well, I warned you that there were more long-term-based factors in place than the above-mentioned inverse head-and-shoulders pattern, and since longer-term patterns are more important than the shorter-term-based ones, the outlook was bearish, not bullish.
In fact, it was the very short-term rally that made the outlook bearish, because of three separate time-based indications for a reversal. And I don’t even mean other bearish indications like gold’s invalidation of the small breakout above the declining red resistance line.
Two of the indications that I described previously were the triangle-vertex-based reversals based on the below chart.
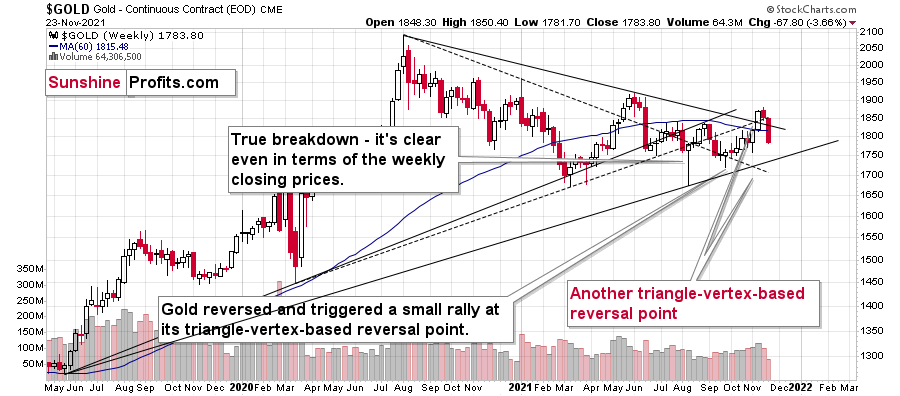
When resistance and support lines cross, markets tend to reverse their previous course. There’s no good logical explanation for why it should work, but it does. Not in every case, and I’m not promising that it will work in all cases, but I’ve seen it work so many times on the precious metals market so that I can say that ignoring these indications is a very costly endeavor.
Another indication came from gold’s long-term chart – its cyclical turning point was pointing to a major reversal, and the preceding move was up. Consequently, gold was likely to top.
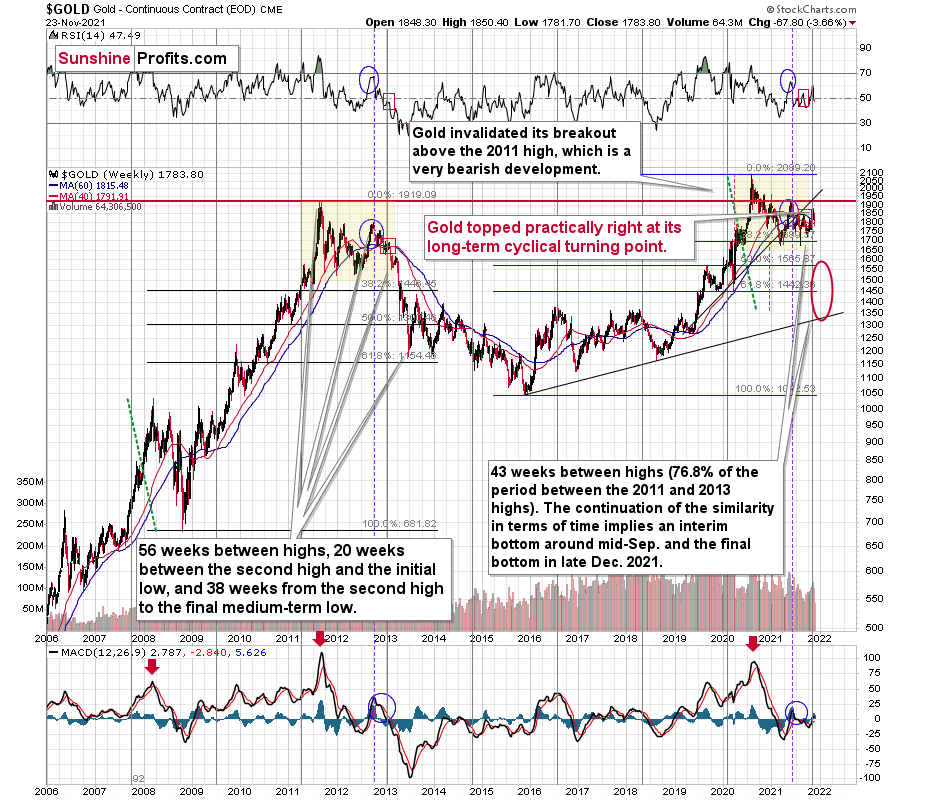
And that’s exactly what it did. Gold moved lower this week and taking into account the weekly high to yesterday’s closing price, it declined by over $100. Not bad for just two days.
But perhaps the most interesting things are now visible on gold’s monthly chart (based on monthly candlesticks).
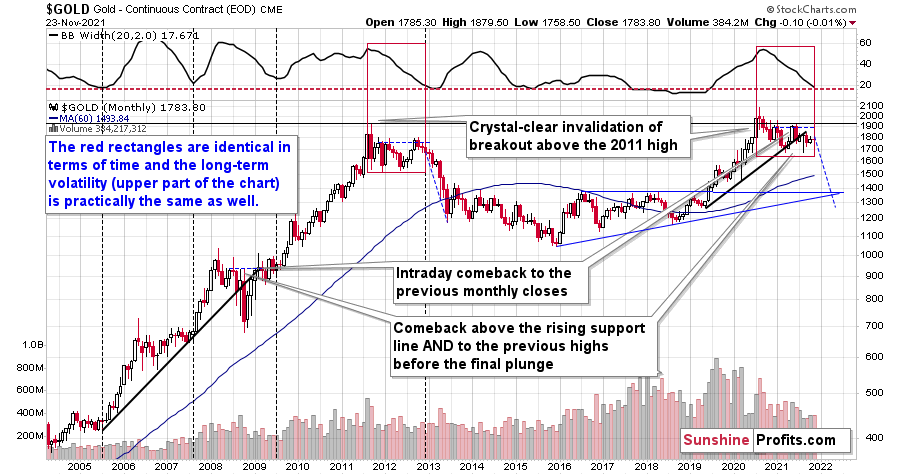
The above chart is loaded with clues. Let’s start with the similarity between now and 2013 that we see from this perspective.
The consolidation is similar not only in terms of the shape of the price move but also in terms of the decline in long-term volatility. The upper part of the above chart represents the width of the Bollinger Bands – a tool that is based on the volatility of the market. In short, greater volatility means broader Bands, meaning the above indicator would move higher. So, it’s essentially a proxy for volatility. Since we’re using monthly candlesticks here, it’s a proxy for long-term volatility.
Please note that the BB width not only moved from similar levels in 2011 and 2020 to similar levels in late-2012 and now, but it took approximately the same time to get there (if we start both moves with the final monthly high).
The interesting thing about long-term volatility is that periods of low volatility tend to be followed by periods of high volatility – in either way. I marked four previous cases when we saw very low volatility after gold’s several-year-long rally, and it was indeed very close to the start of big moves.
One of those cases was the late-2012 case, which appears similar to what we see right now. Consequently, gold is likely to move quite significantly in the following months.
If the similarity to 2013 continues, gold would be likely to decline just as the blue dashed line suggests. This implies a move below $1,300. Will gold indeed decline to that low?
I doubt it, as there’s very strong support a bit below $1,400. It’s based on the previous highs and the rising support line based on the 2015 and 2018 lows.
The decline to those levels would have been enough of a reaction that was likely to follow the failed 2020 breakout above the 2011 highs. Invalidations of breakouts are strong “sell” signals, and invalidation of a breakout, that was extremely important (as well as a breakout to a new all-time high), is likely to have very dire consequences.
Summing up, gold declined in tune with my long-term-based indications and the medium-term downtrend appears to have resumed. Based on the analogy to 2013 and other factors, a bigger decline in gold appears to be just around the corner (regardless of what happens in the very near term).
Having said that, let’s take a look at the markets from a more fundamental angle.
The Tag Team
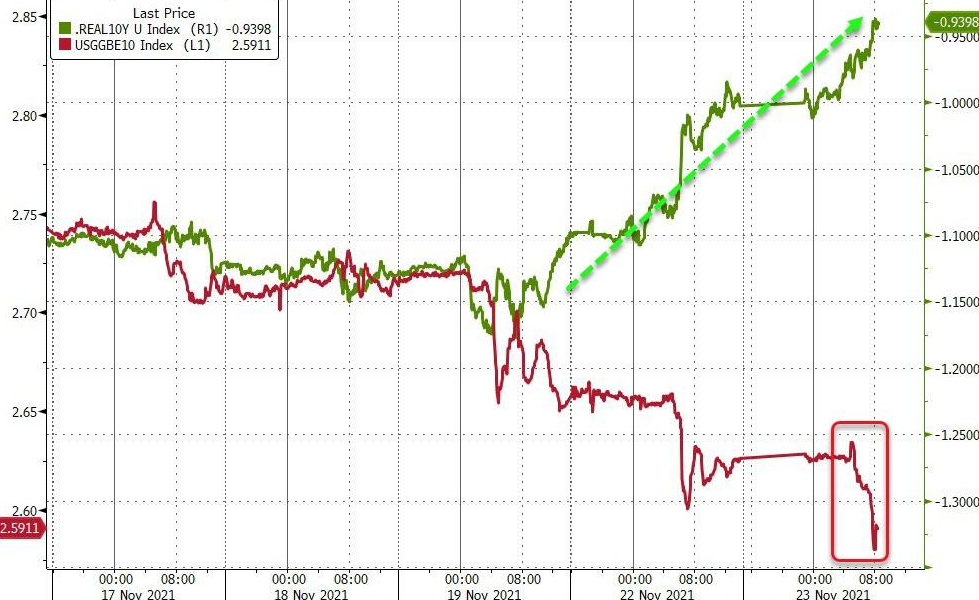
With the USD Index and U.S. Treasury yields taking turns imposing their will on the PMs, the latter's uprising sparked the latest fundamental damage. To explain, after U.S. Treasury yields surged on Nov. 22, the momentum continued on Nov. 23.
Please see below:
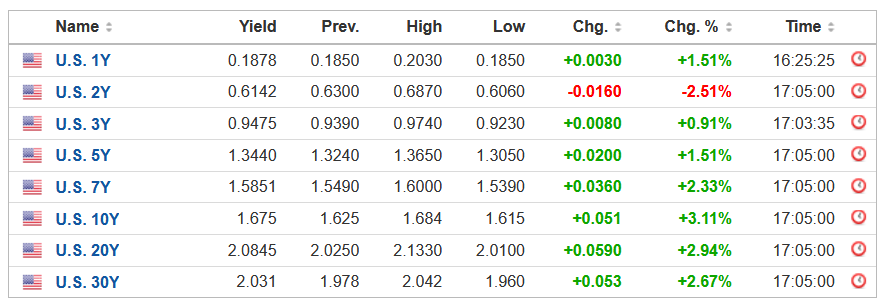 Source: Investing.com
What's more, with 'the war on inflation' now underway, a hawkish Fed helped re-ignite the bond market's fervor. And with the U.S. 10-Year Treasury yield reprising its role from 2009-2010, all signs point to a continued uprising over the medium term.
Please see below:
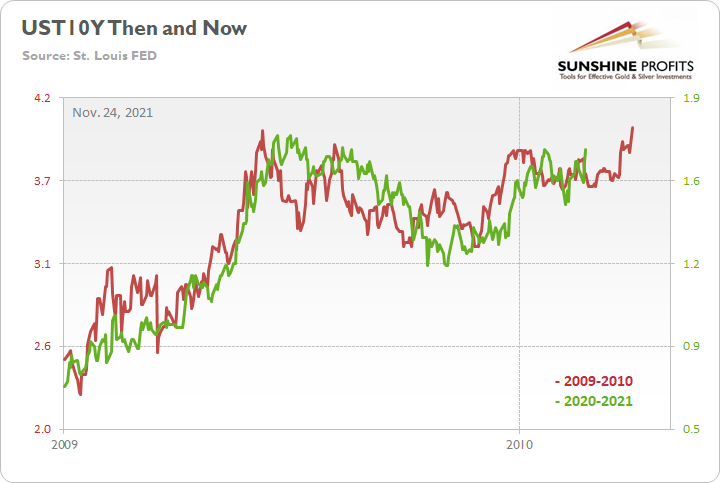
To explain, the red line above tracks the U.S. 10-Year Treasury yield’s rally off of the bottom in 2009-2010, while the green line above tracks the U.S. 10-Year Treasury yield’s current move. If you analyze the fits and starts, you can see that excessive optimism often gives way to excessive pessimism. However, after the dust settled in 2009, the U.S. 10-Year Treasury yield continued its uptrend and ultimately made a new high.
For context, the yield fell off a cliff in April 2010 before another sharp rally ensued in October 2010 (which recouped most of the losses). However, the important point is that the second cliff arrived roughly four months after the U.S. 10-Year Treasury yield recorded its second bottom. As a result, with the pace of the current economic recovery tracking well ahead of 2009, it will likely take a Black Swan event to keep the U.S. 10-Year Treasury yield from following a similar script.
To that point, IHS Markit released its U.S. Composite PMI on Nov. 23. And with inflation showing no signs of slowing down, all-time highs are now uttered on a monthly basis.
Regarding the U.S. manufacturing sector:
“In line with difficulties sourcing inputs and finding affordable transportation for goods, cost burdens rose at a series record pace in November (since May 2007). In an effort to pass on higher costs to customers, firms increased their selling prices at the second-steepest pace in over 14-and-a-half years of data collection”.
Regarding the U.S. service sector:
“Inflationary pressures continued to soar midway through the fourth quarter, as the rate of increase in input prices quickened to a six-month high. A combination of marked supplier price hikes and vast increases in wage bills reportedly drove cost burdens up. Firms were able to partially pass on higher costs though, as the rate of charge inflation reached a fresh series high”.
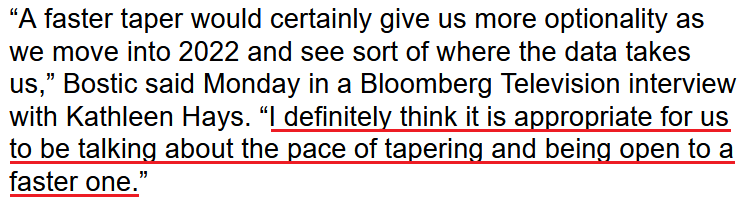
And with the writing largely on the wall, Atlanta Fed President Raphael Bostic is also advocating for a faster taper (joining Clarida and Waller). For context, the Fed’s taper is/was expected to conclude in June 2022 (ahead of the precedent set in 2013/2014). However, on Nov. 22, when asked if he would support completing the taper by the end of Q1 2022, Bostic said:
“That timing I would be comfortable with given the way the data has come in recently”.
Again, the end of Q1 implies the end of QE by the end of March 2022. As a result, not only has the hawkish rhetoric been amplified in recent days, but I’ve been warning for months that surging inflation would end up forcing the Fed’s hand.
Please see below:
 Source: Bloomberg
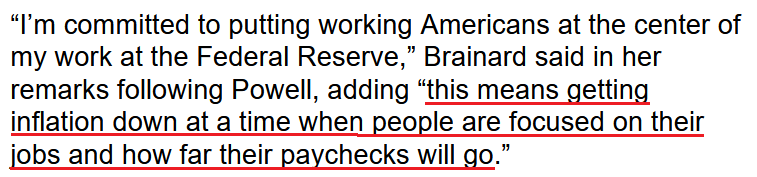
Likewise, while Fed Governor Lael Brainard (who was named the new Vice-Chair) has been preaching monetary patience for months, her acceptance speech indicates that the war on inflation has taken the lead over maximum employment.
Please see below:
 Source: Bloomberg
More importantly, though, with the ‘hawk talk’ rattling the financial markets, the recent rout in the bond market resulted in a surge in the U.S. 10-Year real yield. And with the PMs highly allergenic to rising inflation-adjusted interest rates, I warned on Nov. 11 that positioning for new all-time lows was a risky proposition. I wrote:
The recent decline of the U.S. 10-Year real yield has helped underwrite gold’s recent rally. However, when the U.S. 10-Year real yield rose to a 2021 high of -0.56%, gold hit a 2021 low. And with the metric south of -1.10% and the Fed in the midst of its tightening cycle, the U.S. 10-Year real yield should move higher over the medium term, not lower.
And right on cue, with the U.S. 10-Year real yield rallying to -0.94% on Nov. 23, the benchmark has risen by 23 basis points since bottoming on Nov. 9.
Please see below:
 Source: Bloomberg/ZeroHedge
To explain, the green line above tracks the U.S. 10-Year real yield, while the red line above tracks the U.S. 10-Year breakeven inflation rate. If you analyze the performance of the former, you can see that the real yield has spiked higher in recent days.
Furthermore, the performance of the latter is also material. With 10-year inflation expectations falling while nominal interest rates are rising (which results in higher real interest rates), the epic divergence that I highlight extensively in Monday’s flagship Gold & Silver Trading Alert is slowly unwinding.
Thus, if the dynamic persists, another 2013-style collapse of gold could happen sooner rather than later. To explain, I wrote on May 11:
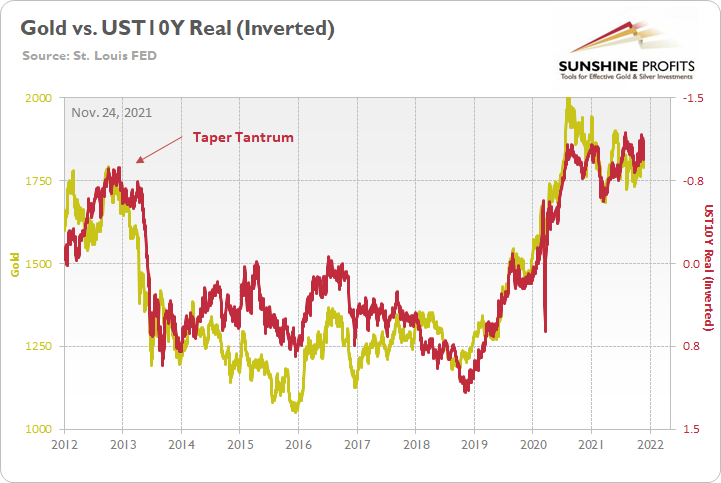
The gold line above tracks the London Bullion Market Association (LBMA) Gold Price, while the red line above tracks the inverted U.S. 10-Year real yield.
If you analyze the left side of the chart, you can see that when the U.S. 10-Year Treasury yield began its move to reconnect with the U.S. 10-Year breakeven inflation rate in 2013 (taper tantrum), the U.S. 10-Year real yield surged (depicted by the red line moving sharply lower). More importantly, though, amidst the chaos, gold plunged by more than $500 in less than six months.
As further evidence, surging inflation is like holding one’s feet to the fire. Eventually, the economic pain becomes so unbearable that policymakers have to exhaust all of their resources to avoid a catastrophe. And with FOMC rhetoric shifting from undeterred to uneasy, a hawkish policy shift is likely next on the docket.
Please see below:
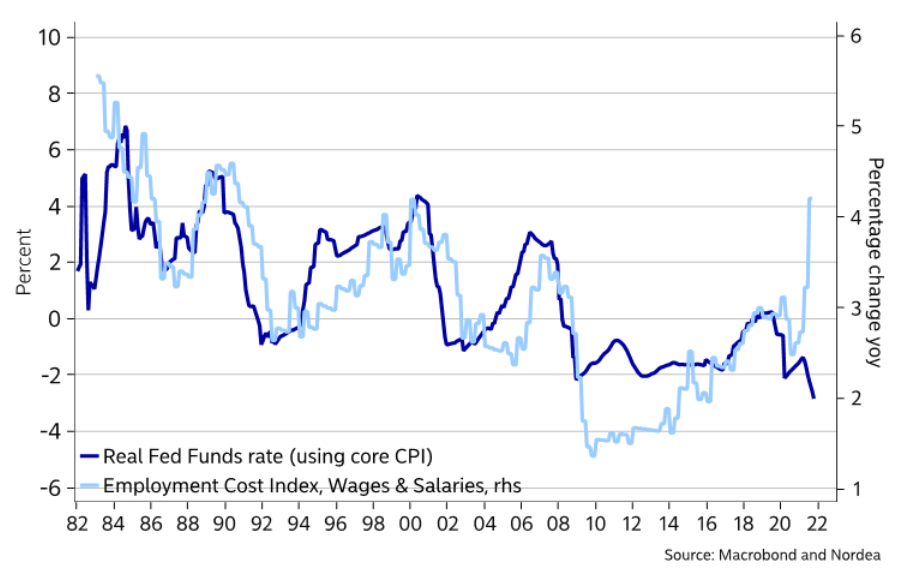
To explain, the dark blue line above tracks the U.S. real federal funds rate, while the light blue line above tracks the year-over-year (YoY) percentage change in the U.S. Employment Cost Index (ECI). If you analyze the roughly 40-year relationship, you can see that surging wage inflation often elicits a hawkish response from the Fed (depicted by both lines moving higher). And with a material divergence present on the right side of the chart, it’s likely only a matter of time before the real federal funds rate moves materially higher.
For context, wage inflation lags input and output inflation. And with wage pressures already accelerating, it means that we’re likely closer to the end of this inflationary cycle (meaning that the Fed will begin to act) than the beginning. More importantly, though, a higher real federal funds rate is extremely bullish for the USD Index and extremely bearish for the PMs.
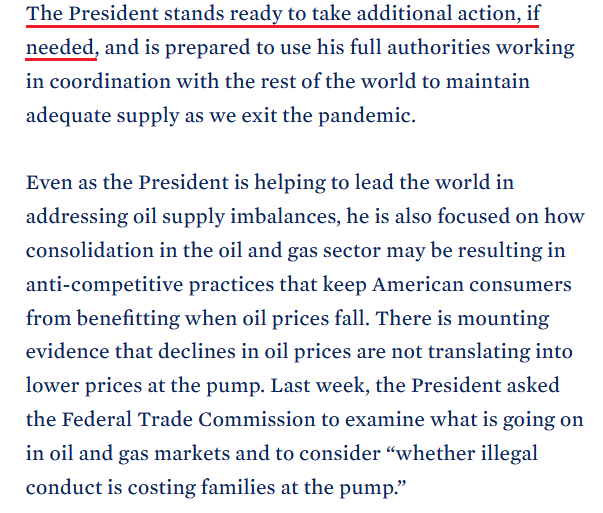
Finally, while the venture backfired on Nov. 23, The White House continued its war on inflation. Announcing that “the Department of Energy will make available releases of 50 million barrels of oil from the Strategic Petroleum Reserve to lower prices for Americans”, U.S. President Joe Biden has continued his all-out offensive. And while oil prices rallied on the day, inflationary pressures are ruffling more than a few feathers in the U.S. government.
 Source: The White House
In conclusion, the PMs declined on Nov. 23, and silver and the GDXJ ETF were the hardest hit. And with more downside likely to materialize over the medium term, the bearish tag team (the USD Index and U.S. Treasury yields) is making its fundamental presence felt. As a result, the PMs’ medium-term outlook remains ominous, and lower lows should commence over the next few months.
Overview of the Upcoming Part of the Decline
- It seems to me that the current corrective upswing in gold is about to be over soon, and the next short-term move lower is about to begin. Since it appears to be another short-term move more than a continuation of the bigger decline, I think that junior miners would be likely to (at least initially) decline more than silver.
- It seems that the first stop for gold will be close to its previous 2021 lows, slightly below $1,700. Then it will likely correct a bit, but it’s unclear if I want to exit or reverse the current short position based on that – it depends on the number and the nature of the bullish indications that we get at that time.
- After the above-mentioned correction, we’re likely to see a powerful slide, perhaps close to the 2020 low ($1,450 - $1,500).
- If we see a situation where miners slide in a meaningful and volatile way while silver doesn’t (it just declines moderately), I plan to – once again – switch from short positions in miners to short positions in silver. At this time, it’s too early to say at what price levels this could take place, and if we get this kind of opportunity at all – perhaps with gold close to $1,600.
- I plan to exit all remaining short positions once gold shows substantial strength relative to the USD Index while the latter is still rallying. This may be the case with gold close to $1,350 - $1,400. I expect silver to fall the hardest in the final part of the move. This moment (when gold performs very strongly against the rallying USD and miners are strong relative to gold after its substantial decline) is likely to be the best entry point for long-term investments, in my view. This can also happen with gold close to $1,375, but at the moment it’s too early to say with certainty. I expect the final bottom to take place near the end of the year, perhaps in mid-December. It is not set in stone that PMs have to bottom at that time. If not then, then early 2022 would become a likely time target.
- As a confirmation for the above, I will use the (upcoming or perhaps we have already seen it?) top in the general stock market as the starting point for the three-month countdown. The reason is that after the 1929 top, gold miners declined for about three months after the general stock market started to slide. We also saw some confirmations of this theory based on the analogy to 2008. All in all, the precious metals sector is likely to bottom about three months after the general stock market tops. The additional confirmation will come from the tapering schedule, as markets are likely to move on the rumor and reverse on the fact as they tend to do in general.
- The above is based on the information available today, and it might change in the following days/weeks.
You will find my general overview of the outlook for gold on the chart below:
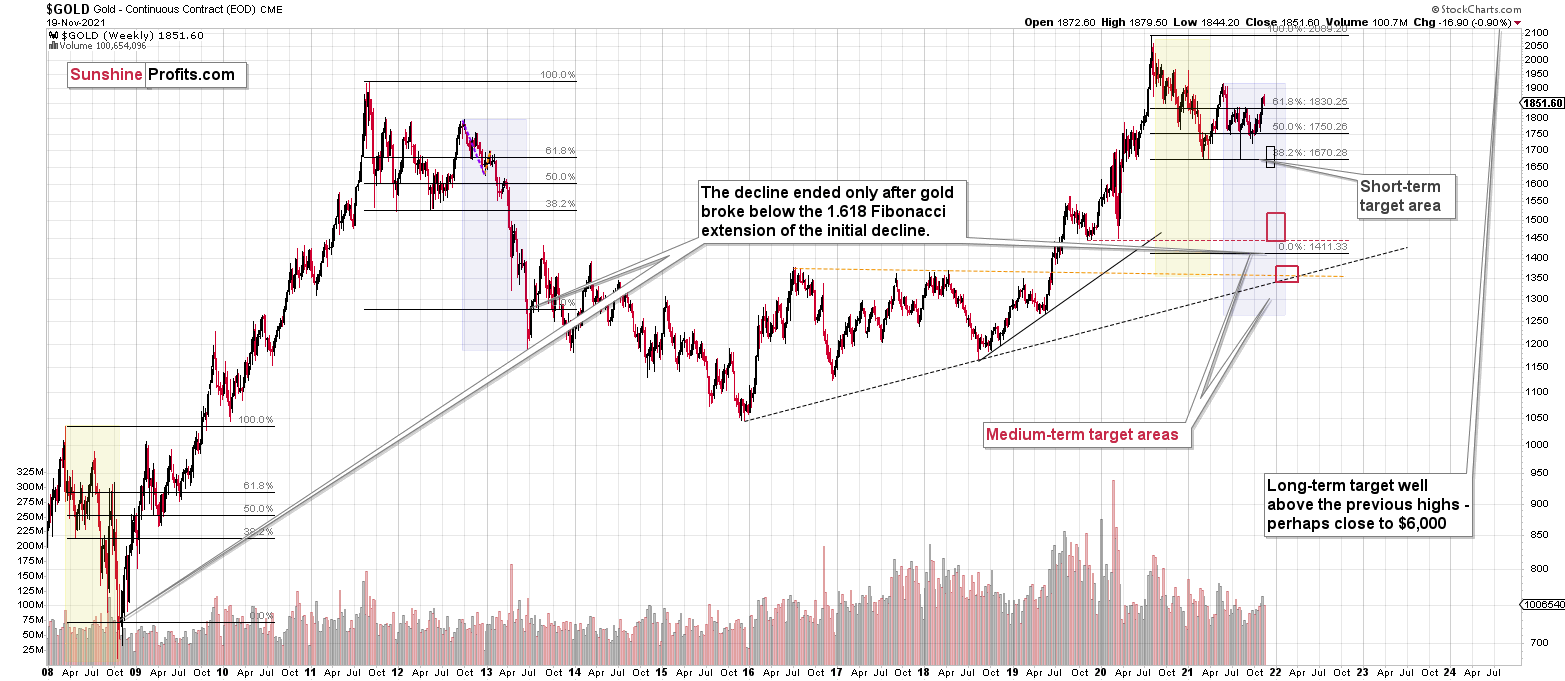
Please note that the above timing details are relatively broad and “for general overview only” – so that you know more or less what I think and how volatile I think the moves are likely to be – on an approximate basis. These time targets are not binding or clear enough for me to think that they should be used for purchasing options, warrants or similar instruments.
Summary
Summing up, gold declined in tune with my long-term-based indications, and the medium-term downtrend appears to have resumed. Based on the analogy to 2013 and other factors, a bigger decline in gold appears to be just around the corner (regardless of what happens in the very near term).
It seems that we might see a short-term bottom close to the middle of December, and perhaps that’s when gold moves to its previous 2021 lows. However, I don’t think that it would be the final bottom. Conversely, it seems that the final bottom would form lower, after a short-term correction (from the above-mentioned December lows).
From the medium-term point of view, the key two long-term factors remain the analogy to 2013 in gold and the broad head and shoulders pattern in the HUI Index. They both suggest much lower prices ahead.
It seems that our profits from the short positions are going to become truly epic in the following months.
After the sell-off (that takes gold to about $1,350 - $1,500), I expect the precious metals to rally significantly. The final part of the decline might take as little as 1-5 weeks, so it's important to stay alert to any changes.
Most importantly, please stay healthy and safe. We made a lot of money last March and this March, and it seems that we’re about to make much more on the upcoming decline, but you have to be healthy to enjoy the results.
As always, we'll keep you - our subscribers - informed.
PLEASE BE ADVISED:
On an administrative note, the markets are closed in the U.S. tomorrow, so the trading, in general, will be limited not only on that day but also on Friday, as many people take the opportunity to make this into a long weekend. Thus there will be no regular Gold & Silver Trading Alerts on Thursday and Friday this week. The next regular Gold & Silver Trading Alert is therefore scheduled for Monday, Nov. 29. Still, if anything major happens on the market and/or the outlook changes, I will send out you a quick message, nonetheless.
To summarize:
Trading capital (supplementary part of the portfolio; our opinion): Full speculative short positions (300% of the full position) in junior mining stocks are justified from the risk to reward point of view with the following binding exit profit-take price levels:
Mining stocks (price levels for the GDXJ ETF): binding profit-take exit price: $35.73; stop-loss: none (the volatility is too big to justify a stop-loss order in case of this particular trade)
Alternatively, if one seeks leverage, we’re providing the binding profit-take levels for the JDST (2x leveraged) and GDXD (3x leveraged – which is not suggested for most traders/investors due to the significant leverage). The binding profit-take level for the JDST: $16.18; stop-loss for the JDST: none (the volatility is too big to justify a SL order in case of this particular trade); binding profit-take level for the GDXD: $32.08; stop-loss for the GDXD: none (the volatility is too big to justify a SL order in case of this particular trade).
For-your-information targets (our opinion; we continue to think that mining stocks are the preferred way of taking advantage of the upcoming price move, but if for whatever reason one wants / has to use silver or gold for this trade, we are providing the details anyway.):
Silver futures downside profit-take exit price: $19.12
SLV profit-take exit price: $17.72
ZSL profit-take exit price: $41.38
Gold futures downside profit-take exit price: $1,683
HGD.TO – alternative (Canadian) inverse 2x leveraged gold stocks ETF – the upside profit-take exit price: $12.48
HZD.TO – alternative (Canadian) inverse 2x leveraged silver ETF – the upside profit-take exit price: $30.48
Long-term capital (core part of the portfolio; our opinion): No positions (in other words: cash
Insurance capital (core part of the portfolio; our opinion): Full position
Whether you already subscribed or not, we encourage you to find out how to make the most of our alerts and read our replies to the most common alert-and-gold-trading-related-questions.
Please note that we describe the situation for the day that the alert is posted in the trading section. In other words, if we are writing about a speculative position, it means that it is up-to-date on the day it was posted. We are also featuring the initial target prices to decide whether keeping a position on a given day is in tune with your approach (some moves are too small for medium-term traders, and some might appear too big for day-traders).
Additionally, you might want to read why our stop-loss orders are usually relatively far from the current price.
Please note that a full position doesn't mean using all of the capital for a given trade. You will find details on our thoughts on gold portfolio structuring in the Key Insights section on our website.
As a reminder - "initial target price" means exactly that - an "initial" one. It's not a price level at which we suggest closing positions. If this becomes the case (like it did in the previous trade), we will refer to these levels as levels of exit orders (exactly as we've done previously). Stop-loss levels, however, are naturally not "initial", but something that, in our opinion, might be entered as an order.
Since it is impossible to synchronize target prices and stop-loss levels for all the ETFs and ETNs with the main markets that we provide these levels for (gold, silver and mining stocks - the GDX ETF), the stop-loss levels and target prices for other ETNs and ETF (among other: UGL, GLL, AGQ, ZSL, NUGT, DUST, JNUG, JDST) are provided as supplementary, and not as "final". This means that if a stop-loss or a target level is reached for any of the "additional instruments" (GLL for instance), but not for the "main instrument" (gold in this case), we will view positions in both gold and GLL as still open and the stop-loss for GLL would have to be moved lower. On the other hand, if gold moves to a stop-loss level but GLL doesn't, then we will view both positions (in gold and GLL) as closed. In other words, since it's not possible to be 100% certain that each related instrument moves to a given level when the underlying instrument does, we can't provide levels that would be binding. The levels that we do provide are our best estimate of the levels that will correspond to the levels in the underlying assets, but it will be the underlying assets that one will need to focus on regarding the signs pointing to closing a given position or keeping it open. We might adjust the levels in the "additional instruments" without adjusting the levels in the "main instruments", which will simply mean that we have improved our estimation of these levels, not that we changed our outlook on the markets. We are already working on a tool that would update these levels daily for the most popular ETFs, ETNs and individual mining stocks.
Our preferred ways to invest in and to trade gold along with the reasoning can be found in the how to buy gold section. Furthermore, our preferred ETFs and ETNs can be found in our Gold & Silver ETF Ranking.
As a reminder, Gold & Silver Trading Alerts are posted before or on each trading day (we usually post them before the opening bell, but we don't promise doing that each day). If there's anything urgent, we will send you an additional small alert before posting the main one.
Thank you.
Przemyslaw Radomski, CFA
Founder, Editor-in-chief

