

Briefly: in our opinion, full (300% of the regular position size) speculative short positions in junior mining stocks are justified from the risk/reward point of view at the moment of publishing this Alert.
The invalidations of breakouts and breakdowns are strong signals in the opposite direction, and we just saw them throughout the market – also in gold.
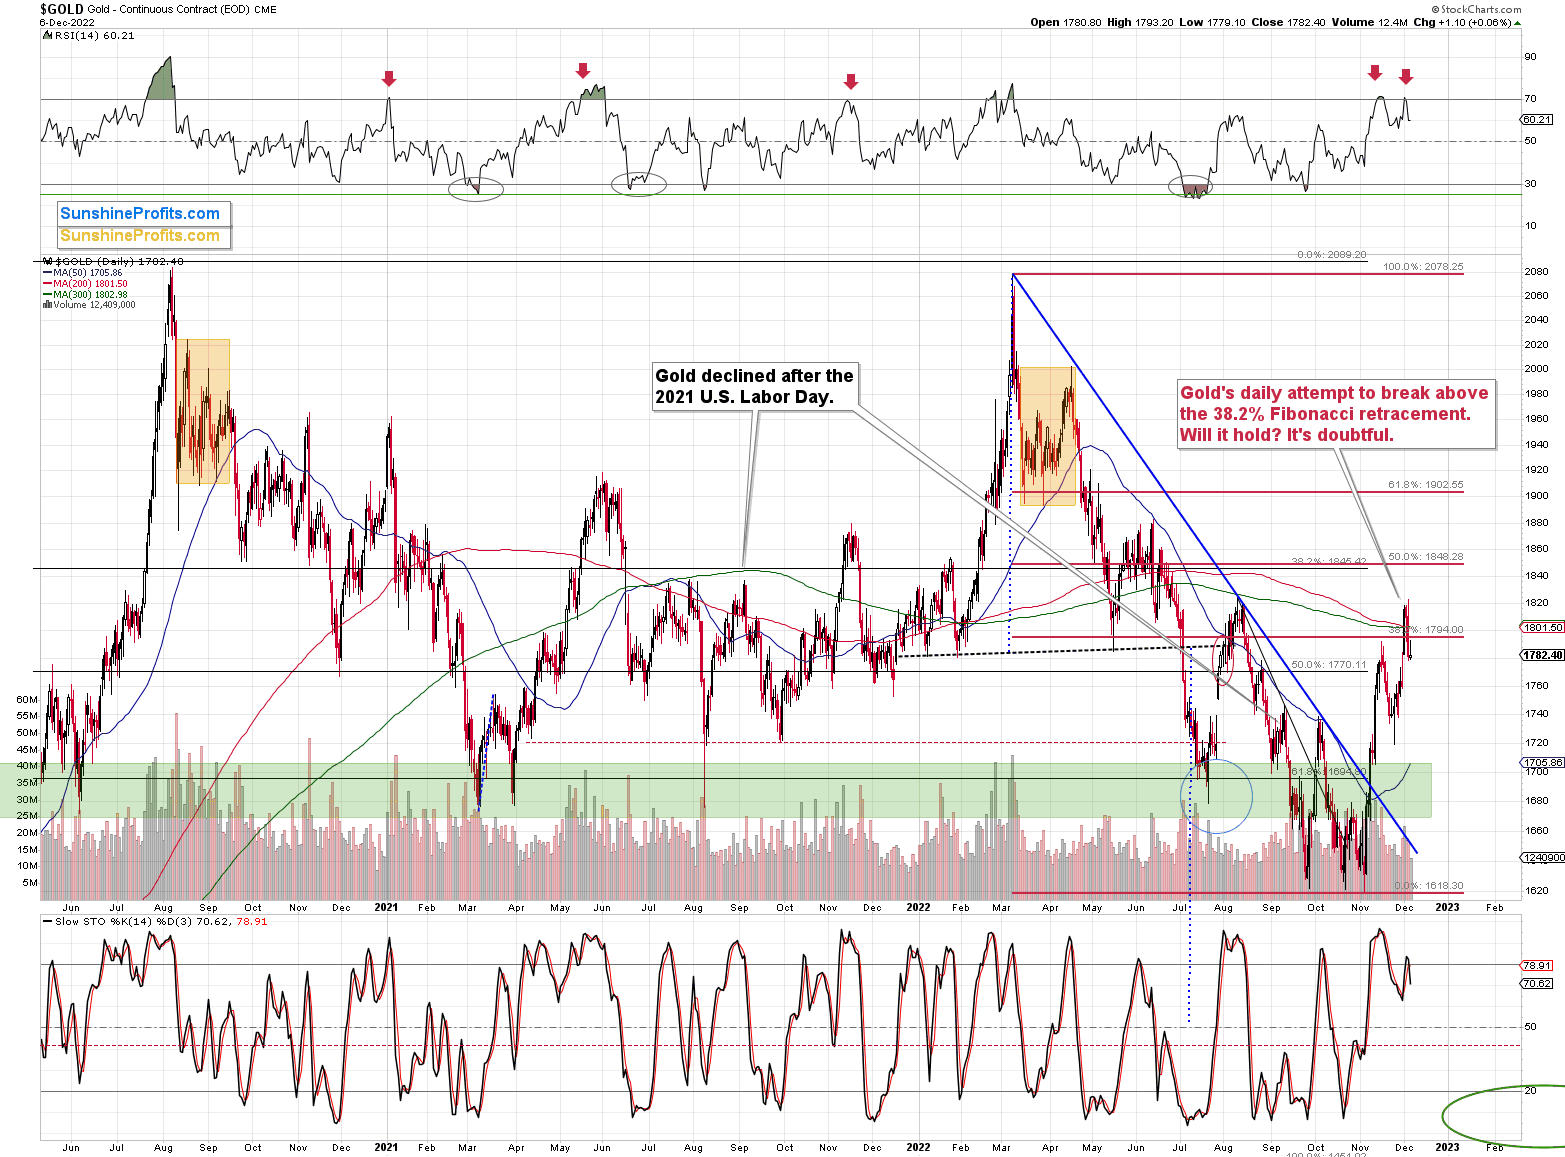
The gold price has recently invalidated its small breakout above the 38.2% Fibonacci retracement level, which is a strong bearish sign. If it was just gold where we saw this kind of performance, we could say it was by chance.
However, since we saw it almost everywhere (at least in almost every market that really counts for precious metals investors and traders), it’s something that shouldn’t be overlooked.
Especially since this invalidation coincided with a sell signal from the RSI indicator, which had just dropped below the 70 level. I used red arrows to mark previous cases where we saw something similar, and — you guessed it — declines followed in the majority of those cases.
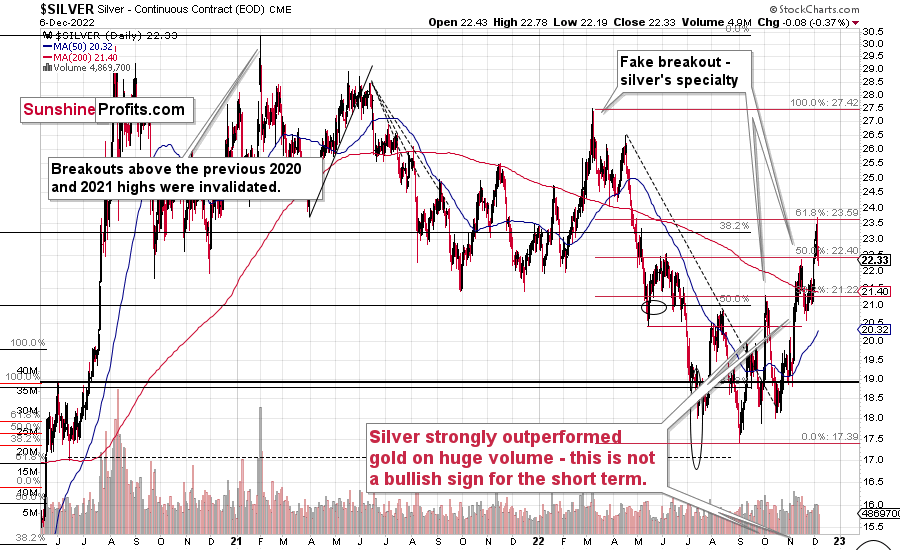
Silver is the odd guy, because it didn’t invalidate the breakout above the 38.2% retracement based on the 2022 decline. Instead, it invalidated its tiny breakout above the 61.8% retracement.
Fair enough, since silver is known to outperform gold just before bigger declines. The size of the correction seems to confirm this trading technique.
In today’s pre-market trading (chart courtesy of https://www.silverpriceforecast.com), silver was up slightly more than gold, compared to the size of yesterday’s intraday decline.
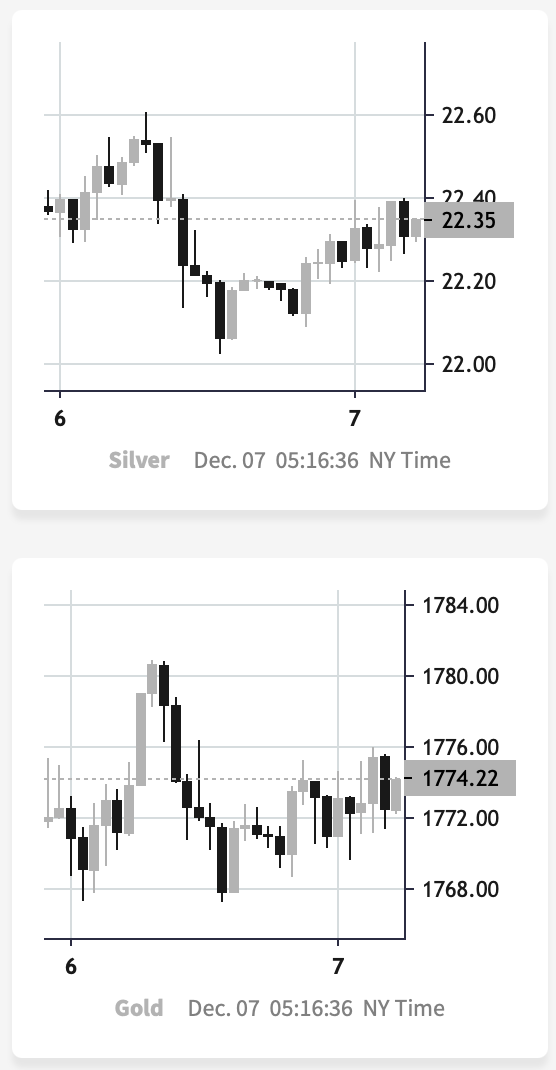
This is a subtle indication that silver’s very short-term outperformance remains intact, and it continues to have bearish implications for the short term.
Stocks Invalidated Their Breakout, Too
As I wrote earlier, it’s not just the precious metals market that invalidated its recent breakouts – we saw something very similar in the S&P 500 Index.
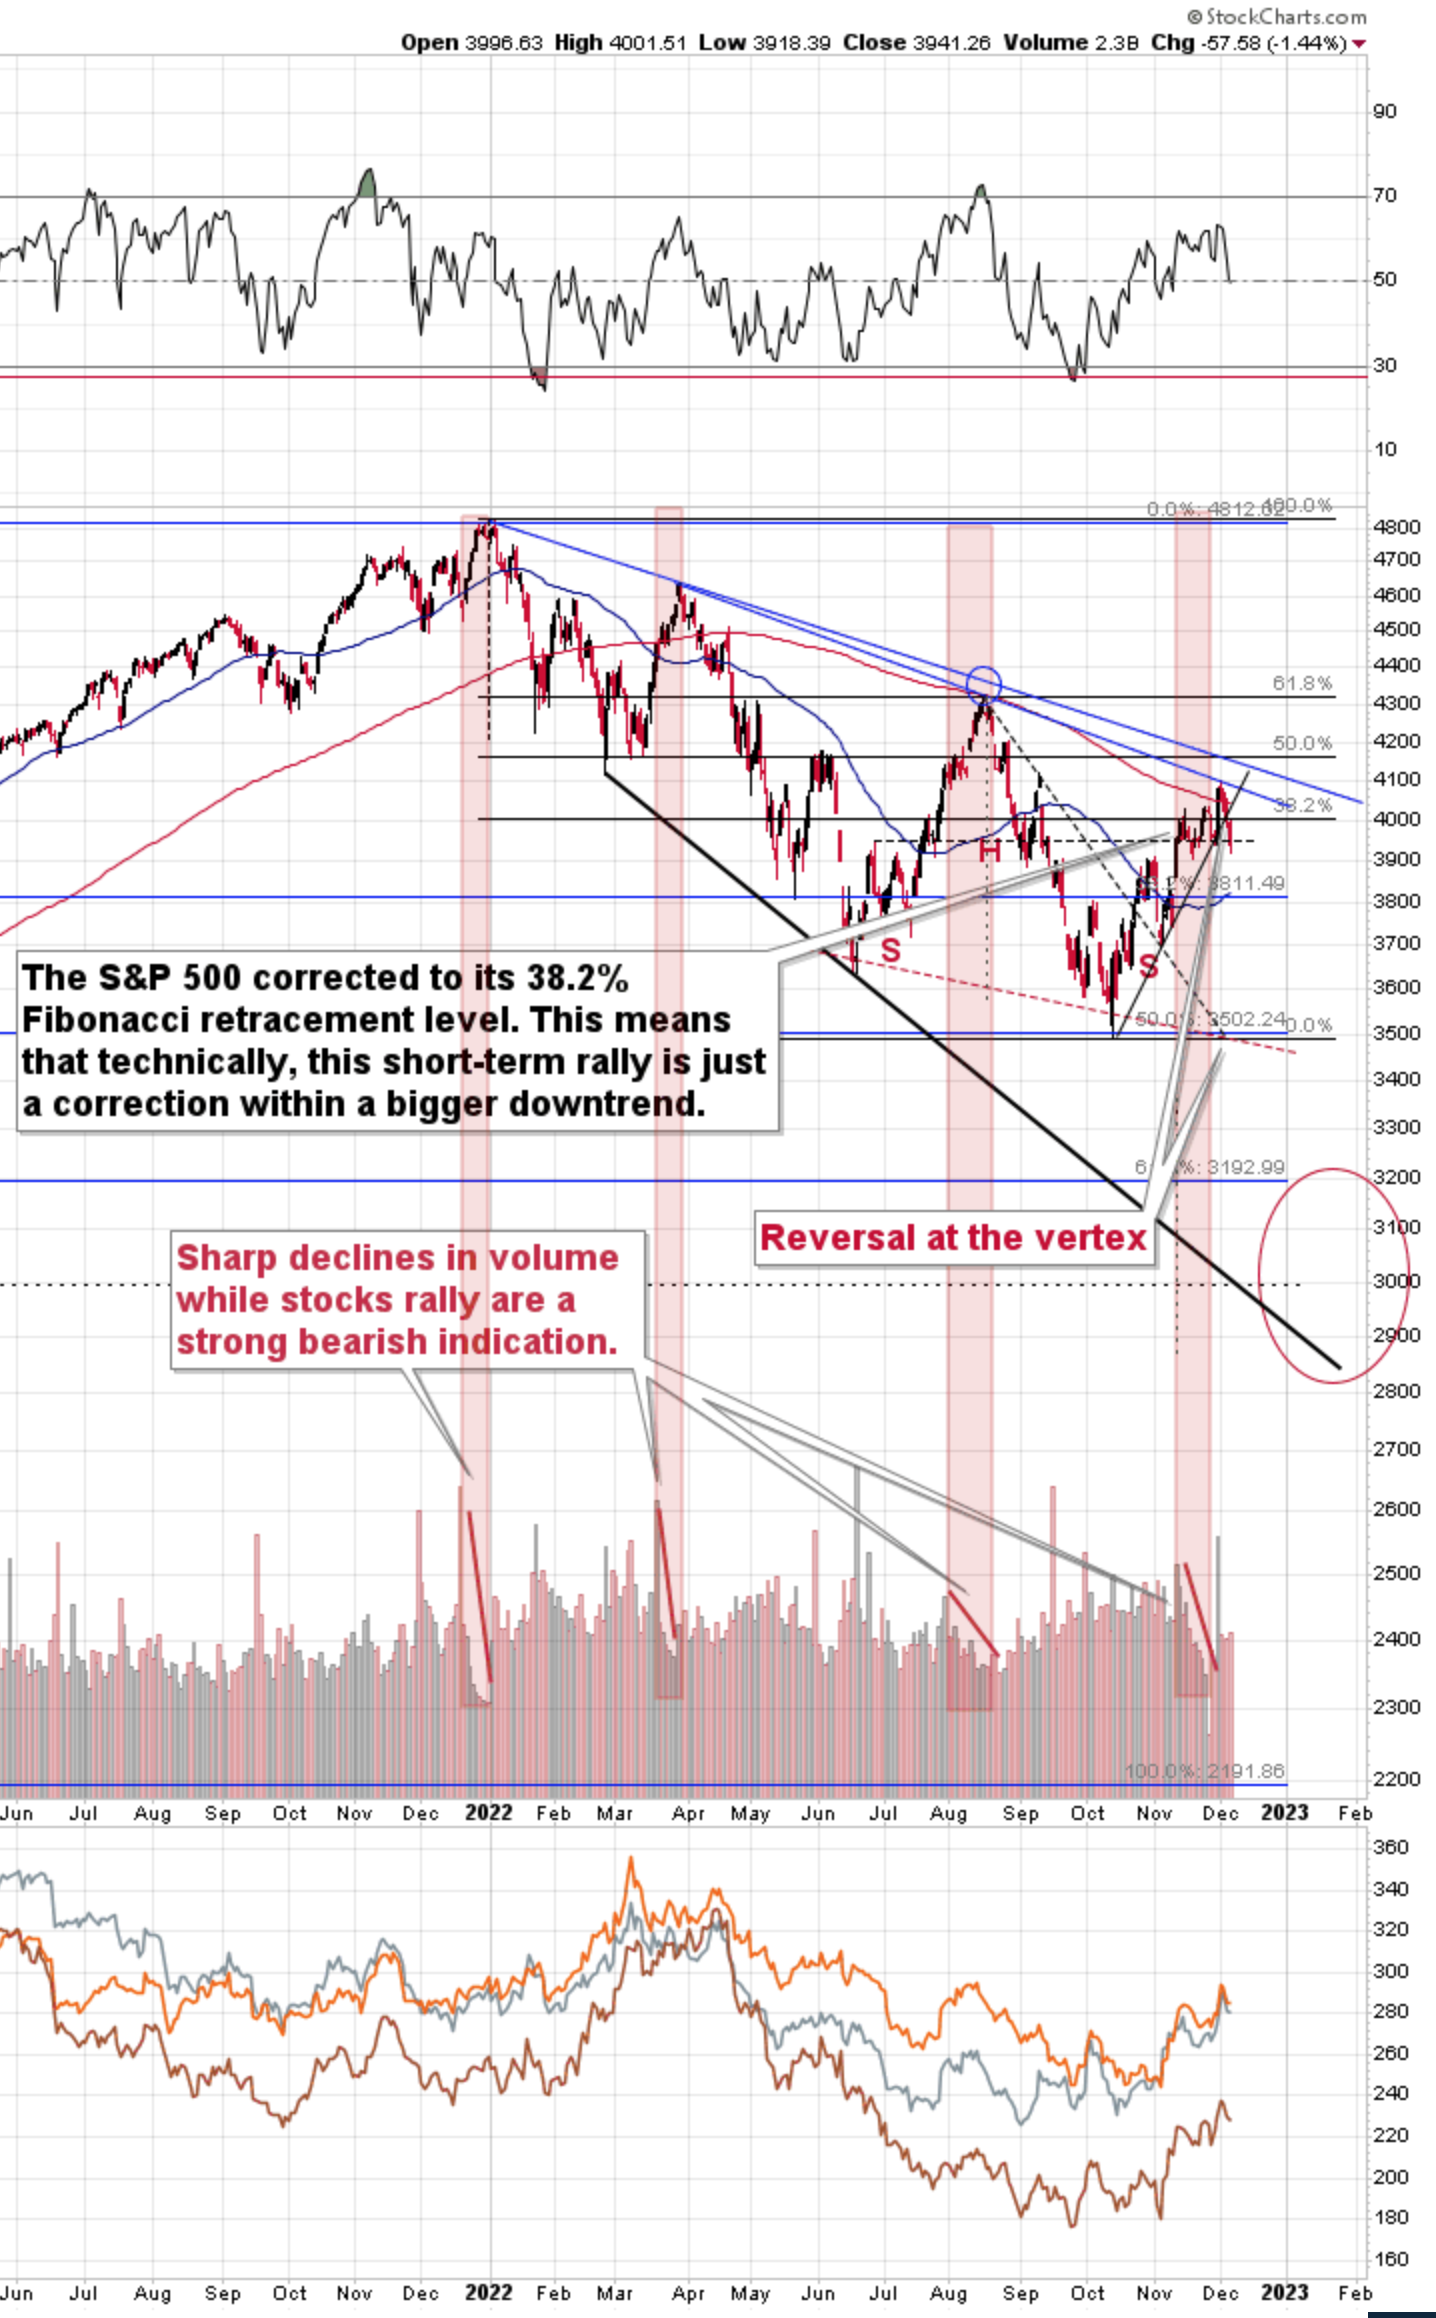
The broad market moved lower this week, and there are two good reasons to think that this time, the small move lower is just the beginning of a much bigger move to the downside.
One of the reasons is that this move lower came right after the triangle-vertex-based turning point. The declining black and red lines (both dashed) intersect at more or less the very recent top. As their name says, those turning points mark… Well, turning points. And since the most recent short-term move was to the upside, it currently has bearish implications.
The second reason is that stocks now broke below their rising support line (marked with a solid black line), and that’s not what happened during the two previous small moves lower.
The analogy in the price-volume link (marked with red rectangles) also points to much lower prices in the stock market.
Why is this important for gold and silver investors and traders? Because the last two big moves took place more or less in line with each other – in stocks and in precious metals (and miners). The slide in stocks could also trigger something similar in the case of commodities like crude oil. The same thing is likely to happen again this time, especially given what’s happening in the USD Index.
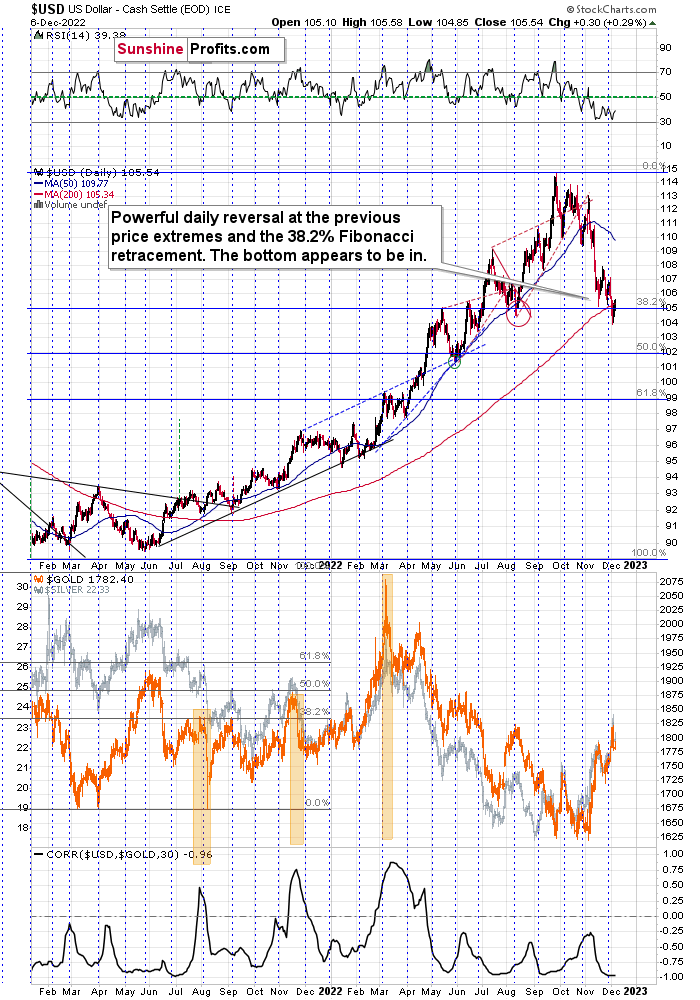
The USDX just invalidated a small breakout below its previous 2022 lows and its 38.2% Fibonacci retracement level. And it did so while being oversold from RSI’s point of view.
In fact, looking at the RSI, the current situation is very similar to what we saw in early June 2021. And you know what happened to gold shortly thereafter? It plunged.
So all in all, the outlook for the precious metals market is currently very bearish, not just from a medium-term point of view (which is mostly based on factors that I didn’t cover above), but also from a short-term point of view. Given the situation in both precious metals, and the stock market, it seems that the junior mining stocks are poised to decline the most.
Speaking of junior miners, let’s take a look at the GDXJ ETF chart.
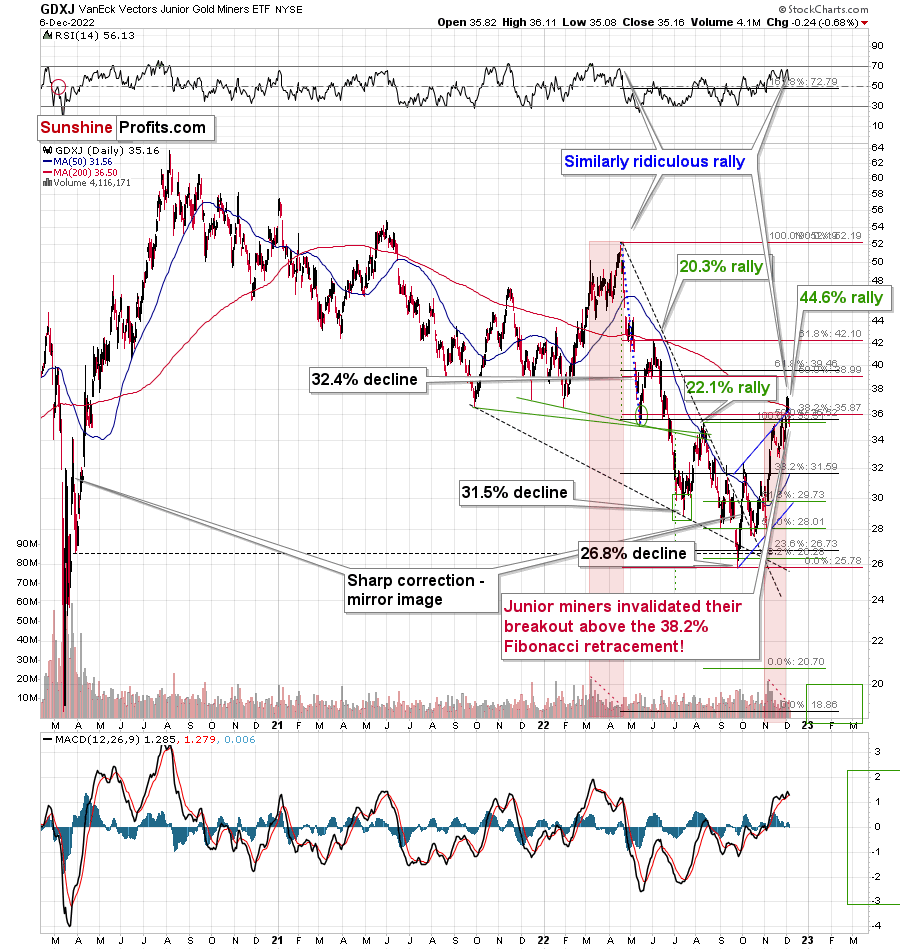
The key thing about the above chart is that it also features an invalidation of the move above the 38.2% Fibonacci retracement. The implications are just as bearish as they are in the case of gold and stocks.
Or one could say that they are more bearish because juniors are likely to be impacted by both declining gold prices and declining stock prices. So, the culmination of the bearish forces is likely to hit junior miners the most.
Besides, please note that the price-volume analogy between November-December and March-April is in near-perfect tune. In both cases, juniors topped initially on huge volume, they traded sideways, and then they made the final attempt to move even higher on low volume. When this final attempt was invalidated (just like what we saw now), the GDXJ plunged.
All in all, the implications are very bearish for the following weeks and – probably – days.
Having said that, let’s take a look at the situation from a more fundamental point of view.
Recession vs Gold
While the S&P 500 and crude oil collapsed on Dec. 6, the gold price ended the day in the green Moreover, with silver and mining stocks also exiting the session relatively unscathed, the precious metals largely avoided the daily carnage.
However, with recession fears uplifting the USD Index and suppressing U.S. Treasury yields, the combination creates a mixed fundamental picture for the PMs. For example, JPMorgan CEO Jamie Dimon – who heads the largest U.S. bank – said on Dec. 6:
“Inflation is eroding everything, and that trillion and a half dollars [of consumer bank deposits] will run out sometime midyear next year. When you’re looking out forward, those things may very well derail the economy and cause a mild or hard recession that people worry about.”
But, with the recession narrative contrasting the data, gold’s medium-term drawdown should be driven by a higher U.S. federal funds rate (FFR), not an unprovoked collapse of the U.S. economy.
To explain, a recession is bullish for the USD Index and bearish for the FFR, while a resilient U.S. economy is bullish for both. Therefore, while we’ve warned repeatedly that every inflation fight since 1954 has ended with a recession, and we expect one to materialize in late 2023, timing matters.
Furthermore, with the current and historical data contrasting the collapse calls, financial conditions need to tighten dramatically to curb inflation and create the necessary demand destruction to induce a recession. So, the FFR should seek higher ground, and the liquidity drain should continue to haunt the PMs.
Please see below:
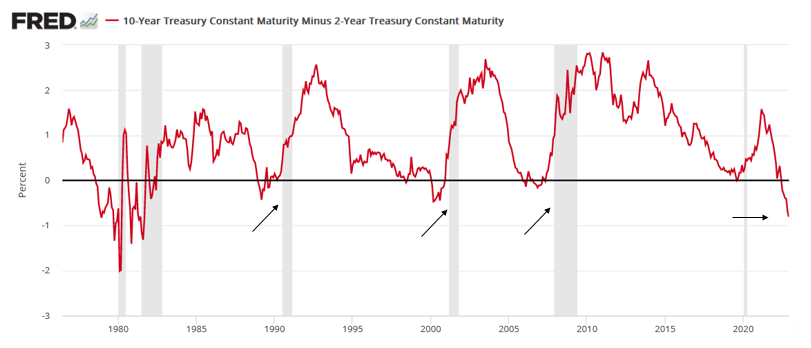
To explain, the red line above tracks the U.S. 10-2 spread, which subtracts the U.S. 2-Year Treasury yield (2Y) from the U.S. 10-Year Treasury yield (10Y). In a nutshell: when the 2Y exceeds the 10Y, it's the bond market's way of warning about a forthcoming recession; and the development occurs because the 2Y is pricing in a higher FFR, while the 10Y is pricing in weaker economic growth.
Also, with yield curve inversion (10Y < 2Y) the talk of the town in recent days, the narrative proclaims that a recession is imminent. But, that's not what we see.
For example, if you analyze the right side of the chart above, you can see that the 10-2 spread has surpassed -0.80% and is at its lowest level since the 1980s. As a result, the bond market is screaming recession.
However, the three arrows in the middle show that the 10-2 spread moved from negative to positive before the last three recessions occurred; and this happens because the 2Y falls by more than the 10Y, as investors start pricing in Fed rate cuts. For context, the 1980s was a mixed picture, as two recessions had the spread moving in and out of positive territory.
Thus, the important point is that the 10-2 spread is becoming more negative, and the last three recessions did not occur when the spread was declining.
To that point, the 10-2 spread turned negative in December 1988, and the recession arrived in July 1990 (~20-month lag). The 10-2 spread also turned negative in February 2000 and the recession arrived in February 2001 (~12-month lag). In addition, the 10-2 spread turned negative in February 2006 and the recession arrived in December 2007 (~22-month lag).
For context, the 10-2 spread briefly turned negative in August 2019, and the COVID-19-induced recession occurred in February 2020. However, we excluded that example because the pandemic was a health and not an economic crisis.
In any event, the moral of the story is that the 10-2 spread needs to turn positive before recession fears are valid; and this means the 2Y needs to demonstrate substantial weakness, where economic carnage causes bond investors to bid the 2Y Note in anticipation of the Fed cutting interest rates. Yet, this is far from the current backdrop.
Please see below:
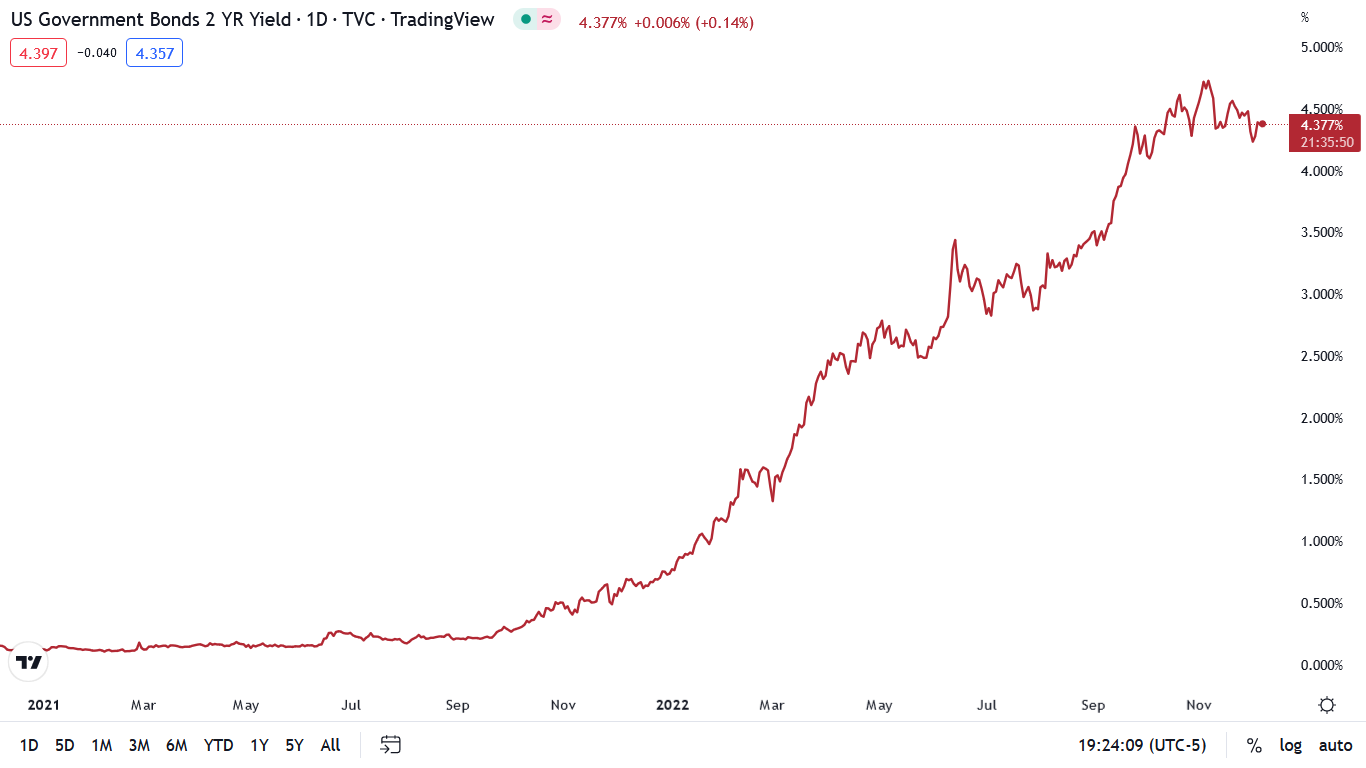
To explain, the red line above tracks the 2Y, and if you analyze the right side of the chart, you can see that the metric remains in consolidation. Therefore, its behavior does not add credibility to the recession rhetoric.
To compare, please see its movement in 2007:
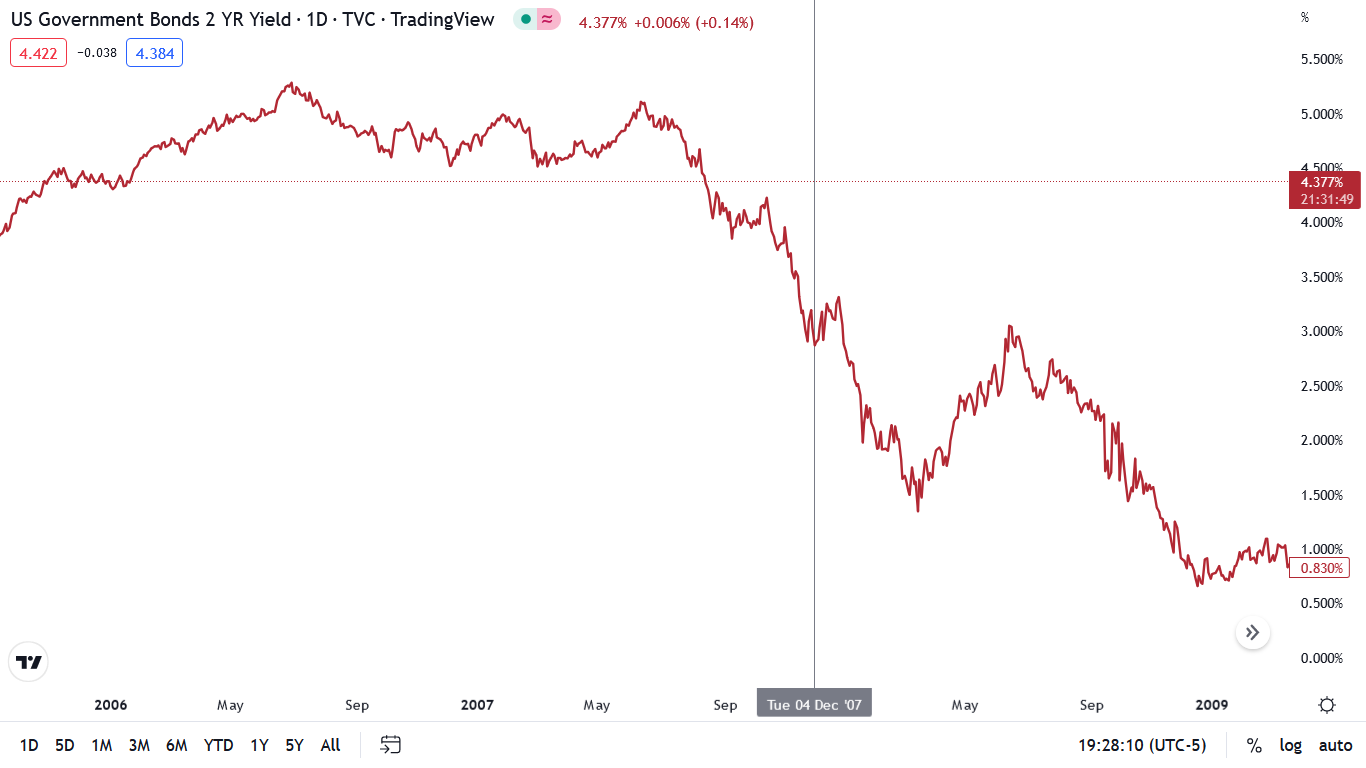
Remember, we noted above that the recession began in December 2007, and as you can see, the 2Y's substantial decline from its peak meant the economic death knell had been ringing for several months.
Likewise, please see the 2Y's behavior during the February 2001 recession:
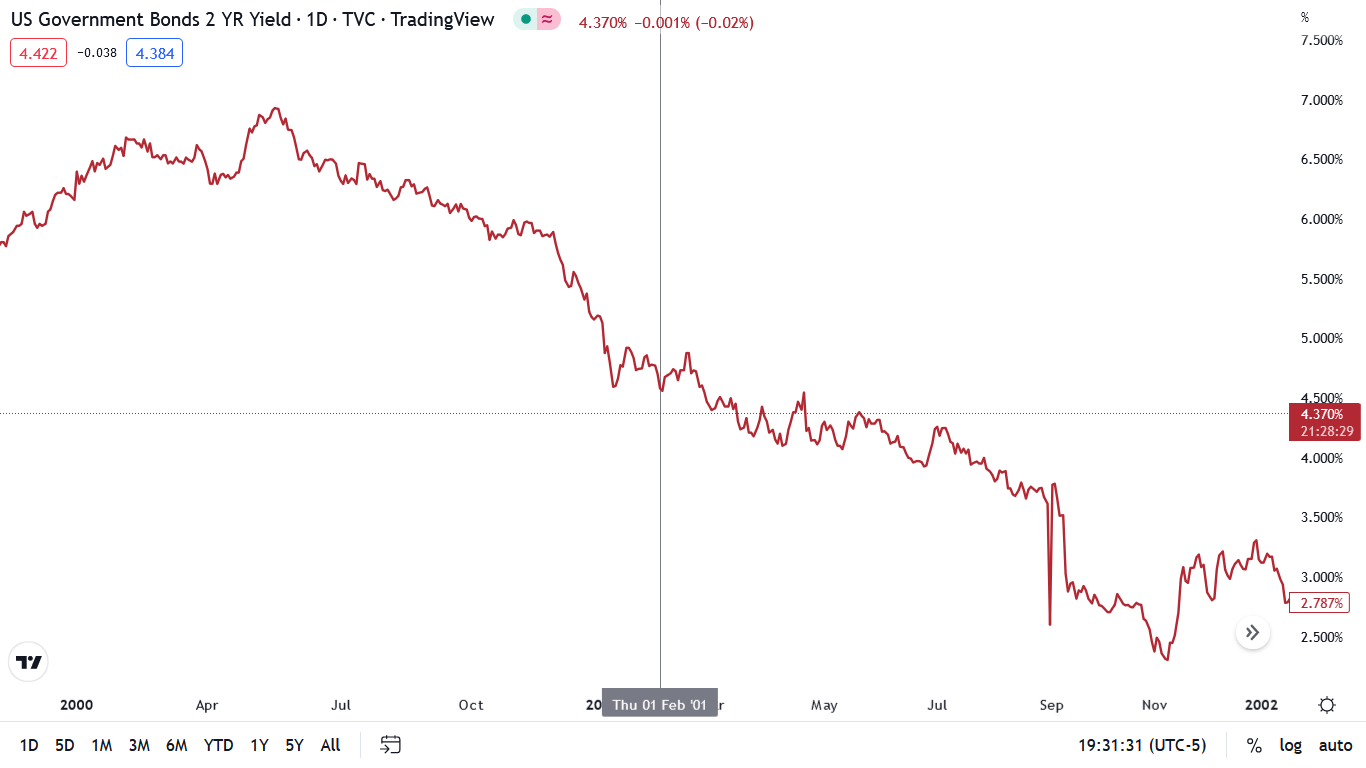
Again, the metric had already declined substantially from its peak before the recession began, and that dynamic is not present today.
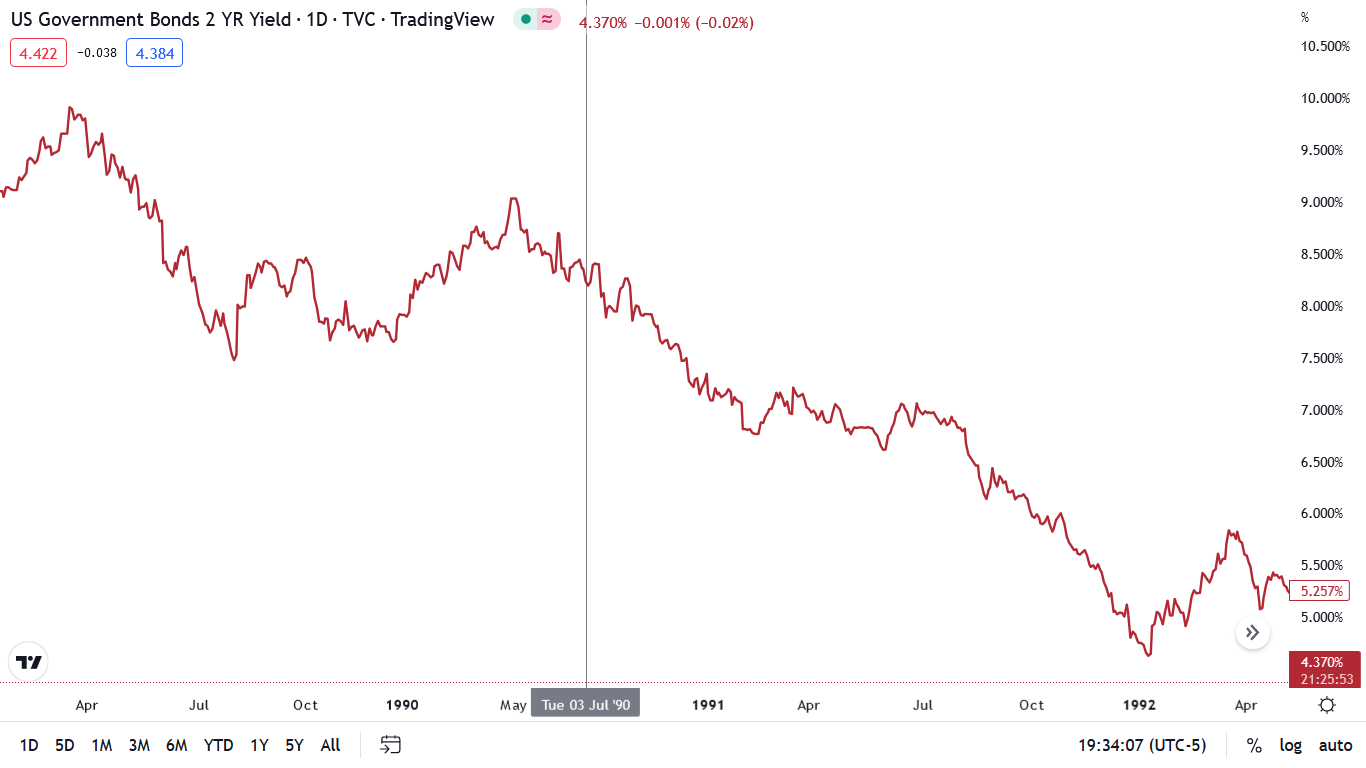
Making three of a kind, the July 1990 recession also culminated with the 2Y suffering a material drop from its high before the economic malaise unfolded.
Please see below:
As further evidence, potential GDP growth also contrasts the recession narrative. For example, the Atlanta Fed’s Q4 real GDP growth estimate had dipped from north of 4% to below 3%. However, the report stated on Dec. 6:
“The GDPNow model estimate for real GDP growth (seasonally adjusted annual rate) in the fourth quarter of 2022 is 3.4 percent on December 6, up from 2.8 percent on December 1.
“The nowcasts of fourth-quarter real personal consumption expenditures growth and fourth-quarter real government spending growth [rose] from 3.2 percent and 0.8 percent, respectively, to 3.7 percent and 1.1 percent, respectively, [and] were slightly offset by a decrease in the nowcast of fourth-quarter gross private domestic investment growth from 2.0 percent to 1.7 percent.”
Please see below:
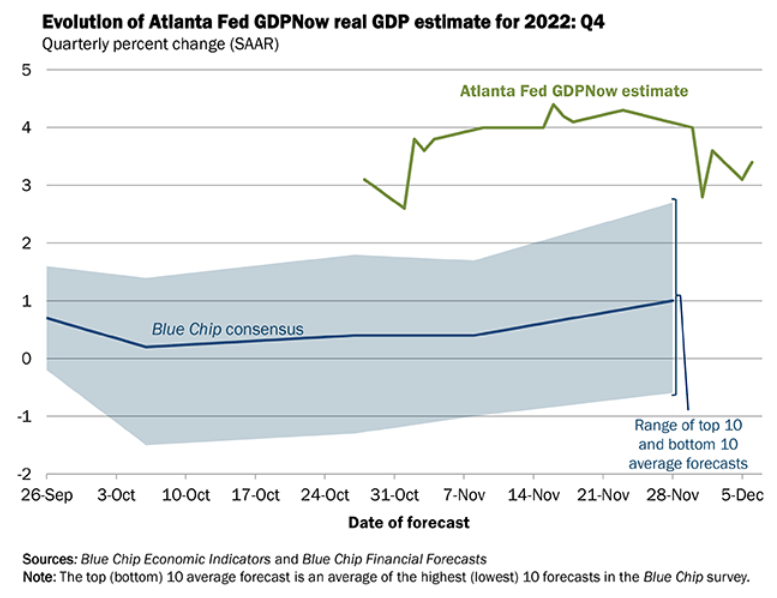
To explain, the green line above tracks the Atlanta Fed’s Q4 real GDP growth estimate, while the blue line above tracks the Blue Chip consensus estimate (investment banks). If you analyze the right side of the chart, you can see that the green line remains relatively uplifted. As such, while the projection will change as new data arrives, the current state is far from recessionary.
Overall, while fears of an economic climax have spooked investors in recent days, the data does not signal demand destruction. Consequently, while the gold price would benefit from a lower FFR and more QE, it would require an unprovoked economic collapse to elicit a dovish pivot, and that narrative contrasts the fundamentals.
So, while the storytellers may proclaim that we’re nearing the end of the Fed’s rate hike cycle, inflation, the 2Y, history and economic reality suggest otherwise.
When Will Silver Surrender?
Silver sidestepped the S&P 500’s volatility on Dec. 6, as even a collapse in the crude price wasn’t enough to wreck the white metal. However, with the PMs misjudging the fundamental backdrop, resilient inflation and a higher FFR should wreak havoc on the silver price in the months ahead.
For example, the crowd assumes that a small deceleration in inflation means the battle is over. But, it’s normal for the metric to retreat somewhat when asset prices decline. As a result, when the Fed’s hawkish actions spooked market participants, the negativity helped.
In contrast, with financial conditions loosening materially in recent weeks, higher asset prices are bullish for inflation. So, the fundamental issues that plagued the silver price throughout 2022 are far from resolved.
Please see below:
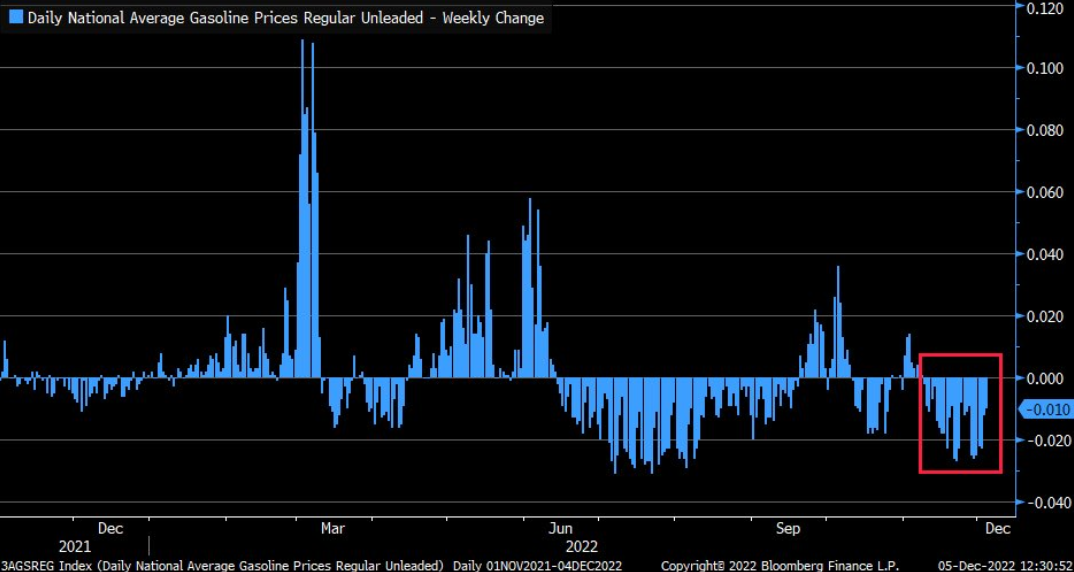
To explain, the blue bars above track the weekly change in the average U.S. gasoline price. If you analyze the right side of the chart, you can see that the metric has declined each week since early November; and with lower oil & gas prices reducing headline inflation, the developments are viewed as positive.
Likewise, with supply chains normalizing and commodity prices stabilizing, the developments have also eased the burden on U.S. manufacturers.
Please see below:
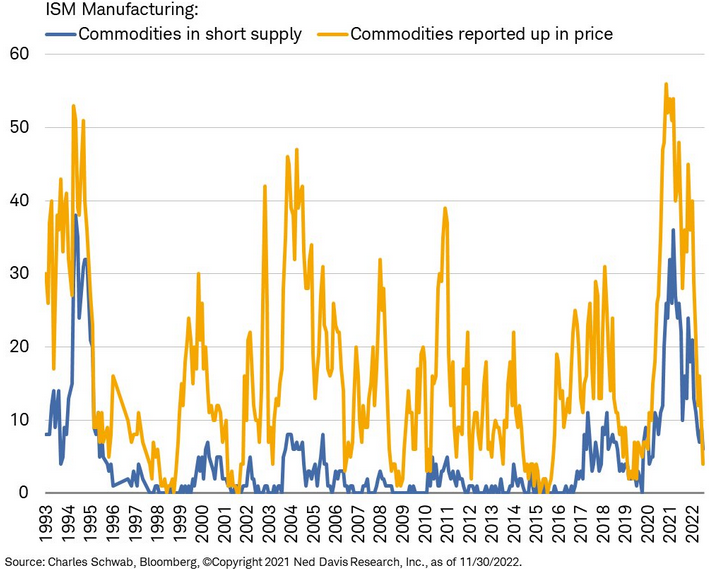
To explain, the yellow and blue lines above track the results from the Institute for Supply Management’s (ISM) Manufacturing PMI, where respondents remarked whether commodities were in short supply and increasing in price.
If you analyze the right side of the chart, you can see that both lines have declined dramatically and are well within or near normalized levels. As such, it’s another example of how supply-side inflation continues to ease.
On top of that, Drewry’s World Container Index shows that shipping prices have plunged in 2022, and the red boxes below highlight how rates from Shanghai to Los Angeles and New York have fallen by more than 60% year-over-year (YoY).
Please see below:
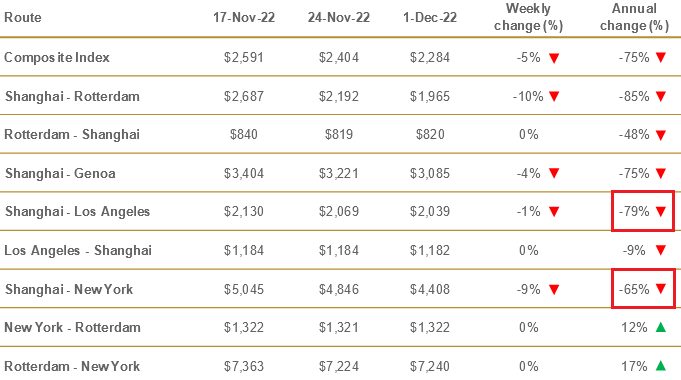 Source: Drewry
Wait, isn’t all of this bullish for silver and bearish for the FFR?
Well, while supply-side progress is easy to see, output inflation has not declined to the same magnitude. To explain why, we wrote on Dec. 1:
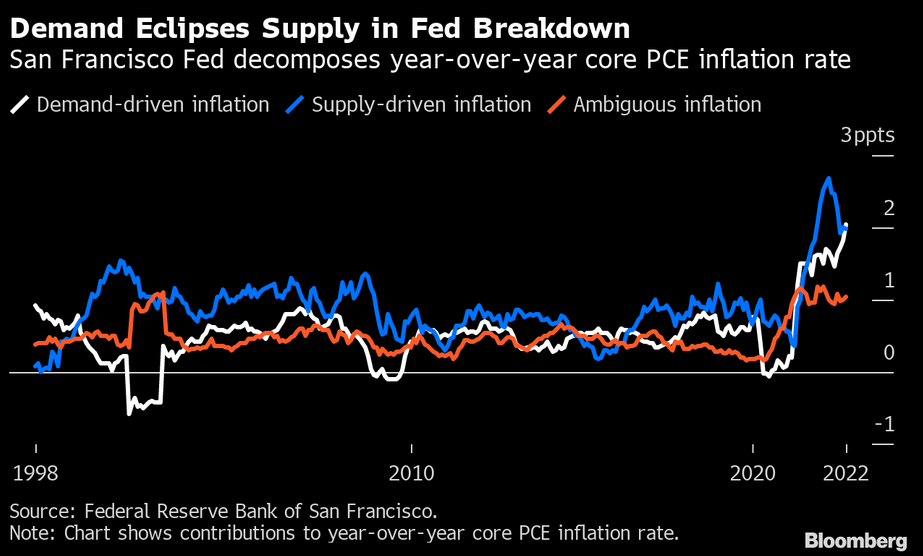
The San Francisco Fed attempted to decompose the drivers of the core Personal Consumption Expenditures (PCE) Index’s YoY increase. The blue, white and orange lines above represent supply, demand and ambiguous inflation.
If you analyze the right side of the chart, you can see that the white line (demand) has now surpassed the blue line (supply) as the primary driver of inflation. Thus, while supply chains have normalized and shipping rates have declined by upwards of ~80% YoY, output inflation has barely budged. As such, resilient demand has been the culprit, and the crowd doesn’t grasp how difficult this will make the Fed’s job in 2023.
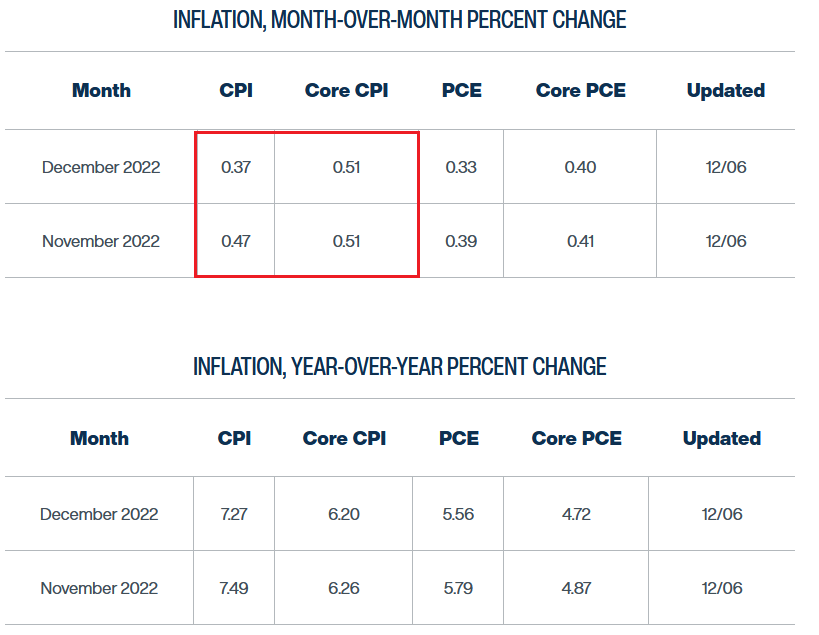
To that point, while the Cleveland Fed reduced its projections for the headline Consumer Price Index (CPI) in November and December (due to lower oil prices), the core CPI has barely budged.
Please see below:
 Source: Cleveland Fed
To explain, the Cleveland Fed expects the headline CPI to increase by 0.47% and 0.37% month-over-month (MoM) in November and December. In contrast, the core CPI is expected to increase by 0.51% MoM in both months, and the YoY figures should surpass 6%.
Therefore, while normalizing supply-side pressures help reduce the headline CPI, record-high household checkable deposits and wage inflation keep demand high for core CPI items outside of food and energy. Likewsie, we noted on Sep. 14 that lower commodity prices would only free up more cash for Americans to spend on discretionary items. We wrote:
The CPI outperformed expectations across the board. Furthermore, we warned that while lower oil & gas prices were bearish for the headline CPI, the rise in Americans’ disposable income was bullish for the core CPI. Thus, it’s no surprise that the latter increased from 5.9% YoY in July to 6.3% YoY in August. As a result, the supply-side theorists are still scratching their heads because they misunderstand the resiliency of consumer demand.
So, while the consensus continues to highlight the supply-side metrics that signal lower inflation, we don’t disagree with the arguments. Yet, the demand-side has been dismissed throughout this bout of inflation, even though it’s the primary reason why progress has been so slow.
Consequently, with U.S. retail sales hitting an all-time high in October and Mastercard’s SpendingPulse report also bullish, demand remains resilient; and with average hourly earnings (wage inflation) coming in more than double the consensus MoM estimate in November, Americans still have plenty of spending power.
Overall, while the silver price’s strength makes it seem like a dovish pivot is a done deal, don’t be surprised if the peak FFR is higher than the ~5% currently expected.
The Bottom Line
Investors love narratives, and they also give the financial media something to talk about. However, the majority are uninformed and aren’t backed by the hard data. In addition, while recession proclamations contrast historical precedent and the recent economic results, the prospect has garnered all of investors’ attention. Moreover, while we expect a recession in late 2023, it should result from the Fed’s battle with inflation. As such, while the crowd assumes that demand destruction will materialize on its own, we don’t think the Fed’s fight will be that easy.
In conclusion, the PMs were mixed on Dec. 6, even as the USD Index rose. But, with seasonality allowing the bulls to focus on the short term and worry about the medium term later, they remain hopeful for a Santa Clause rally. Conversely, their glass-half-full attitudes should reverse sharply in the months ahead.
Overview of the Upcoming Part of the Decline
- It seems to me that the corrective upswing is over (or about to be over) and that the next big move lower is already underway (or that it’s about to start).
- If we see a situation where miners slide in a meaningful and volatile way while silver doesn’t (it just declines moderately), I plan to – once again – switch from short positions in miners to short positions in silver. At this time, it’s too early to say at what price levels this could take place and if we get this kind of opportunity at all – perhaps with gold prices close to $1,500 - $1,550.
- I plan to switch from the short positions in junior mining stocks or silver (whichever I’ll have at that moment) to long positions in junior mining stocks when gold / mining stocks move to their 2020 lows (approximately). While I’m probably not going to write about it at this stage yet, this is when some investors might consider getting back in with their long-term investing capital (or perhaps 1/3 or 1/2 thereof).
- I plan to return to short positions in junior mining stocks after a rebound – and the rebound could take gold from about $1,450 to about $1,550, and it could take the GDXJ from about $20 to about $24. In other words, I’m currently planning to go long when GDXJ is close to $20 (which might take place when gold is close to $1,450), and I’m planning to exit this long position and re-enter the short position once we see a corrective rally to $24 in the GDXJ (which might take place when gold is close to $1,550).
- I plan to exit all remaining short positions once gold shows substantial strength relative to the USD Index while the latter is still rallying. This may be the case with gold prices close to $1,400 and GDXJ close to $15 . This moment (when gold performs very strongly against the rallying USD and miners are strong relative to gold after its substantial decline) is likely to be the best entry point for long-term investments, in my view. This can also happen with gold close to $1,400, but at the moment it’s too early to say with certainty.
- The above is based on the information available today, and it might change in the following days/weeks.
You will find my general overview of the outlook for gold on the chart below:
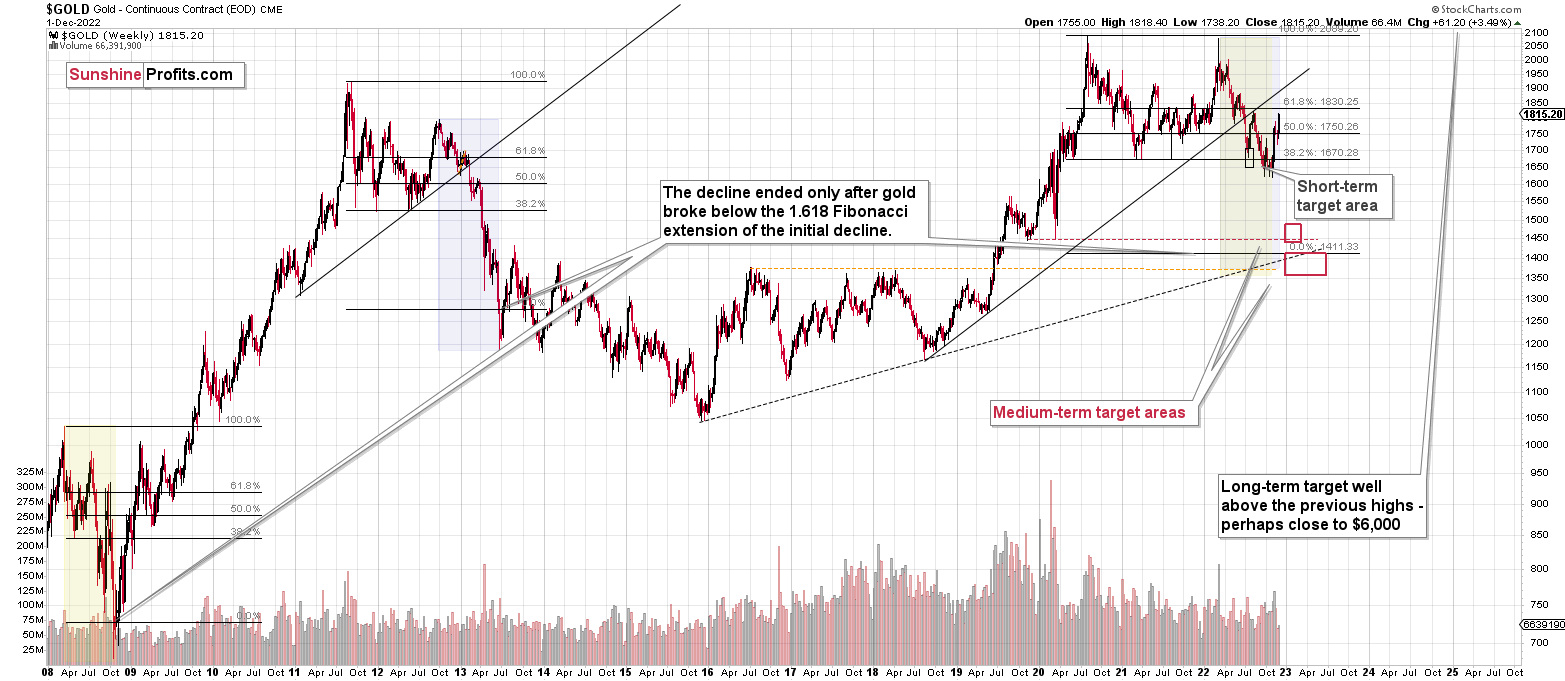
Please note that the above timing details are relatively broad and “for general overview only” – so that you know more or less what I think and how volatile I think the moves are likely to be – on an approximate basis. These time targets are not binding nor clear enough for me to think that they should be used for purchasing options, warrants, or similar instruments.
Letters to the Editor
There are no new letters for today, but I wanted to keep the below reminder in place, just to make sure that everyone had the chance to see it:
Please note that this section is going to go away within the next 1-8 weeks, as you can add comments/questions below the article on Golden Meadow – the platform that we’re using to provide our analyses. Your notification e-mails include an invitation link that allows you to access the “Gold Trading Alerts” space.
The first premium analysis had over 30 comments below it, and once I finish writing this article, I’ll head over to the comments section and catch up on yesterday’s comments.
Also, if you haven’t had the chance to see the video, in which I’m talking about the new platform and why we essentially moved from Sunshine Profits to Golden Meadow, I strongly encourage you to do so:
Summary
Summing up, while the precious metals sector moved higher this week, it seems that it’s just a part of a bigger – bearish – analogy to what we saw in 2008. I realize that volatile upswings generate a lot of emotions, but taking a calm, broad look at the markets shows that nothing really changed.
The situation on the USD index, in particular, suggests that the bottom is already in or nearing, and the opposite is likely for the precious metals market.
In fact, I would like to take this opportunity to congratulate you on your patience with this trade (and I’m grateful for your understanding that not every corrective upswing can be “caught” in trading terms). Many investors and traders panic and get out of the market exactly at the wrong time, but your patience and self-discipline mean that you’re poised to make the most of what the market brings us this and next year.
Moving back to the market, it appears to be yet another time when the markets are incorrectly expecting the Fed to make a dovish U-turn, and based on this, the part of the 2008 decline where we saw the biggest corrective upswing materialized.
In my opinion, the current trading position is going to become profitable in the following weeks, and quite possibly in the following days. And while I can’t promise any kind of performance, I fully expect it to become very profitable before it’s over and to prolong our 2022 winning streak.
After the final sell-off (that takes gold to about $1,350-$1,500), I expect the precious metals to rally significantly. The final part of the decline might take as little as 1-5 weeks, so it's important to stay alert to any changes.
As always, we'll keep you – our subscribers – informed.
To summarize:
Trading capital (supplementary part of the portfolio; our opinion): Full speculative short positions (300% of the full position) in junior mining stocks are justified from the risk to reward point of view with the following binding exit profit-take price levels:
Mining stocks (price levels for the GDXJ ETF): binding profit-take exit price: $20.32; stop-loss: none (the volatility is too big to justify a stop-loss order in case of this particular trade)
Alternatively, if one seeks leverage, we’re providing the binding profit-take levels for the JDST (2x leveraged). The binding profit-take level for the JDST: $27.87; stop-loss for the JDST: none (the volatility is too big to justify a SL order in case of this particular trade).
For-your-information targets (our opinion; we continue to think that mining stocks are the preferred way of taking advantage of the upcoming price move, but if for whatever reason one wants / has to use silver or gold for this trade, we are providing the details anyway.):
Silver futures downside profit-take exit price: $12.32
SLV profit-take exit price: $11.32
ZSL profit-take exit price: $74.87
Gold futures downside profit-take exit price: $1,504
HGD.TO – alternative (Canadian) 2x inverse leveraged gold stocks ETF – the upside profit-take exit price: $18.47
HZD.TO – alternative (Canadian) 2x inverse leveraged silver ETF – the upside profit-take exit price: $46.87
Long-term capital (core part of the portfolio; our opinion): No positions (in other words: cash)
Insurance capital (core part of the portfolio; our opinion): Full position
Whether you’ve already subscribed or not, we encourage you to find out how to make the most of our alerts and read our replies to the most common alert-and-gold-trading-related-questions.
Please note that we describe the situation for the day that the alert is posted in the trading section. In other words, if we are writing about a speculative position, it means that it is up-to-date on the day it was posted. We are also featuring the initial target prices to decide whether keeping a position on a given day is in tune with your approach (some moves are too small for medium-term traders, and some might appear too big for day-traders).
Additionally, you might want to read why our stop-loss orders are usually relatively far from the current price.
Please note that a full position doesn't mean using all of the capital for a given trade. You will find details on our thoughts on gold portfolio structuring in the Key Insights section on our website.
As a reminder - "initial target price" means exactly that - an "initial" one. It's not a price level at which we suggest closing positions. If this becomes the case (as it did in the previous trade), we will refer to these levels as levels of exit orders (exactly as we've done previously). Stop-loss levels, however, are naturally not "initial", but something that, in our opinion, might be entered as an order.
Since it is impossible to synchronize target prices and stop-loss levels for all the ETFs and ETNs with the main markets that we provide these levels for (gold, silver and mining stocks - the GDX ETF), the stop-loss levels and target prices for other ETNs and ETF (among other: UGL, GLL, AGQ, ZSL, NUGT, DUST, JNUG, JDST) are provided as supplementary, and not as "final". This means that if a stop-loss or a target level is reached for any of the "additional instruments" (GLL for instance), but not for the "main instrument" (gold in this case), we will view positions in both gold and GLL as still open and the stop-loss for GLL would have to be moved lower. On the other hand, if gold moves to a stop-loss level but GLL doesn't, then we will view both positions (in gold and GLL) as closed. In other words, since it's not possible to be 100% certain that each related instrument moves to a given level when the underlying instrument does, we can't provide levels that would be binding. The levels that we do provide are our best estimate of the levels that will correspond to the levels in the underlying assets, but it will be the underlying assets that one will need to focus on regarding the signs pointing to closing a given position or keeping it open. We might adjust the levels in the "additional instruments" without adjusting the levels in the "main instruments", which will simply mean that we have improved our estimation of these levels, not that we changed our outlook on the markets. We are already working on a tool that would update these levels daily for the most popular ETFs, ETNs and individual mining stocks.
Our preferred ways to invest in and to trade gold along with the reasoning can be found in the how to buy gold section. Furthermore, our preferred ETFs and ETNs can be found in our Gold & Silver ETF Ranking.
As a reminder, Gold & Silver Trading Alerts are posted before or on each trading day (we usually post them before the opening bell, but we don't promise doing that each day). If there's anything urgent, we will send you an additional small alert before posting the main one.
Thank you.
Przemyslaw K. Radomski, CFA
Founder, Editor-in-chief

