

Briefly: in our opinion, full (300% of the regular position size) speculative short positions in junior mining stocks are justified from the risk/reward point of view at the moment of publishing this Alert.
Gold declined yesterday, and it did so in tune with what we saw in 2013. The back-and-forth trading continues, but we have some signs that it’s getting close to being over. In other words, it’s likely the case that we won’t have to wait for the decline to re-start much longer.
One of those signs comes from the very short-term GDXJ ETF chart.
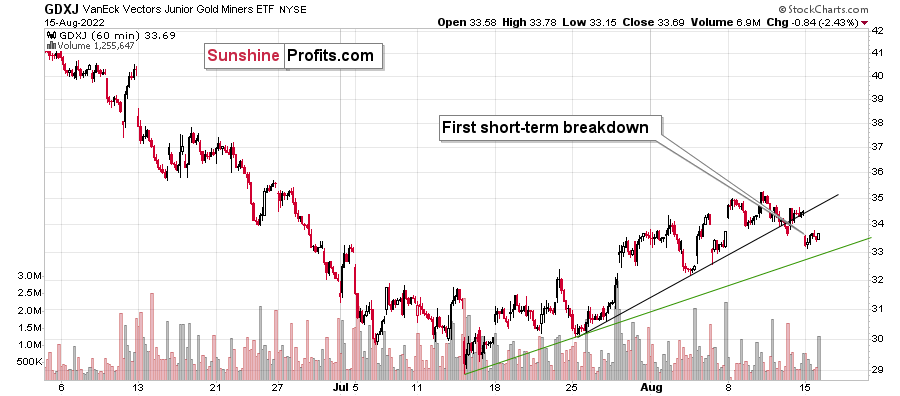
Junior miners are after a breakdown below their rising black support line, and the move above the early-August high was clearly invalidated. This means that we saw two small sell signals.
Once the GDXJ declines below the rising, green support line, it will be a good indication that the next big move lower is already underway. Right now, it’s quite possible, but not very likely. In other words, if we see more back-and-forth movement this week, it would still be normal in light of the analogy to 2013 and it would not be something bullish.
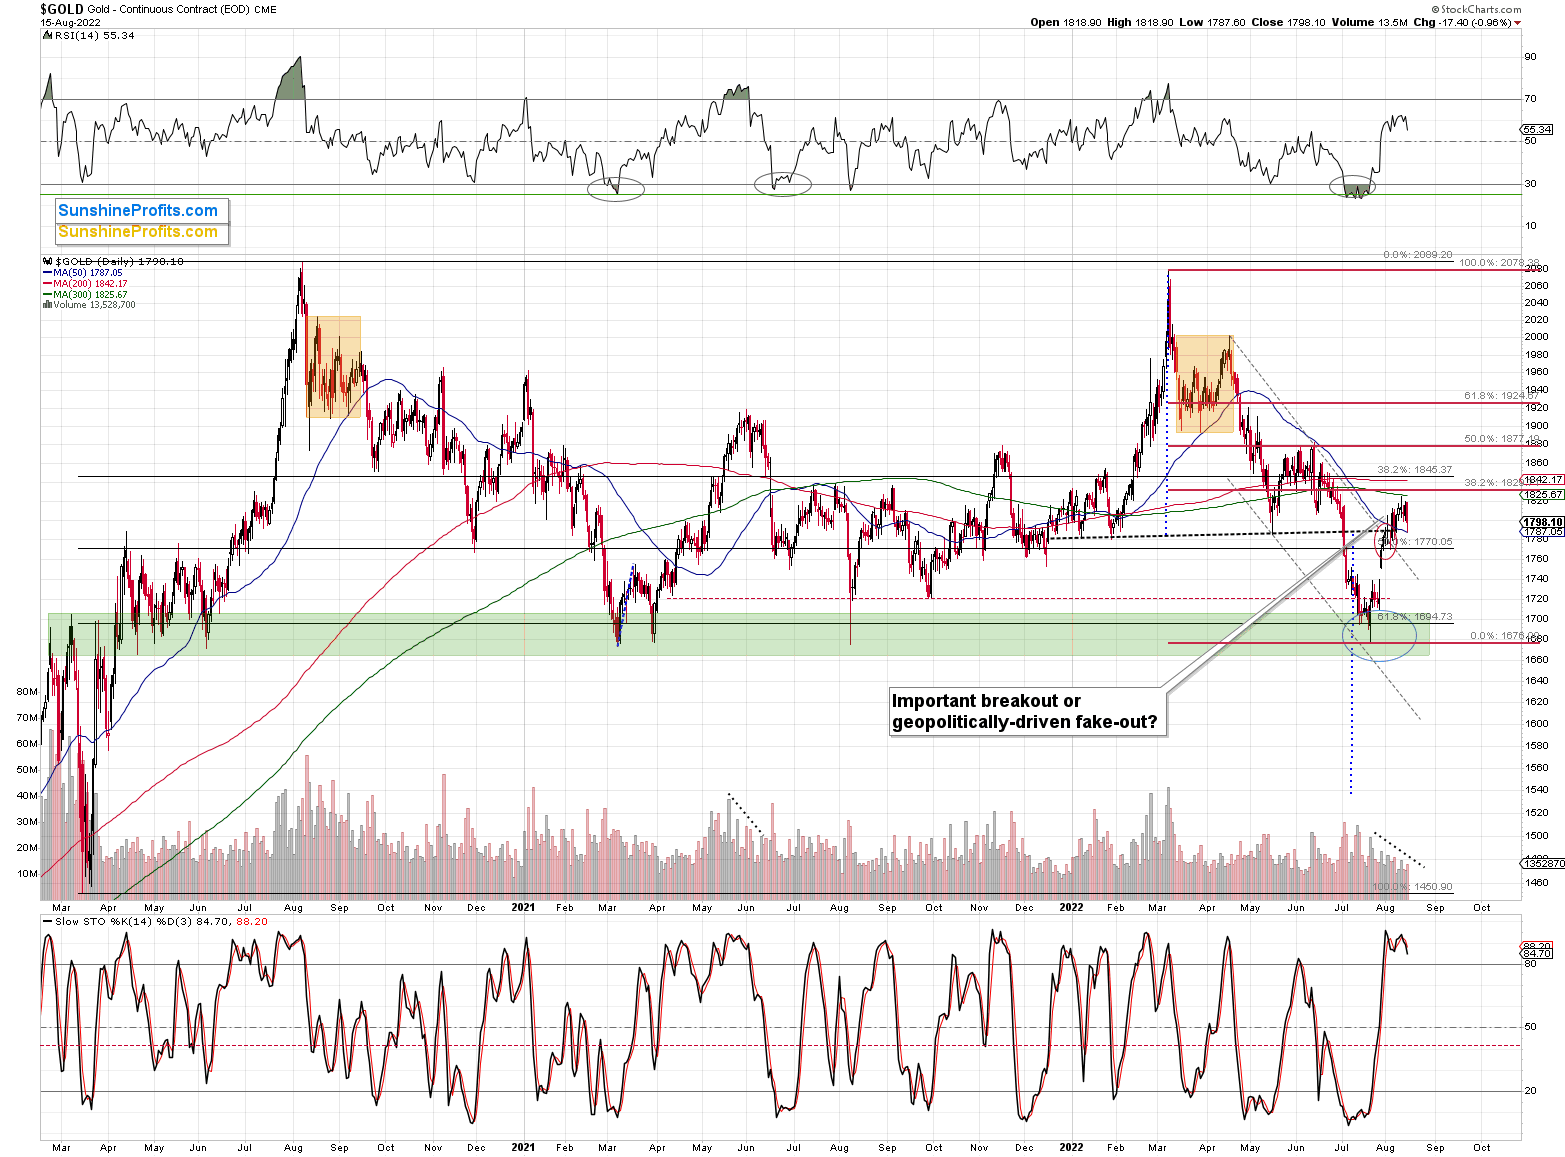
Gold declined by almost $20 yesterday, and it’s about $6 lower in today’s pre-market trading. The sell signal from the stochastic indicator is now clearer, which means that this rally could indeed be over.
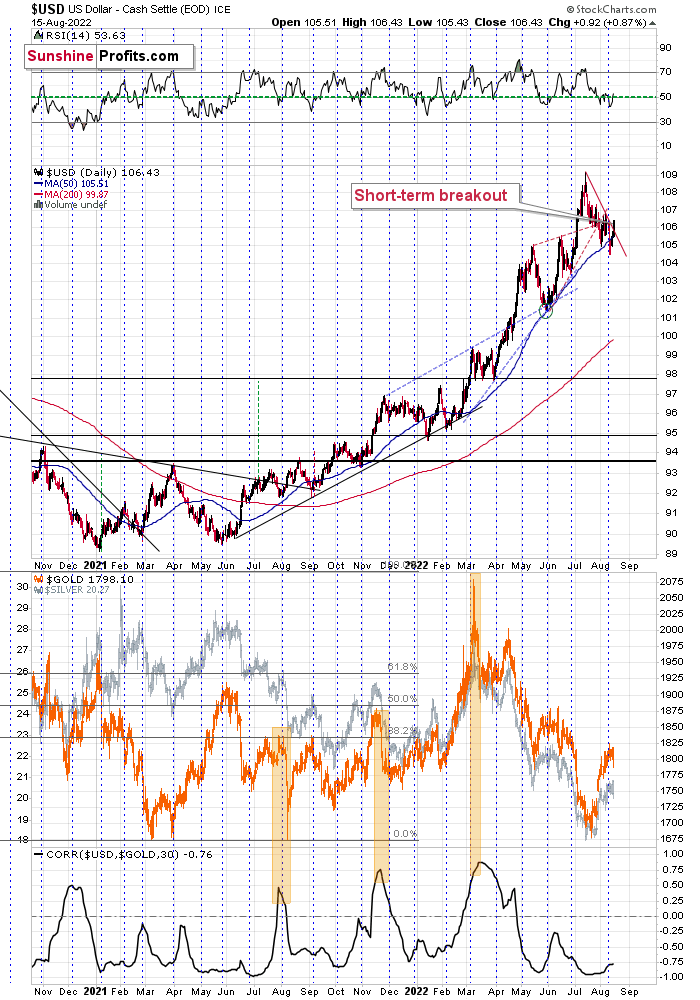
Another indication comes from the USD Index, which just moved above its declining red resistance line. It’s up by about 0.3 in today’s pre-market trading, which indicates that the move is likely to continue.
This fits the subtle clues coming from gold and junior miners – the top might already be in.
Even if it’s not, I think it remains a good idea to be already positioned to take advantage of lower prices in the precious metals sector, especially in the junior mining stocks.
Having said that, let’s take a look at the markets from a more fundamental angle.
Hope for the Best
With commodities getting whacked on Aug. 15, gold, silver, and mining stocks materially underperformed the S&P 500. Moreover, with bond and commodities markets more attentive to Fed officials’ hawkish threats, the general stock market is the lone member pricing in a dovish pivot.
However, since hope often leads to disappointment when it’s built on a sloppy foundation, the bulls don’t realize that the Fed’s inflation fight will be one of the most challenging fundamental contests in decades. Therefore, while investors believe that the hard work is done once the Consumer Price Index (CPI) slows, the reality is that the difficult times have only just begun.
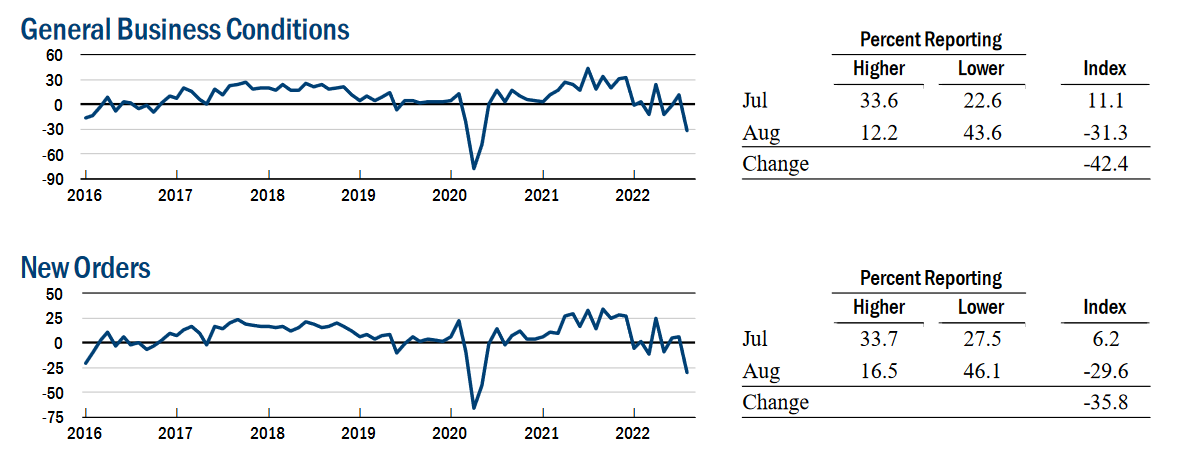
For example, the New York Fed released its Empire State Manufacturing Survey on Aug. 15. An excerpt read:
“Business activity declined sharply in New York State, according to firms responding to the August 2022 Empire State Manufacturing Survey. The headline general business conditions index plummeted forty-two points to -31.3. New orders and shipments plunged, and unfilled orders declined. Delivery times held steady for the first time in nearly two years, and inventories edged higher.”
Please see below:
 Source: New York Fed
However, while output fell off a cliff, there was “a small increase in employment” and the prices received index moved higher.
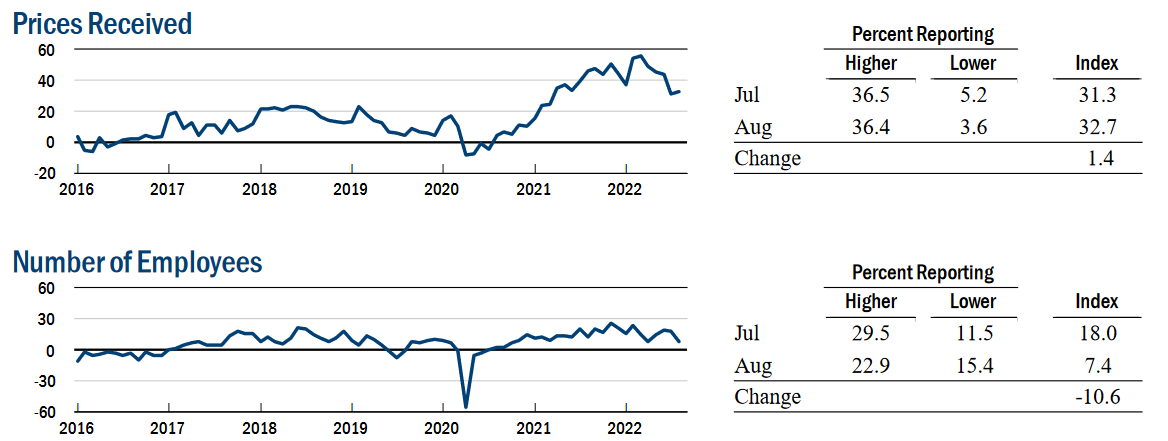 Source: New York Fed
Thus, while the sharp decline in output should have culminated in lower prices, the data highlights just how sticky inflation has become. Furthermore, if prices don’t decline when output craters in New York State, how can investors expect them to fall when S&P 500 companies still have resilient demand?
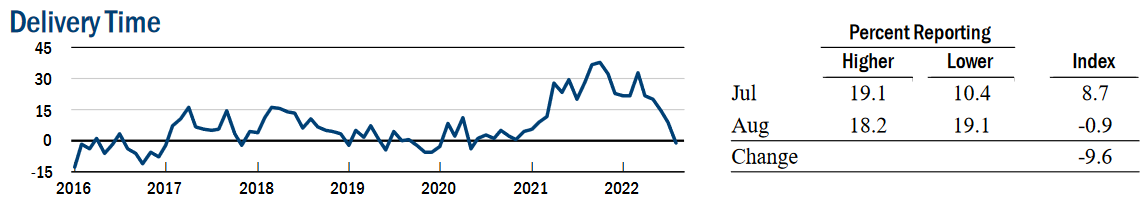
Furthermore, the report revealed:
“The delivery times index declined to around zero, indicating that delivery times held steady, the first month they have not lengthened in nearly two years.”
Please see below:
 Source: New York Fed
To explain, the Fed and the consensus blamed supply-chain disruptions for the recent bout of inflation. In a nutshell: COVID-19 restrictions suffocated shipping activity, and suppliers didn’t have the inventory to meet demand. Therefore, order backlogs surged, and prices increased as manufacturers bid against one another to obtain the scarce inputs.
However, while the New York Fed’s delivery times index is back near pre-COVID-19 levels, its prices received index is not. As a result, the normalization of supply chains has done little to curb inflation, and investors materially underestimate the challenges that lie ahead.
1970s Here Were Come
While the GDXJ ETF diverged from the S&P 500 on Aug. 15, a sharp decline in the latter would spell immense trouble for the former. Therefore, the general stock market is an important component of our investment thesis. Moreover, while the S&P 500 continued its ascent and the bulls have their sights set on new all-time highs, I warned on Aug. 15 that the fundamental outlook signals the exact opposite. I wrote:
After the FFR peaked in July 1973, the Fed cut interest rates to help support a weakening U.S. economy. However, with inflation still unanchored, the policy mistake led to an even higher FFR during the depths of the recession (the gray area).
Please see below:
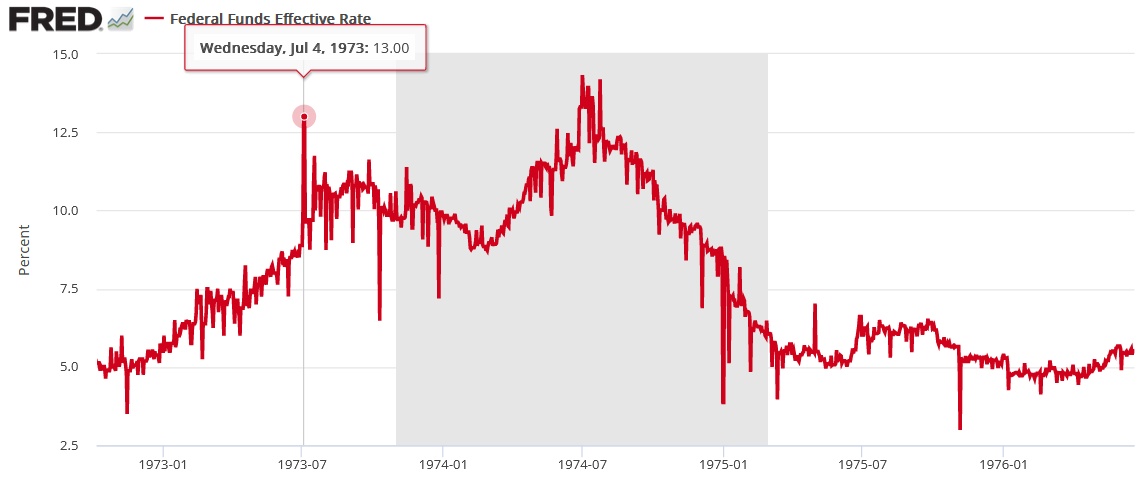
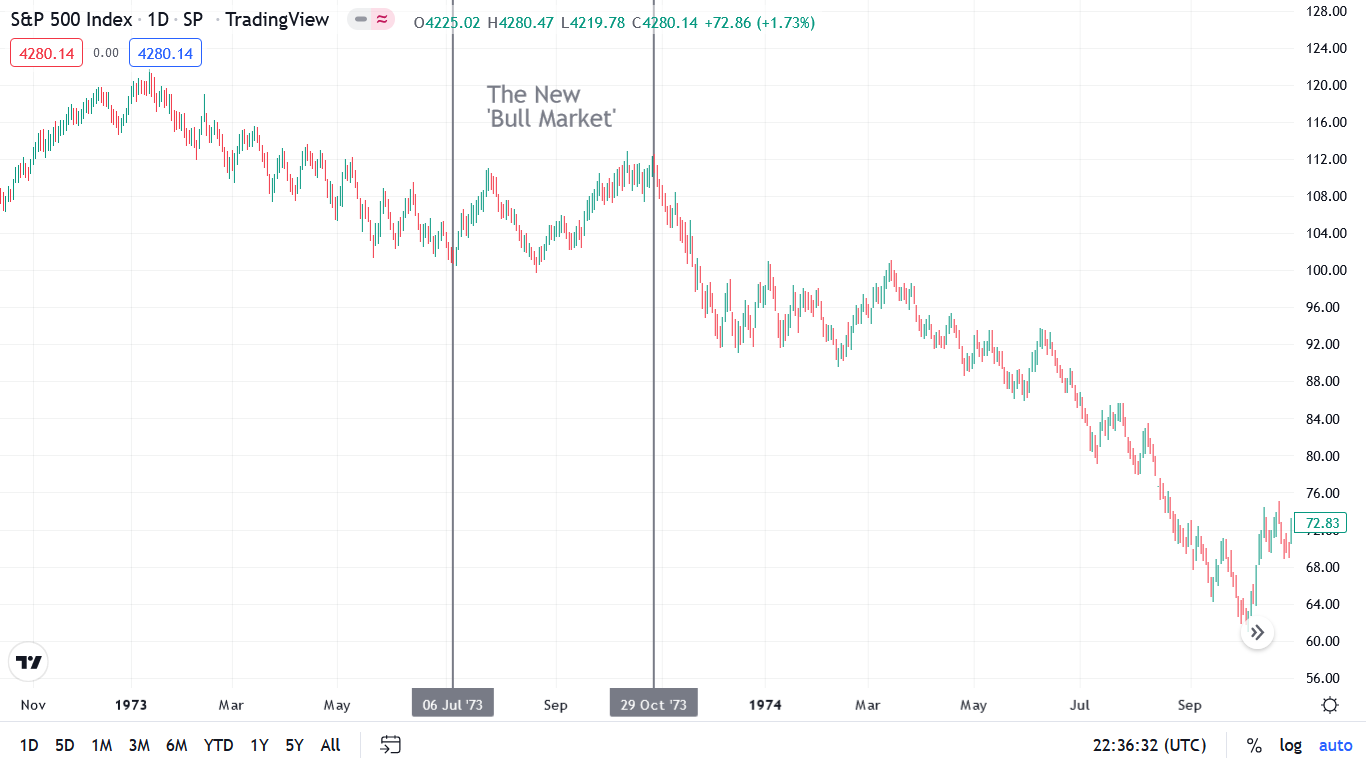
Likewise, the S&P 500 initially celebrated the dovish pivot. With uninformed investors assuming that cutting interest rates was the appropriate response, a sharp rally occurred in July 1973, followed by a sharp pullback and then another rally to a higher high. As a result, don’t you think the crowd was calling for a new bull market from July through October 1973? However, unanchored inflation forced the Fed to reverse course and the S&P 500 fell off a cliff.
Thus, we find ourselves in the same situation. With the consensus underestimating the destructive nature of inflation and overestimating the Fed's ability, the bulls should suffer a crisis of confidence over the medium term.
Please see below:
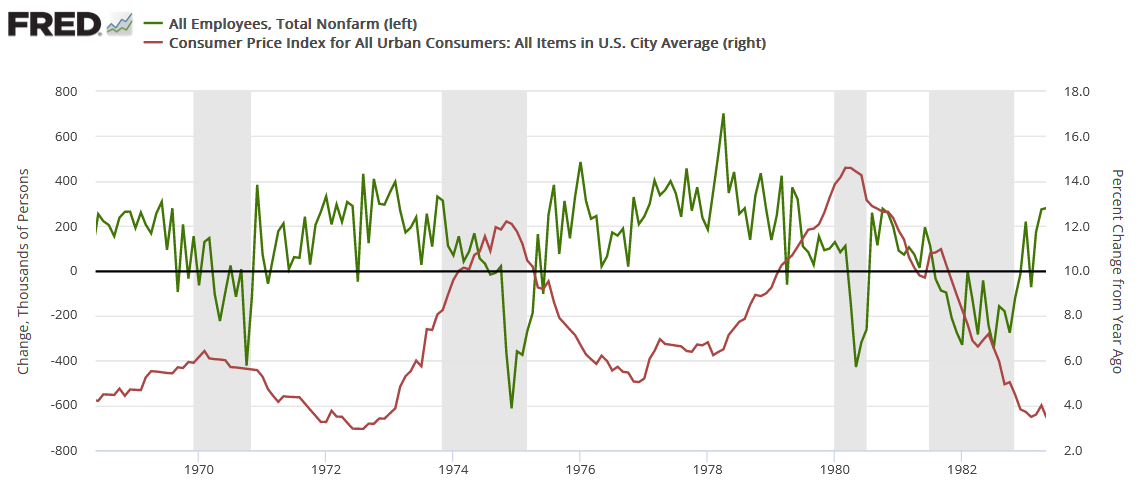
To explain, the red line above tracks the year-over-year (YoY) percentage change in the headline CPI, while the green line above tracks the monthly change in U.S. nonfarm payrolls. For context, the consensus cites near-record job openings and robust payroll growth as evidence for why only a mild recession can occur (if one occurs at all).
However, the chart above highlights how unanchored inflation torpedoed that narrative in the 1970s. If you analyze the shaded gray areas (recessions), notice how the green line remained positive during the early stages of the recessions in 1970, 1974, and 1980. In a nutshell: monthly payroll growth stayed positive during the outset of all three recessions.
However, if you focus your attention on the sharp drops in the green line near the end of the 1970, 1974, and 1980 recessions (negative monthly payrolls prints), you can see that reality re-emerged and the U.S. labor market suffered mightily. Moreover, negative payroll growth was also present during the 1982 recession, but inflation was declining at that time.
As such, it’s important to remember that U.S. nonfarm payrolls growth has been positive in every month except one since May 2020. Furthermore, the U.S. unemployment rate declined to 3.5% in July – its lowest level in ~50 years – and its relationship with the CPI has similar implications.
Please see below:
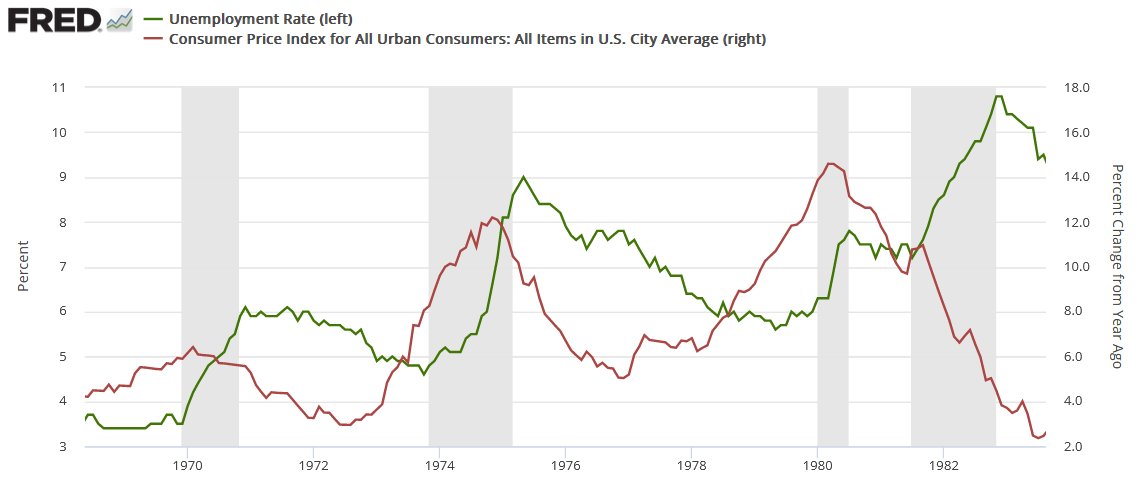
To explain, the red line above tracks the YoY percentage change in the headline CPI, while the green line above tracks the U.S. unemployment rate. As you can see, the 1970, 1974, and 1980 recessions culminated with high inflation and delayed spikes in unemployment. Moreover, while the 1982 recession had a diverging relationship, Paul Volcker made it his mission to eradicate inflation at all costs. Therefore, he understood the severity of the problem and didn’t want a repeat of the outcomes from 1970, 1974, and 1980.
Furthermore, notice how the U.S. unemployment rate always bottoms before a recession? Remember, bear markets don’t end with the U.S. unemployment rate at a ~50-year low; they begin with the metric at a ~50-year low.
To that point, even modern history highlights the uninformed nature of the bulls’ thesis.
Please see below:
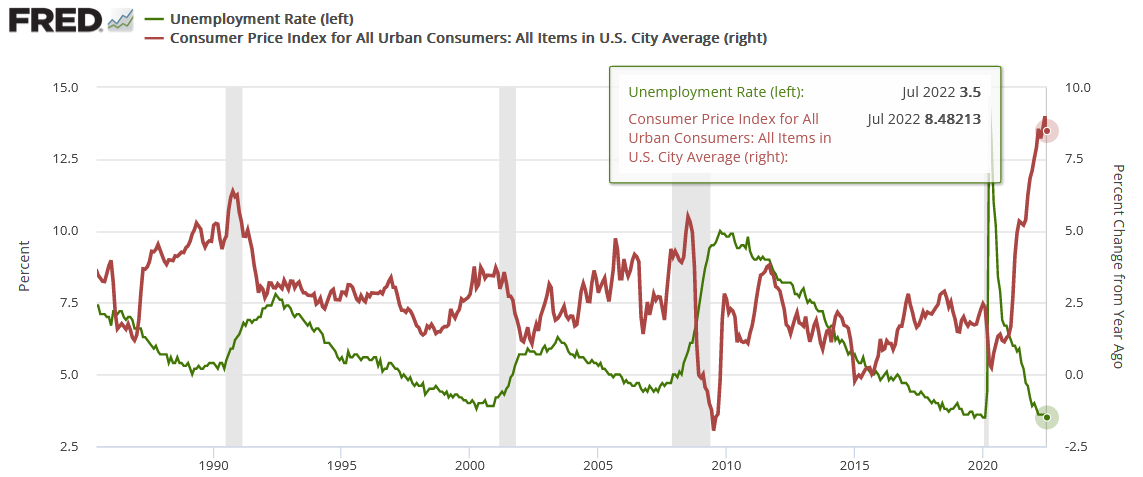
To explain, the recessions near 1990, 2000 and 2008 all began with cycle-low U.S. unemployment rates (the green line) and rising inflation (the red line). In addition, if you analyze the right side of the chart, you can see that the gap between the two is one for the ages. As such, can you guess where this story is headed next?
Finally, while I warned repeatedly that market participants underestimated the demand side of the inflation equation, the consensus still believes that supply-chain issues are the primary driver. However, with unanchored wage inflation poised to keep the pricing pressures uplifted for much longer than investors realize, the Fed will need to push the U.S. federal funds rate (FFR) much higher than 3%.
Please see below:
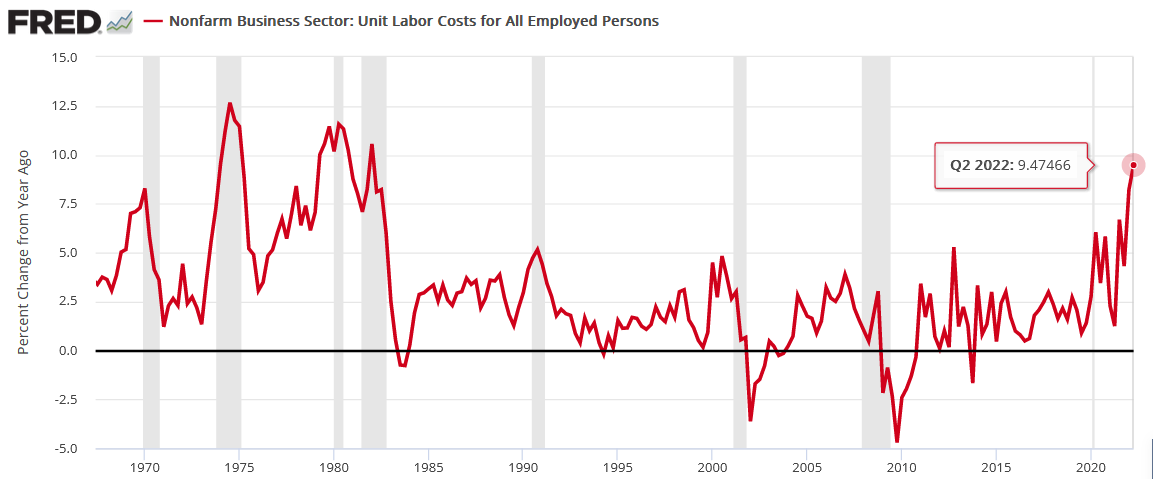
To explain, the red line above tracks the YoY percentage change in U.S. nonfarm unit labor costs from the late 1960s until today. For context, the metric combines wages and productivity to determine the labor costs incurred by U.S. businesses. In a nutshell: when the red line rises, labor is more expensive.
If you analyze the peaks, notice how unanchored labor costs were present during the 1970s and 1980s recessions. Furthermore, even modern history shows that spikes in labor costs occurred before/during the recessions near 1990, 2000 and 2008.
More importantly, the current reading is higher than 1970 and is only surpassed by 1974, 1980, and 1982. Thus, it may seem counterintuitive, but low unemployment, high wages, and high job openings (end-of-cycle metrics) are bearish, not bullish. As a result, the bulls are in la-la land, and the ‘this time is different’ crowd should suffer mightily when reality re-emerges.
The Bottom Line
While the PMs have rallied recently, they're still underperforming the S&P 500 and the NASDAQ Composite. Moreover, with the latter ignoring the bearish fundamentals at their own peril, a sharp re-rating of the general stock market should help push gold, silver and mining stocks to new 2022 lows. Likewise, while the bulls want you to believe that all is well on Wall Street, their success hinges on outcomes materializing that haven't occurred in 50+ years.
In conclusion, the PMs declined on Aug. 15, as most of the commodity complex was crushed. However, with little fear present in today's financial markets, asset prices are far from their fundamental values. As such, the medium-term outlook is profoundly bearish, and it's likely only a matter of time before sentiment reflects these realities.
Overview of the Upcoming Part of the Decline
- It seems to me that the corrective upswing is either over or about to be over, and that the next big move lower is about to start.
- If we see a situation where miners slide in a meaningful and volatile way while silver doesn’t (it just declines moderately), I plan to – once again – switch from short positions in miners to short positions in silver. At this time, it’s too early to say at what price levels this could take place and if we get this kind of opportunity at all – perhaps with gold prices close to $1,600.
- I plan to exit all remaining short positions once gold shows substantial strength relative to the USD Index while the latter is still rallying. This may be the case with gold prices close to $1,400. I expect silver to fall the hardest in the final part of the move. This moment (when gold performs very strongly against the rallying USD and miners are strong relative to gold after its substantial decline) is likely to be the best entry point for long-term investments, in my view. This can also happen with gold close to $1,400, but at the moment it’s too early to say with certainty.
- The above is based on the information available today, and it might change in the following days/weeks.
You will find my general overview of the outlook for gold on the chart below:
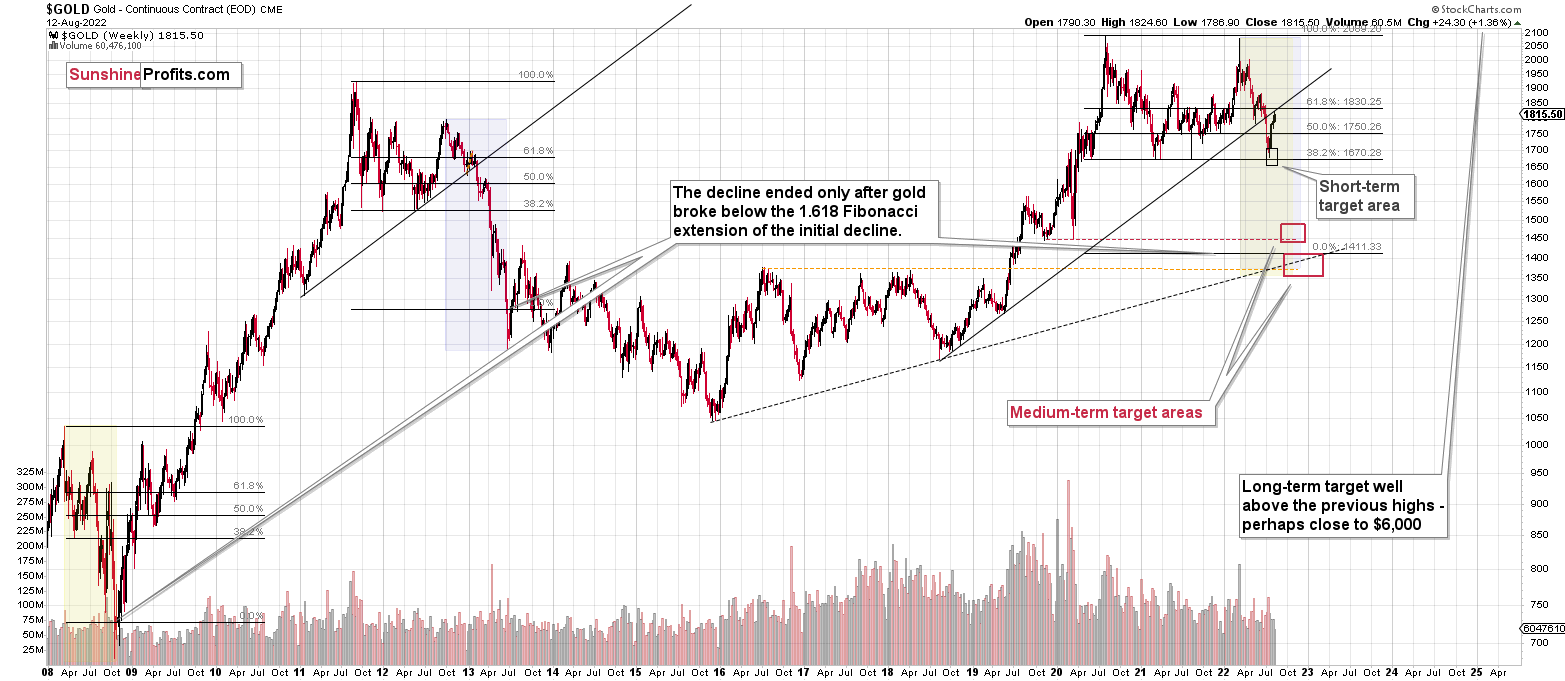
Please note that the above timing details are relatively broad and “for general overview only” – so that you know more or less what I think and how volatile I think the moves are likely to be – on an approximate basis. These time targets are not binding nor clear enough for me to think that they should be used for purchasing options, warrants, or similar instruments.
Summary
Summing up, it seems that the corrective upswing is over (or close to being over), which means that the powerful medium-term downtrend can now resume.
Two weeks ago, we closed yet another profitable trade in a row. This year’s profits are already enormous, but it seems likely to me that they will grow even more in the following weeks and months. In particular, I expect the profits on the current short positions to be really profound.
After the final sell-off (that takes gold to about $1,350-$1,500), I expect the precious metals to rally significantly. The final part of the decline might take as little as 1-5 weeks, so it's important to stay alert to any changes.
As always, we'll keep you – our subscribers – informed.
To summarize:
Trading capital (supplementary part of the portfolio; our opinion): Full speculative short positions (300% of the full position) in junior mining stocks are justified from the risk to reward point of view with the following binding exit profit-take price levels:
Mining stocks (price levels for the GDXJ ETF): binding profit-take exit price: $20.32; stop-loss: none (the volatility is too big to justify a stop-loss order in case of this particular trade)
Alternatively, if one seeks leverage, we’re providing the binding profit-take levels for the JDST (2x leveraged). The binding profit-take level for the JDST: $29.87; stop-loss for the JDST: none (the volatility is too big to justify a SL order in case of this particular trade).
For-your-information targets (our opinion; we continue to think that mining stocks are the preferred way of taking advantage of the upcoming price move, but if for whatever reason one wants / has to use silver or gold for this trade, we are providing the details anyway.):
Silver futures downside profit-take exit price: $12.32
SLV profit-take exit price: $11.32
ZSL profit-take exit price: $79.87
Gold futures downside profit-take exit price: $1,504
HGD.TO – alternative (Canadian) 2x inverse leveraged gold stocks ETF – the upside profit-take exit price: $19.87
HZD.TO – alternative (Canadian) 2x inverse leveraged silver ETF – the upside profit-take exit price: $49.87
Long-term capital (core part of the portfolio; our opinion): No positions (in other words: cash)
Insurance capital (core part of the portfolio; our opinion): Full position
Whether you’ve already subscribed or not, we encourage you to find out how to make the most of our alerts and read our replies to the most common alert-and-gold-trading-related-questions.
Please note that we describe the situation for the day that the alert is posted in the trading section. In other words, if we are writing about a speculative position, it means that it is up-to-date on the day it was posted. We are also featuring the initial target prices to decide whether keeping a position on a given day is in tune with your approach (some moves are too small for medium-term traders, and some might appear too big for day-traders).
Additionally, you might want to read why our stop-loss orders are usually relatively far from the current price.
Please note that a full position doesn't mean using all of the capital for a given trade. You will find details on our thoughts on gold portfolio structuring in the Key Insights section on our website.
As a reminder - "initial target price" means exactly that - an "initial" one. It's not a price level at which we suggest closing positions. If this becomes the case (as it did in the previous trade), we will refer to these levels as levels of exit orders (exactly as we've done previously). Stop-loss levels, however, are naturally not "initial", but something that, in our opinion, might be entered as an order.
Since it is impossible to synchronize target prices and stop-loss levels for all the ETFs and ETNs with the main markets that we provide these levels for (gold, silver and mining stocks - the GDX ETF), the stop-loss levels and target prices for other ETNs and ETF (among other: UGL, GLL, AGQ, ZSL, NUGT, DUST, JNUG, JDST) are provided as supplementary, and not as "final". This means that if a stop-loss or a target level is reached for any of the "additional instruments" (GLL for instance), but not for the "main instrument" (gold in this case), we will view positions in both gold and GLL as still open and the stop-loss for GLL would have to be moved lower. On the other hand, if gold moves to a stop-loss level but GLL doesn't, then we will view both positions (in gold and GLL) as closed. In other words, since it's not possible to be 100% certain that each related instrument moves to a given level when the underlying instrument does, we can't provide levels that would be binding. The levels that we do provide are our best estimate of the levels that will correspond to the levels in the underlying assets, but it will be the underlying assets that one will need to focus on regarding the signs pointing to closing a given position or keeping it open. We might adjust the levels in the "additional instruments" without adjusting the levels in the "main instruments", which will simply mean that we have improved our estimation of these levels, not that we changed our outlook on the markets. We are already working on a tool that would update these levels daily for the most popular ETFs, ETNs and individual mining stocks.
Our preferred ways to invest in and to trade gold along with the reasoning can be found in the how to buy gold section. Furthermore, our preferred ETFs and ETNs can be found in our Gold & Silver ETF Ranking.
As a reminder, Gold & Silver Trading Alerts are posted before or on each trading day (we usually post them before the opening bell, but we don't promise doing that each day). If there's anything urgent, we will send you an additional small alert before posting the main one.
Thank you.
Przemyslaw Radomski, CFA
Founder, Editor-in-chief

