

Briefly: in our opinion, full (300% of the regular position size) speculative short positions in mining stocks are justified from the risk/reward point of view at the moment of publishing this Alert.
The junior mining stocks’ extreme underperformance is the “new normal” that barely anyone talks about. Ignorance is pleasant, but it comes at a cost.
To be clear: it’s something very important right now. Juniors, as well as senior mining stocks, are very weak compared to gold, which means that they are not reacting to gold’s gains but multiplying gold’s declines instead. This doesn’t just mean that the profits on our short positions in juniors are increasing almost constantly – it also means that the entire precious metals sector is about to fall much further. This kind of underperformance preceded the 2013 slide, and we haven’t seen it – to this extent – in years. This is huge.
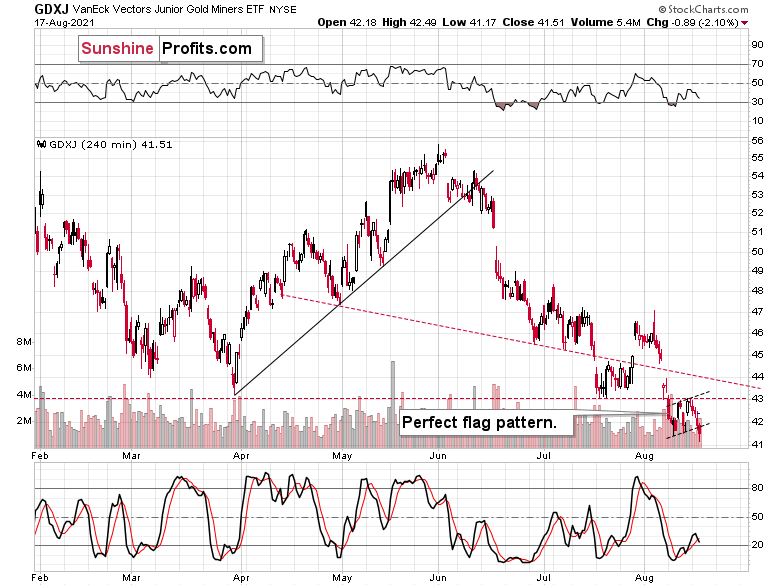
Junior gold miners – the GDXJ ETF – just moved to new 2021 lows after completing a flag pattern. This is bearish not only on its own but especially when compared to what gold did.
And gold….
Gold moved just $2 lower yesterday. This near-nothing was enough to trigger a breakdown to new lows in the related sector – junior mining stocks. Gold junior miners’ current performance is truly one of the weakest that I’ve ever seen.
And just imagine what horrors await the prices of the mining stocks if a mere $2 decline in gold was enough to trigger a breakdown to new lows. And gold seems to be about to slide once again!
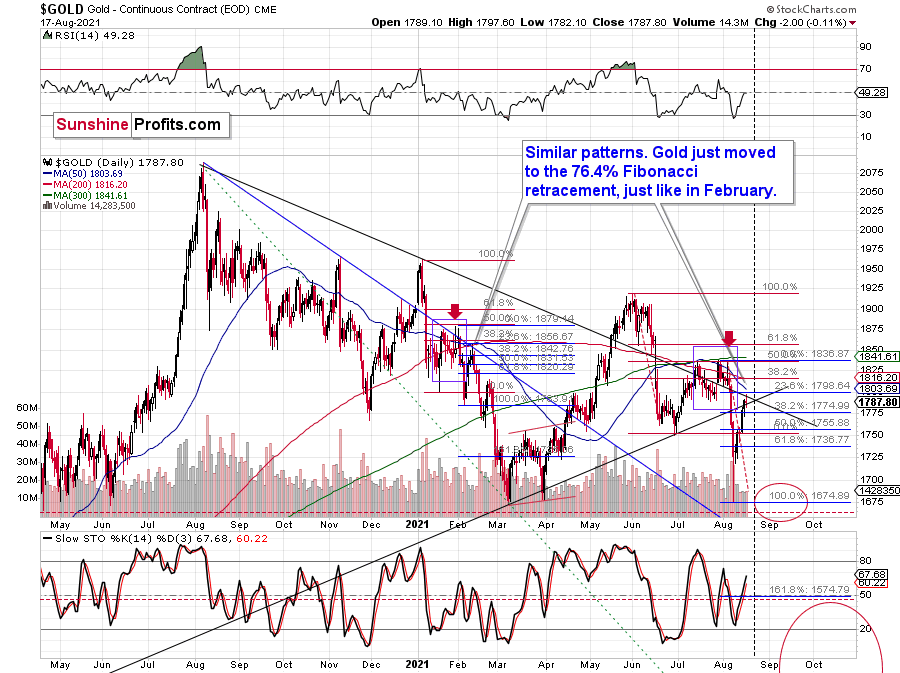
Now, based on the triangle-vertex-based reversal that’s due on Monday, it could be the case that gold waits a bit before sliding. However, given the similarity to how it declined in the first quarter of the year, it seems that the top in gold is either in or at hand.
I explained the similarity to Q1 before, but here’s a quick recap.
After declining sharply (January and June) and forming a double bottom with the second bottom slightly lower, it then corrected half of the decline forming more than one top close to the 50% retracement and then declined sharply once again.
Back in February 2021, gold corrected about 76.4% of the decline (which is a less popular but still a Fibonacci retracement level – marked with blue). Right now, this retracement is just below the $1,800 mark. So, if history rhymes once again, gold will be likely to move close to $1,800 and then decline once again.
I’ve recently been asked to compare the performance of the 10-year yields and gold on one chart and to comment on them.
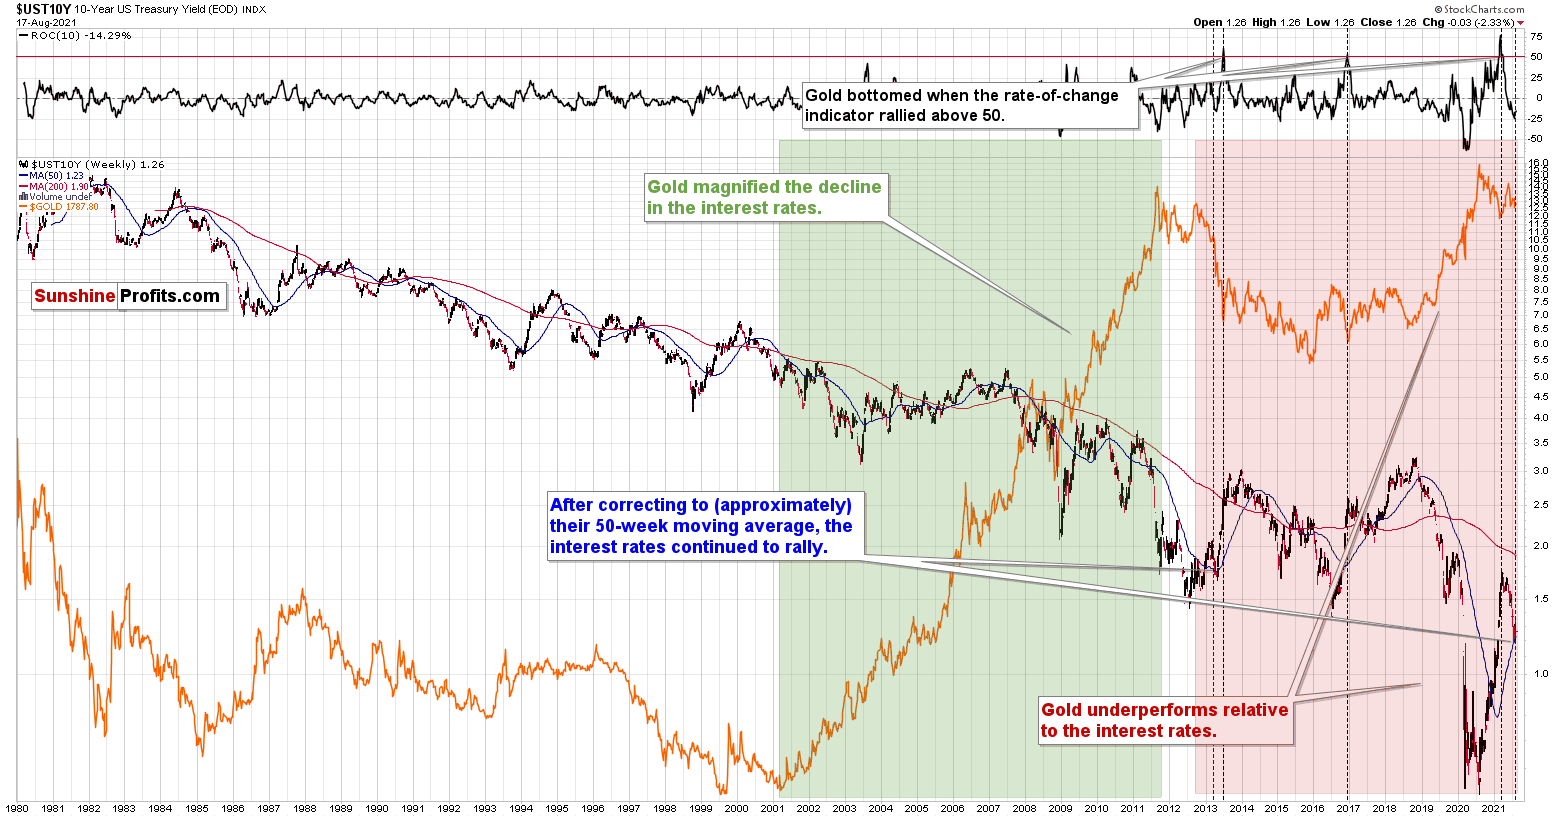
There are a couple of interesting things that the 10-year-yield chart and gold can tell us.
One of them is that when the ROC (rate of change) indicator based on the yields rallies above 50, it tends to correspond to medium-term bottoms in gold. This happened 3 times in the past 40+ years, and it worked in each case. This is likely to be important in a couple of months, but it's not that relevant today.
Another interesting feature is that, overall, gold has not been performing well relative to the long-term yields. Between 2001 and 2011, gold was performing very well relative to yields – soaring when the yields were declining. However, that has not been the case since late 2012. Sure, gold managed to briefly move above its 2011 highs before invalidating the breakout and declining, but please compare how huge a decline in yields it took to trigger this move.
The decline in rates that made gold more than double its price from the 2008 bottom was relatively small (from ~2% to about ~1.5%). And the decline in yields from 1.5% in mid-2019 to about 0.5% in mid-2020 made gold increase its value by “only” 1/3. Again – a decade ago it took half a percentage point to make gold double, and now it took a full percentage point to make gold increase its value by only 1/3. Sure, 1/3 of gold’s price is a lot on a nominal level, but when compared to doubling its value, it’s much smaller. And when compared with the size of the moves in rates, it turns out that gold was now about 6 times less inclined to rally when the rates declined.
This seems bearish for gold at first glance, and it is such in reality.
The final observation is the most concrete and the most actionable. As I described in my previous gold trading analyses, what we are seeing now in gold is very similar to what we saw in 2012-2013, and the above-mentioned super-weak performance of gold stocks confirms it.
What’s very interesting is that after gold’s final top and yield’s final bottom (mid-2012), the yields rallied, and then they corrected to more or less their 50-week moving average. And when that was taking place, gold moved close to their previous lows (that was before the biggest part of the plunge).
Why would the above be very interesting? Because gold is also after a corrective upswing and the yields are after a corrective downswing that took them to more or less their 50-week moving average. If history rhymes, it seems that we’re about to see another big move higher in the rates and another big move lower in the price of gold.
The Economic Symposium in Jackson Hole and the news coming from it could trigger the above-mentioned moves. The September FOMC is another candidate. Then again, since markets are forward-looking, any piece of news that could hint at the upcoming tapering could trigger the moves. That’s what the weak performance of gold juniors vs. gold tells us – the market is ready to slide, and when the trigger comes is not that important. In fact, the precious metals market is likely to decline even without a specific news-based trigger.
Having said that, let’s take a look at the markets from a more fundamental angle.
The Temperature Is Rising
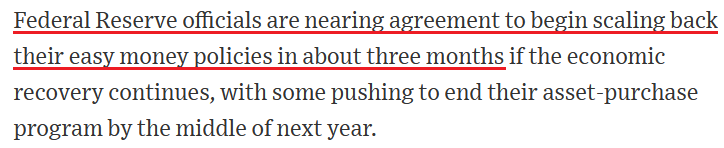
With the USD Index rising, the GDXJ ETF falling and the S&P 500 languishing, investors’ anxiety has accelerated once again. And while a profound drawdown of U.S. equities could hasten the PMs’ likely decline, the U.S. Federal Reserve’s (FED) taper timeline has already suffocated all of their optimism.
To explain, The Wall Street Journal (WSJ) reported on Aug. 16 that FED officials are “nearing an agreement” to scale back their bond-buying program. Essentially, officials want to maintain “flexibility” and “enable them to raise interest rates sooner than currently anticipated if the economy makes rapid progress toward their goals.”
Please see below:
 Source: WSJ
Likewise, Boston FED President Eric Rosengren told CNBC on Aug. 16 that “I think it’s appropriate to start in the fall. That would be October or November. I certainly wouldn’t want to wait any later than December. My preference would be probably for sooner rather than later.”
In addition, while Chairman Jerome Powell said on Aug. 17 that the pandemic is “still casting a shadow on economic activity [and] we cannot declare victory yet,” the FED chief didn’t exactly quell the hawkish sentiment. He added that companies “have adapted their business models to the new world [and that] people and businesses have improvised and learned to adapt [and] to live their lives despite COVID.” Thus, with Powell not playing the Delta variant card, the lack of dovish pushback is actually quite hawkish.
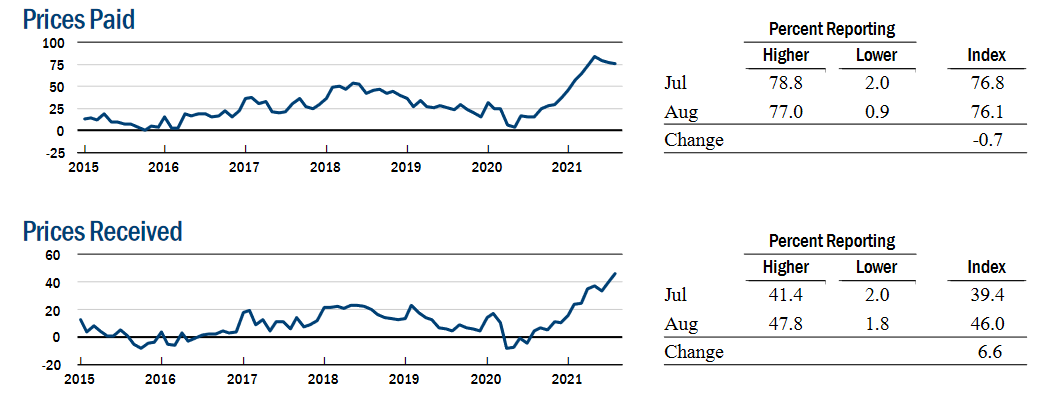
To that point, while the latest strain upends economic activity, supply-side inflation is only accelerating. For example. while the New York FED’s Empire State Manufacturing Index declined precipitously on Aug. 16 – as the “general business conditions index fell twenty-five points to 18.3” – the report revealed:
“Both price indexes remained at or near record highs: the prices paid index held steady at 76.1, while the prices received index climbed seven points to 46.0, setting a new record.”
Please see below:
 Source: New York FED
In addition, while the Delta variant dominates the current headlines, manufacturers in New York State are actually quite sanguine about the six-month outlook:
“The index for future business conditions climbed seven points to 46.5, pointing to ongoing optimism about future conditions. The indexes for future new orders and shipments rose to similar levels. Substantial increases in employment and prices are expected in the months ahead.”
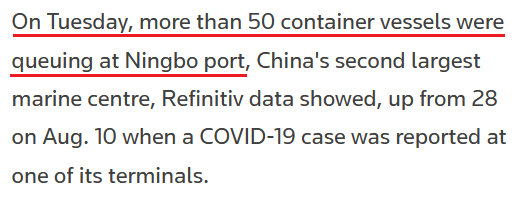
To that point, China's "zero-tolerance" policy on COVID-19 has brought activity at the Ningbo-Zhoushan container port (the world’s third-busiest shipping port) to a standstill. And with that, Dawn Tiura, CEO of Sourcing Industry Group, said on Aug. 17 that “China's zero tolerance policy is good for the pandemic but bad for the supply chain. This timing is very tough considering the uptick in back-to-school and return-to-work shopping in addition to the upcoming holiday shopping season.”
Please see below:
 Source: Reuters
To explain the inflationary impact of China’s shipping operations, I wrote previously:
With the U.S. Census Bureau revealing on Jun. 8 that U.S. imports from China (goods) totaled nearly $38 billion in April, more and more data signals that the U.S. economy will continue to feel the inflationary burn. Shipping costs are also exploding at an unprecedented rate.
Please see below:
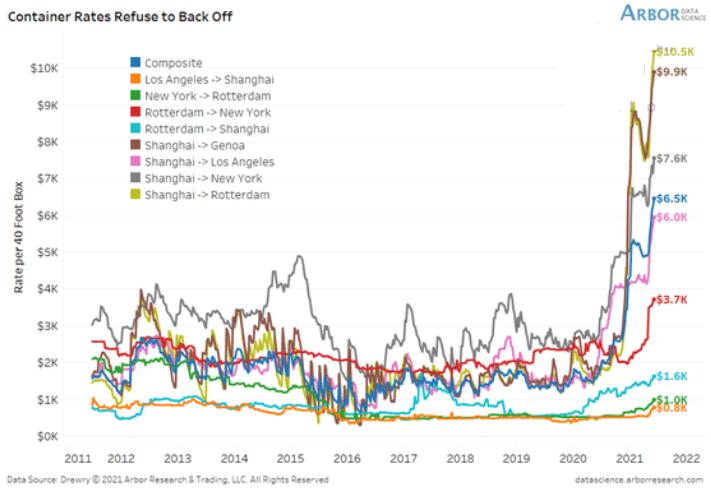
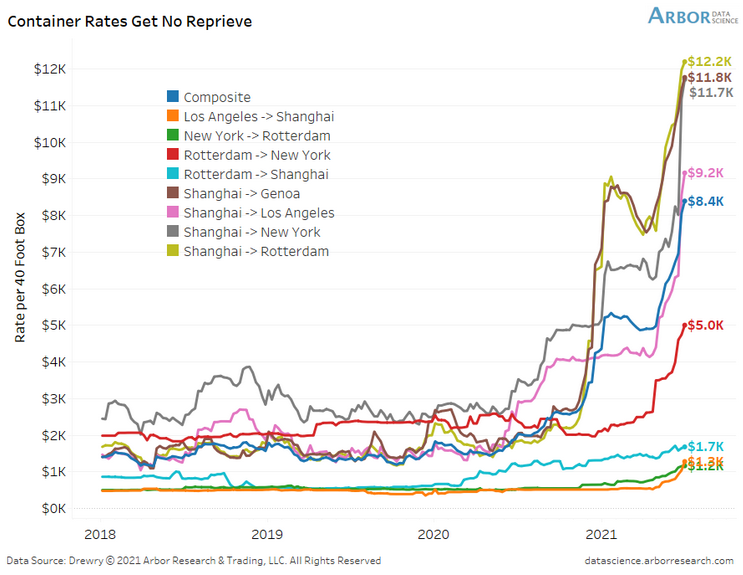
To explain, the lines above track the shipping costs to-and-from various regions. If you analyze the dark blue line sandwiched in the middle ($6.5K), average shipping costs continue to skyrocket. Moreover, if you’re shipping from Shanghai to Rotterdam, New York or Genoa, global businesses are nowhere near solving these “transitory” issues.
And providing another update on Jun. 28, the situation has only worsened.
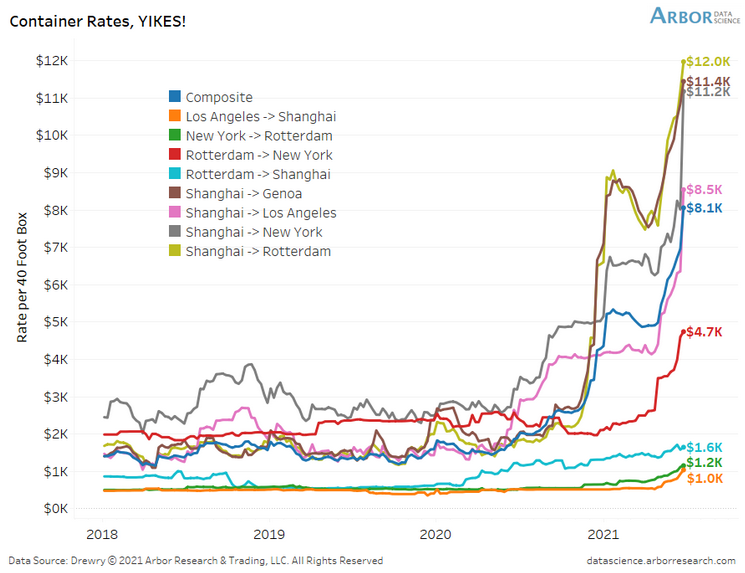
To explain, if you compare the first chart to the one directly above, you can see that the composite container rate (the dark blue line) has increased from $6.5K to $8.1K in only two weeks. What’s more, shipping from Shanghai to Rotterdam (the gold line) has increased from $10.5K to $12.0k, while Shanghai to New York (the gray line) has risen from $7.6K to $11.2K. As a result, does it seem like inflationary pressures are a thing of the past?
Moreover, with the old adage implying that ‘the third time’s a charm,’ the surge lives on.
Please see below:
To explain, the composite container rate has now gone from $6.5K to $8.1K to $8.4K in less than a month. And with shipping costs from China (Shanghai) leading the charge, the FED’s “transitory” narrative still lacks empirical credibility.
To that point, can you guess which trading partner accounts for 17.3% of U.S. imports?
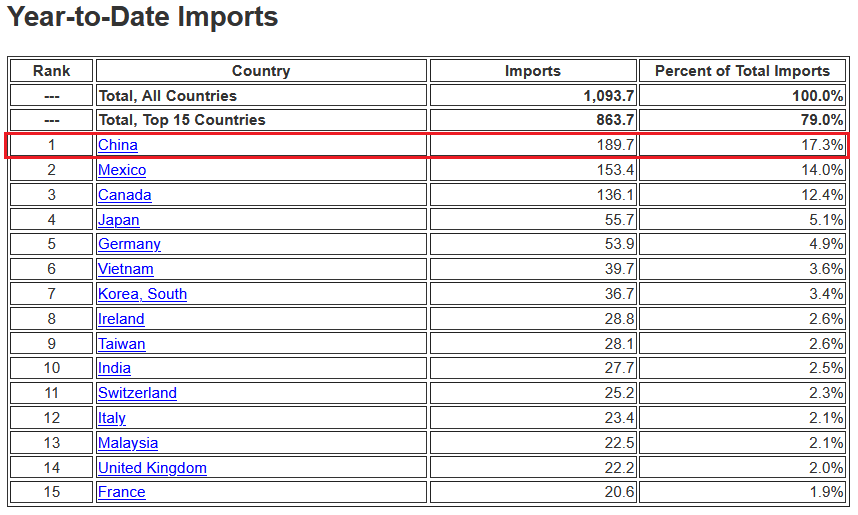 Source: U.S. Census Bureau
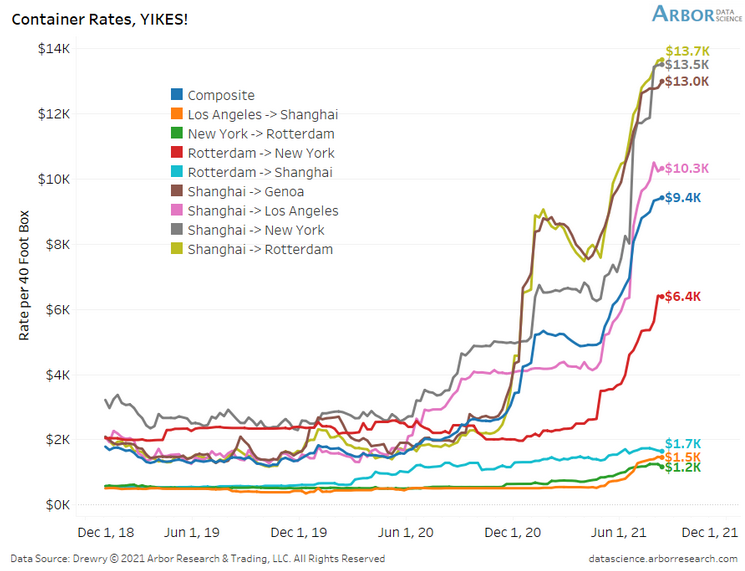
And after another appetizing update, the composite container rate has now gone from $6.5K to $8.1K to $8.4K to 9.4K.
Please see below:
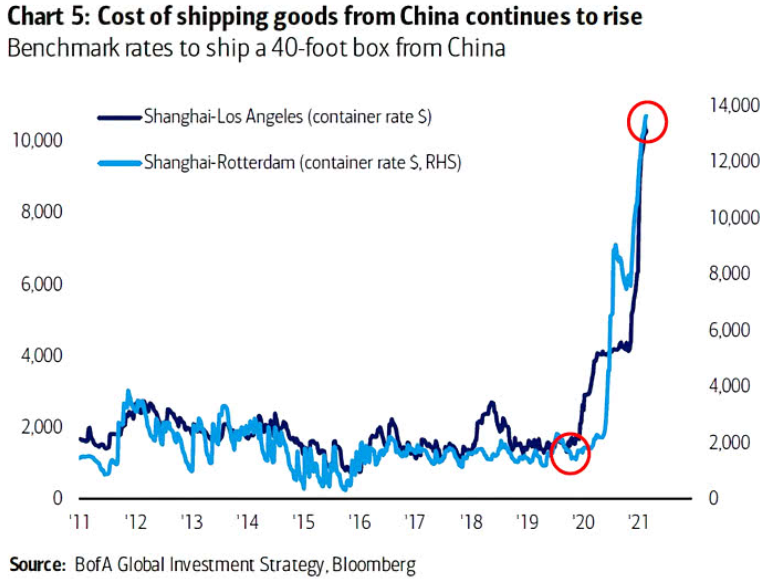
As further evidence, data from Bank of America shows a similar surge. And with the new restrictions in China only adding to the supply chain disruptions, the inflationary momentum remains robust.
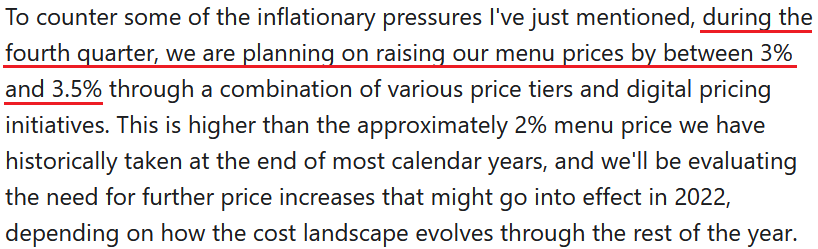
On top of that, Shake Shack – an American fast casual restaurant chain – also sounded the inflationary alarm during the company’s second-quarter earnings call on Aug. 5. CFO Katherine Fogertey said:
“Food and paper costs in the second quarter were 30.3% of Shack sales, an increase of 70 basis points from the first quarter, driven primarily by beef inflation. We expect to realize the impact of chicken inflation in the second half of the year as we roll out the beneficial locked-in pricing achieved in the first half. These costs are expected to remain somewhat elevated from the levels we achieved at the outset of the year …. Given industry-wide staffing challenges and our significant growth goals, we are making meaningful investments in our teams, and we expect wage inflation in the second half of 2021 to be in the high single-digit range. In line with our prior guidance, we still expect wage inflation for the full year to be in the mid-single-digit range.”
And how is the company responding to the inflationary pressures?
 Source: Shake Shack/The Motely Fool
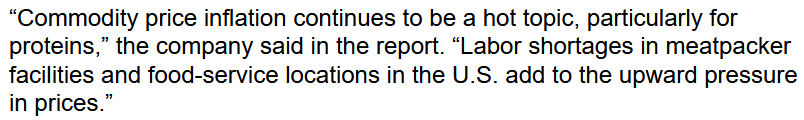
Singing a similar tune, Bloomberg obtained an internal memo from Restaurant Brands International on Aug. 17 – the parent company of Burger King, Popeyes and Tim Hortons – that noted how labor shortages (due to enhanced unemployment benefits) in the meatpacking industry have put “upward pressure” on beef and pork prices.
Please see below:
 Source: Bloomberg
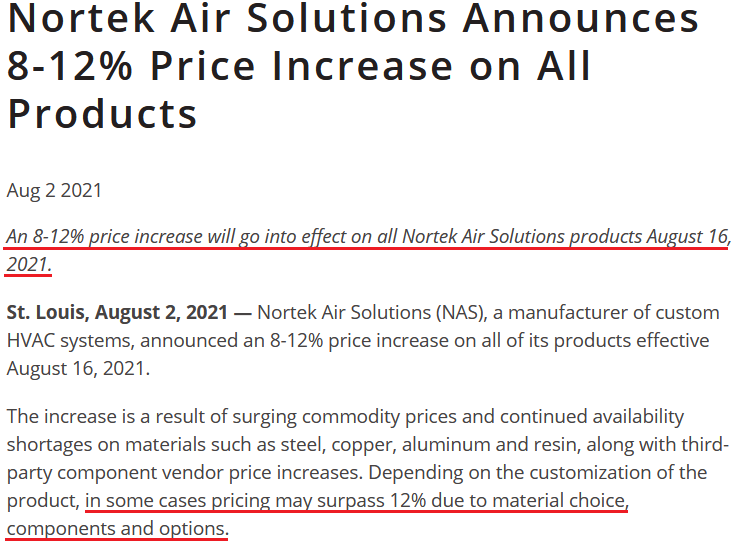
As another warning sign, Nortek Air Solutions – one of the largest manufacturers of custom heating, ventilation and air conditioning (HVAC) products in North America – warned on Aug. 2 that “surging commodity prices and continued availability shortages on materials such as steel, copper, aluminum and resin, along with third-party component vendor price increases” have led to an 8% to 12% price increase across its entire range of products.
Please see below:
 Source: Nortek Air Solutions
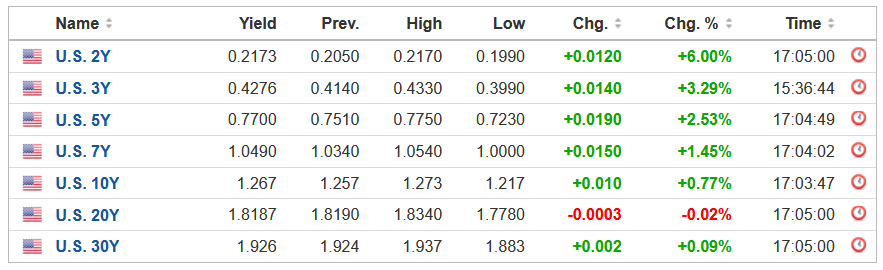
Finally, while disappointing retail sales and the Delta variant led to a sea of red across the financial markets on Aug. 17, the front-end of the U.S. yield curve soared. And with surging inflation likely to force the FED’s hand in the coming months, lower lows will likely confront the PMs over the medium term.
 Source: Investing.com
In conclusion, the gold miners suffered mightily on Aug. 17, as volatility erupted across nearly all asset classes. And because the PMs don’t operate in a vacuum, if the general stock market suffers a profound correction, the metals are unlikely to side-step the negativity. On the flip side, if (once) the Delta variant fades and the sun shines once again, the FED’s taper timeline is bullish for the USD Index and economic stabilization is also bullish for the U.S. 10-Year Treasury yield (which is already trading at an all-time low relative to realized inflation). As a result, with plenty of upside catalysts confronting assets that are negatively correlated with the PMs, another slide will likely occur before an attractive buying opportunity presents itself.
Overview of the Upcoming Part of the Decline
- The corrective upswing in gold is over, and the big decline seems to be already underway.
- After miners slide in a meaningful and volatile way, but silver doesn’t (and it just declines moderately), I plan to switch from short positions in miners to short positions in silver. At this time, it’s too early to say at what price levels this would take place – perhaps with gold close to $1,600. I plan to exit those short positions when gold shows substantial strength relative to the USD Index, while the latter is still rallying. This might take place with gold close to $1,350 - $1,500 and the entire decline (from above $1,900 to about $1,475) would be likely to take place within 6-20 weeks, and I would expect silver to fall the hardest in the final part of the move. This moment (when gold performs very strongly against the rallying USD and miners are strong relative to gold – after gold has already declined substantially) is likely to be the best entry point for long-term investments, in my view. This might also happen with gold close to $1,475, but it’s too early to say with certainty at this time.
- As a confirmation for the above, I will use the (upcoming or perhaps we have already seen it?) top in the general stock market as the starting point for the three-month countdown. The reason is that after the 1929 top, gold miners declined for about three months after the general stock market started to slide. We also saw some confirmations of this theory based on the analogy to 2008. All in all, the precious metals sector would be likely to bottom about three months after the general stock market tops.
- The above is based on the information available today, and it might change in the following days/weeks.
Please note that the above timing details are relatively broad and “for general overview only” – so that you know more or less what I think and how volatile I think the moves are likely to be – on an approximate basis. These time targets are not binding or clear enough for me to think that they should be used for purchasing options, warrants or similar instruments.
Summary
To summarize, the corrective upswing in gold is over, and it seems that the big downswing in gold, silver, and mining stocks is already underway. I previously warned you that “the next few days may (!) bring some back-and-forth action instead of the decline’s continuation,” and I also wrote that it was unlikely that this would take place for long. It seems that it is exactly what happened – we saw some back and forth action, and while gold’s last week’s performance might seem bullish at first glance, neither gold’s volume, nor action in silver nor mining stocks confirm it. In fact, silver’s and junior miners’ breakdowns to new yearly lows were confirmed.
Based on the self-similar pattern in gold (similarity is mostly to the 2011-2013 period), gold is likely to decline to its previous 2021 lows relatively soon, even if it doesn’t happen right away. Based on the analogies to the recent past, it seems quite likely that gold will move lower in the following days and bottom in the second half of August.
It seems that our profits from the short position in the junior mining stocks are going to grow substantially in the following weeks.
After the sell-off (that takes gold to about $1,350 - $1,500), I expect the precious metals to rally significantly. The final part of the decline might take as little as 1-5 weeks, so it's important to stay alert to any changes.
Most importantly, please stay healthy and safe. We made a lot of money last March and this March, and it seems that we’re about to make much more on the upcoming decline, but you have to be healthy to enjoy the results.
As always, we'll keep you - our subscribers - informed.
To summarize:
Trading capital (supplementary part of the portfolio; our opinion): Full speculative short positions (300% of the full position) in mining stocks are justified from the risk to reward point of view with the following binding exit profit-take price levels:
Mining stocks (price levels for the GDXJ ETF): binding profit-take exit price: $37.12; stop-loss: none (the volatility is too big to justify a stop-loss order in case of this particular trade)
Alternatively, if one seeks leverage, we’re providing the binding profit-take levels for the JDST (2x leveraged) and GDXD (3x leveraged – which is not suggested for most traders/investors due to the significant leverage). The binding profit-take level for the JDST: $15.96; stop-loss for the JDST: none (the volatility is too big to justify a SL order in case of this particular trade); binding profit-take level for the GDXD: $37.02; stop-loss for the GDXD: none (the volatility is too big to justify a SL order in case of this particular trade).
For-your-information targets (our opinion; we continue to think that mining stocks are the preferred way of taking advantage of the upcoming price move, but if for whatever reason one wants / has to use silver or gold for this trade, we are providing the details anyway.):
Silver futures upside profit-take exit price: unclear at this time - initially, it might be a good idea to exit, when gold moves to $1,683
Gold futures upside profit-take exit price: $1,683
HGD.TO – alternative (Canadian) inverse 2x leveraged gold stocks ETF – the upside profit-take exit price: $12.88
Long-term capital (core part of the portfolio; our opinion): No positions (in other words: cash
Insurance capital (core part of the portfolio; our opinion): Full position
Whether you already subscribed or not, we encourage you to find out how to make the most of our alerts and read our replies to the most common alert-and-gold-trading-related-questions.
Please note that we describe the situation for the day that the alert is posted in the trading section. In other words, if we are writing about a speculative position, it means that it is up-to-date on the day it was posted. We are also featuring the initial target prices to decide whether keeping a position on a given day is in tune with your approach (some moves are too small for medium-term traders, and some might appear too big for day-traders).
Additionally, you might want to read why our stop-loss orders are usually relatively far from the current price.
Please note that a full position doesn't mean using all of the capital for a given trade. You will find details on our thoughts on gold portfolio structuring in the Key Insights section on our website.
As a reminder - "initial target price" means exactly that - an "initial" one. It's not a price level at which we suggest closing positions. If this becomes the case (like it did in the previous trade), we will refer to these levels as levels of exit orders (exactly as we've done previously). Stop-loss levels, however, are naturally not "initial", but something that, in our opinion, might be entered as an order.
Since it is impossible to synchronize target prices and stop-loss levels for all the ETFs and ETNs with the main markets that we provide these levels for (gold, silver and mining stocks - the GDX ETF), the stop-loss levels and target prices for other ETNs and ETF (among other: UGL, GLL, AGQ, ZSL, NUGT, DUST, JNUG, JDST) are provided as supplementary, and not as "final". This means that if a stop-loss or a target level is reached for any of the "additional instruments" (GLL for instance), but not for the "main instrument" (gold in this case), we will view positions in both gold and GLL as still open and the stop-loss for GLL would have to be moved lower. On the other hand, if gold moves to a stop-loss level but GLL doesn't, then we will view both positions (in gold and GLL) as closed. In other words, since it's not possible to be 100% certain that each related instrument moves to a given level when the underlying instrument does, we can't provide levels that would be binding. The levels that we do provide are our best estimate of the levels that will correspond to the levels in the underlying assets, but it will be the underlying assets that one will need to focus on regarding the signs pointing to closing a given position or keeping it open. We might adjust the levels in the "additional instruments" without adjusting the levels in the "main instruments", which will simply mean that we have improved our estimation of these levels, not that we changed our outlook on the markets. We are already working on a tool that would update these levels daily for the most popular ETFs, ETNs and individual mining stocks.
Our preferred ways to invest in and to trade gold along with the reasoning can be found in the how to buy gold section. Furthermore, our preferred ETFs and ETNs can be found in our Gold & Silver ETF Ranking.
As a reminder, Gold & Silver Trading Alerts are posted before or on each trading day (we usually post them before the opening bell, but we don't promise doing that each day). If there's anything urgent, we will send you an additional small alert before posting the main one.
Thank you.
Przemyslaw Radomski, CFA
Founder, Editor-in-chief

