

Briefly: in our opinion, full (300% of the regular position size) speculative short positions in junior mining stocks are justified from the risk/reward point of view at the moment of publishing this Alert.
PLEASE NOTE:
Dear Subscribers,
As the Author will be traveling this week, upcoming Gold & Silver Trading Alerts will not include regular technical analysis. Instead, they will focus on the fundamental aspects. The next regular technical analysis will be published on Monday, August 29. PR will inform you about significant changes (which are unlikely).
Stay tuned!
Financial markets hold their breath before Powell’s bankers’ symposium speech. What would he have to say to change the bearish outlook for gold stocks?
The mood on Wall Street is relatively sleepy, as investors are unsure of how to position ahead of Powell’s Jackson Hole speech on Aug. 26. As a result, the PMs painted a mixed picture, as gold rose by 0.02%, silver fell by 0.63%, the GDX ETF rose by 0.82% and the GDXJ ETF rose by 1.76%. Moreover, the miners were aided by a 0.29% rise in the S&P 500, and the USD Index closed relatively flat, up by 0.06%.
Conversely, U.S. Treasury yields continued their ascent, and many markets have re-priced in hawkish directions. Thus, the PMs’ recent strength is much more semblance than substance.
Expecting the Impossible
With the late-summer sun offering a quiet reprieve for risk assets, the panic we witnessed in June has transformed into tranquility. Moreover, with recession fears declining materially and the Fed’s inflation fight seen as nearly complete, the consensus expects the Fed to work miracles and re-ignite another bull market.
However, the cross-asset implications signal materially different outcomes. For example, the Cleveland Fed forecasts another flat month of U.S. headline inflation, which has market participants assuming the Consumer Price Index (CPI) is on the fast track to 2%.
However, while prospect has helped uplift the S&P 500, as more buy into the notion of a soft landing, the U.S. 10-Year breakeven inflation rate rose to 2.62% on Aug. 24. Moreover, while the metric is well off its high of 3.02% set in April, why are 10-year inflation expectations rising when the Fed has supposedly won the inflation war?
Please see below:
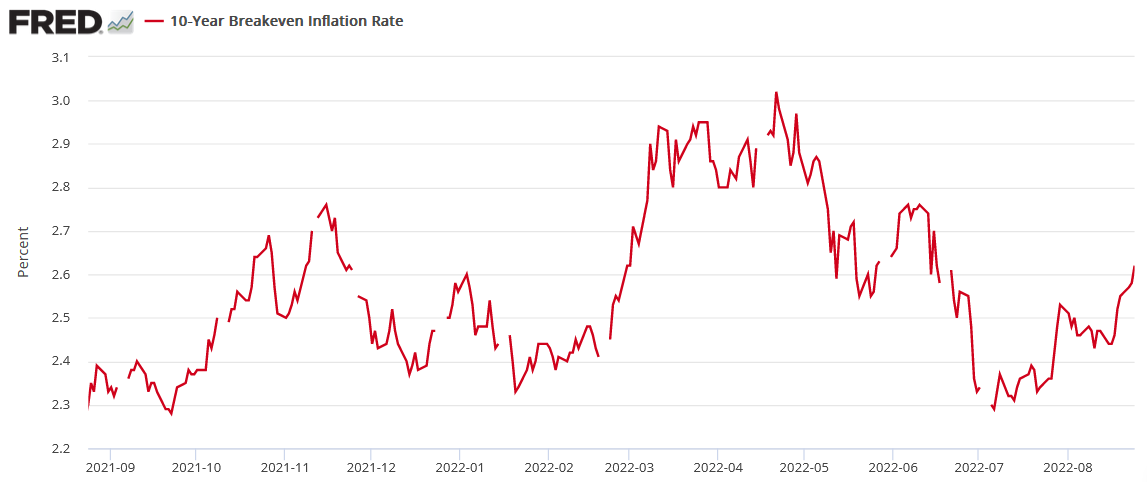
To that point, the GDXJ ETF often tracks the movement of the U.S. 10-Year breakeven inflation rate. Therefore, the latter’s bounce off the July lows has helped uplift the junior miners.
Please see below:
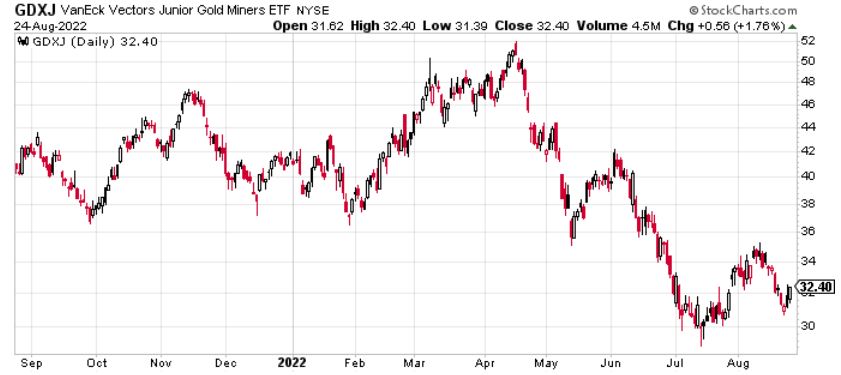
To explain, the peaks and valleys in the GDXJ ETF’s price over the last 12 months are quite comparable to the high-and-low points set by the U.S. 10-Year breakeven inflation rate. However, if you analyze the right side of both charts, you can see that the U.S. 10-Year breakeven inflation rate has surpassed its late July high, while the GDXJ ETF has not. As a result, the junior miners remain relative underperformers, despite the tailwind from investors’ contradictory expectations.
Furthermore, while the 10-year breakeven inflation rate has sought higher ground, so too has the U.S. 10-Year Treasury yield (closed at 3.11% on Aug. 24). Therefore, with the latter slightly outperforming the former, the U.S. 10-Year real yield remains positive and continues to rise.
Please see below:
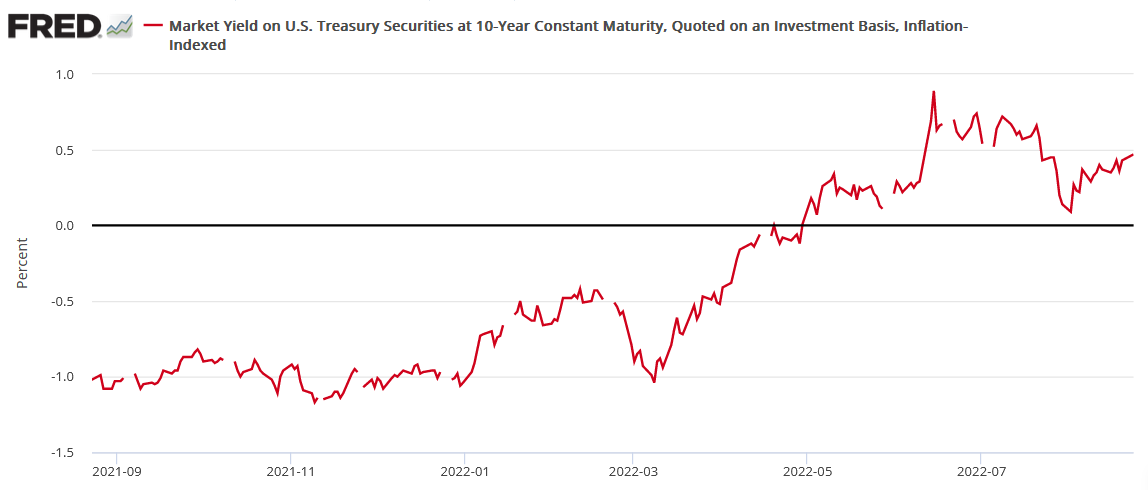
Thus, while I warned throughout 2021 that fighting inflation required a substantial increase in real yields, nothing has changed. In fact, while the S&P 500 remains relatively calm and the media opines that inflation is ‘old news,’ the bond market does not reflect this sentiment.
Think about it: quantitative tightening (QT) is set to double next week, and liquidating the Fed’s balance sheet should tighten financial conditions and help alleviate inflation (a quasi-rate hike). Moreover, if the Fed prioritizes moving long-term bonds, selling the U.S. 10-Year Treasury Note to front-run the action makes sense.
Conversely, the U.S. 10-Year breakeven inflation rate should not be rising if the consensus narrative is correct. With the Fed telegraphing further rate hikes and QT poised to enhance the tightening pressure, these tools should reduce investors’ inflation expectations, not enhance them. As such, the ‘Fed pivot’ narrative that helps uplift the S&P 500, gold, silver, and mining stocks is built on a faulty foundation.
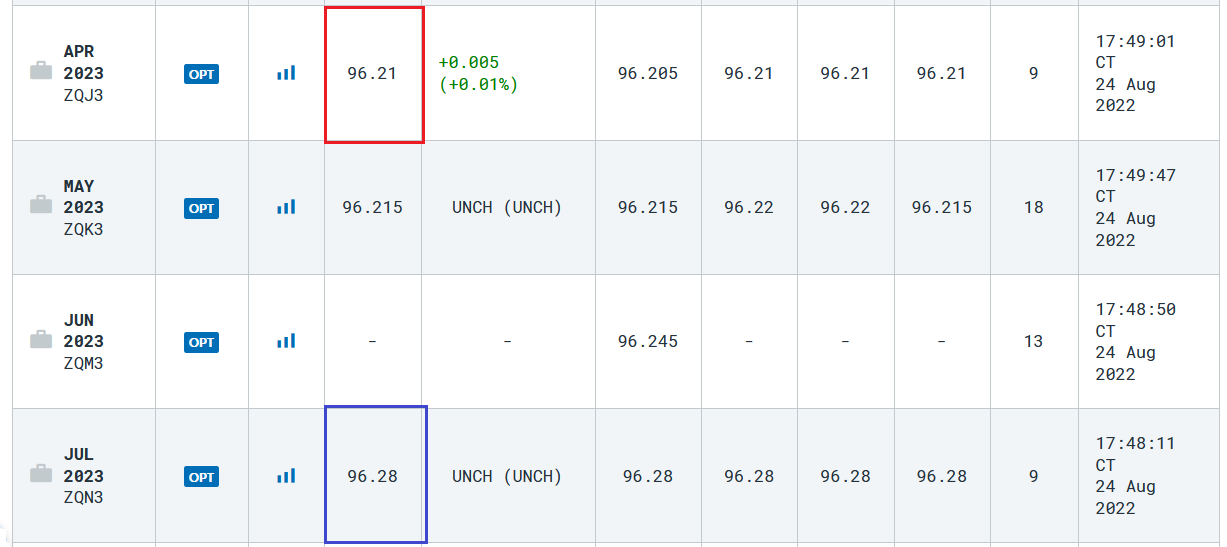
As further evidence, the interest rate futures market created the pivot narrative by pricing in rate cuts in 2023. However, while the interest rate futures market had priced in a 3.20% U.S. federal funds rate (FFR) during peak pivot expectations, that figure has ratcheted higher to 3.79%.
Please see below:
 Source: CME Group
To explain, the quotes above track the 30-day FFR futures for various monthly expirations. For context, the implied interest rate is calculated by subtracting the last settlement price from 100. Therefore, the red box above shows that market participants are pricing in a peak FFR of 3.79% in April 2023 (100-96.21). Moreover, the blue box above shows they’re still pricing in an immaterial rate cut in July 2023 (100-96.28 = 3.72%).
Thus, while a peak FFR of 3.79% is still well below the 4.5%+ we expect in 2023, the bond and futures markets have readjusted their expectations in a profoundly hawkish manner. Furthermore, the FX market also aligns.
Please see below:
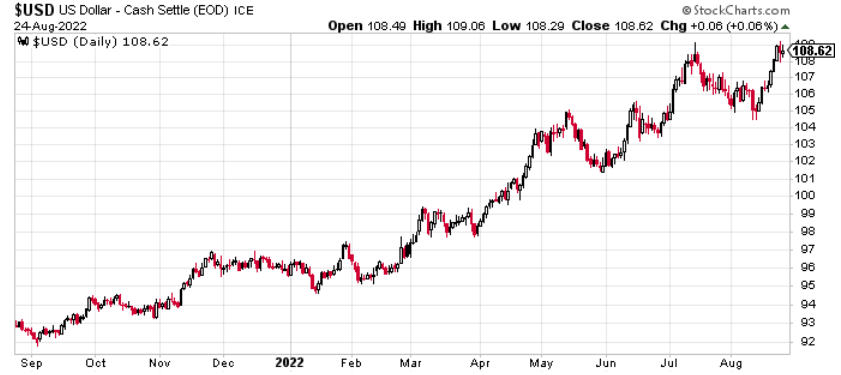
To explain, the USD Index has recouped nearly all of its July declines and is near a ~20-year high. As a result, all of the hawkish fundamental realities that upended the S&P 500 and the PMs throughout 2022 have resurfaced, while only the narrative has changed.
Therefore, the important point is that many markets have re-priced to reflect the difficulty of normalizing unanchored inflation. However, the PMs and the S&P 500 have not. As such, with the bulls’ expectations contrasting history and the positioning in the bond, futures, and FX markets, gold, silver, mining stocks, and the S&P 500 should suffer mightily when the light bulb goes off.
A Round Trip
While I warned throughout 2021 that inflation would force the Fed’s hand and result in several interest rate hikes, the consensus’ faith in the central bank is as misguided now as it was then. For example, please see this Reuters headline from June 2021:
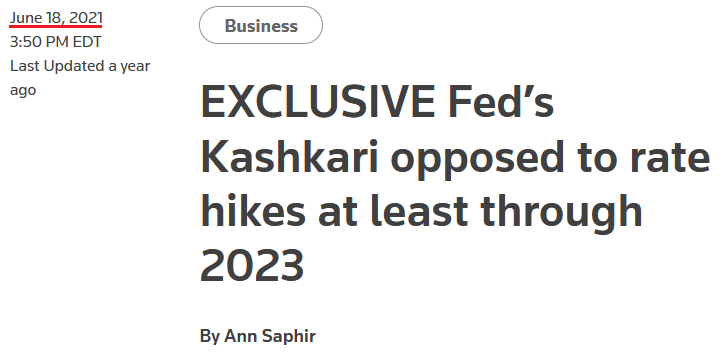
Minneapolis Fed President Neel Kashkari said at the time:
"I still have no hikes in the SEP forecast horizon because I think it’s going to take time for us really to really achieve maximum employment, and I do believe that these higher inflation readings are going to be transitory."
Thus, while the bulls were keen to follow Kashkari’s guidance (don’t fight the Fed), we’ve had nine 25 basis point rate hikes in 2022, another 50 to 75 basis points should commence in September and QT is set to double.
Furthermore, with the most dovish Fed member in 2021 now one of the most hawkish, it’s amazing the difference ~14 months makes.
Please see below:
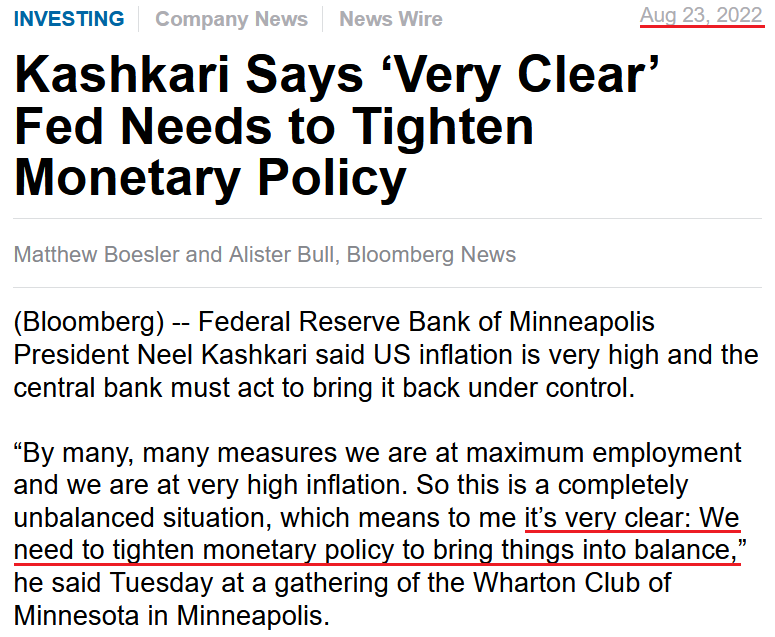 Source: Bloomberg
He added:
“When inflation is 8% or 9%, we run the risk of unanchoring inflation expectations and leading to very bad outcomes that would cause us to have to be very aggressive – Volcker-esque – to then re-anchor them. We definitely want to avoid allowing that situation to develop. So with inflation this high, for me, I’m in the mode of we need to err on making sure we’re getting inflation down, and only relax when we see compelling evidence that inflation is well on its way back down to 2%.”
Thus, while Kashkari has finally seen the light, not all FOMC member shares his view, and the S&P 500 and the PM bulls certainly don’t. In a nutshell: they continue to position for a dovish pivot because Fed Chairman Jerome Powell labels inflation as troubling but easily solvable.
However, history suggests otherwise. Remember, Powell is trying to reduce 9%+ peak (for now) inflation with a ~3.5% FFR. If successful, he will accomplish what no other Fed Chairman has before him.
Therefore, do you think that prior committees wanted to take the FFR above or within ~50 basis points of the year-over-year (YoY) CPI? Of course not. If they could have alleviated inflation without inflicting economic hardship, they would have done so. Thus, I warned on Aug. 12 that investors are ignoring history at their own peril. I wrote:
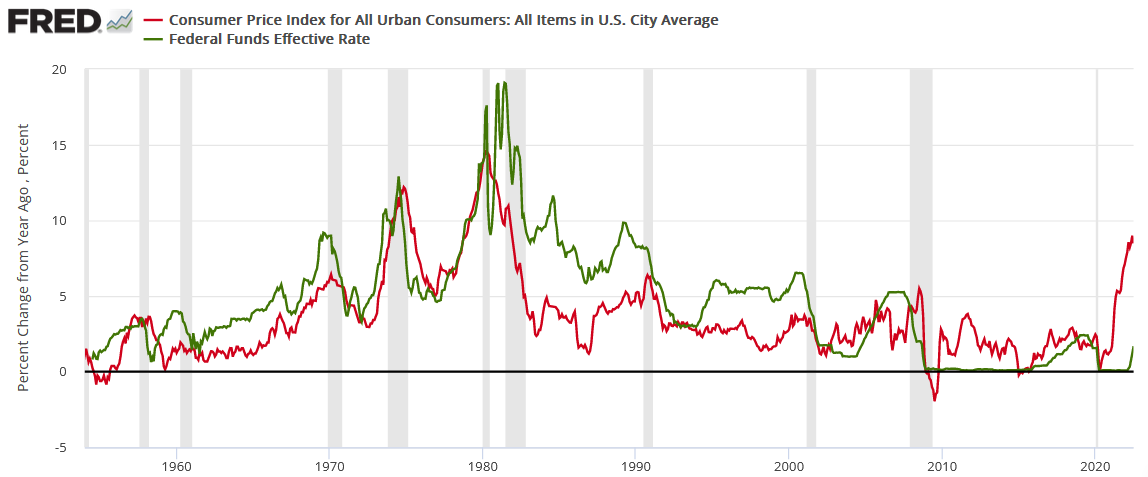
The FFR has either eclipsed the YoY headline CPI or come within ~50 basis points of its peak in every inflation fight since 1954. Therefore, please see the unprecedented gap on the right side of the chart. With the YoY headline CPI peaking (for now) at 9.1% and the FFR at 2.5% (the high end of the Fed's 2.25% to 2.5% range), the difference is 6.6%.
As a result, history implies the FFR needs to hit at least 8.6% (which marks ~50 basis points below the current CPI peak). Moreover, while we don't expect the FFR to hit this level, the purpose is to show just how laughable a 3.5% FFR and 9%+ inflation is from a historical perspective. In reality, a 4.5%+ FFR is much more realistic, and the prospect is far from priced in.
In addition, notice how every inflation spike leads to a higher FFR and then a recession (the gray bars)? As such, do you really think this time is different?
The Bottom Line
From a fundamental perspective, investment returns are driven by the difference between what’s priced in and what actually occurs; and with investors pricing in extremely unrealistic outcomes, the Fed will re-write history if it pulls off a soft landing. Moreover, while the S&P 500 and the PMs behave as if a Goldilocks outcome is inevitable (the stock market is only pricing in a 20% chance of a recession), the futures, bond and FX markets have much less faith. As a result, narratives are all the bulls have on their side at this point.
In conclusion, the PMs were mixed on Aug. 24, as silver ended the day in the red. Moreover, while the financial markets have largely gone quiet as investors await Powell’s Jackson Hole speech, nothing he says will change the troubling fundamental realities that confront financial assets in the months ahead. Therefore, we expect the GDXJ ETF to hit lower lows over the medium term, regardless of whether Powell sparks a short-term rally in the days ahead.
Overview of the Upcoming Part of the Decline
- It seems to me that the corrective upswing is either over or about to be over, and that the next big move lower is about to start.
- If we see a situation where miners slide in a meaningful and volatile way while silver doesn’t (it just declines moderately), I plan to – once again – switch from short positions in miners to short positions in silver. At this time, it’s too early to say at what price levels this could take place and if we get this kind of opportunity at all – perhaps with gold prices close to $1,600.
- I plan to exit all remaining short positions once gold shows substantial strength relative to the USD Index while the latter is still rallying. This may be the case with gold prices close to $1,400. I expect silver to fall the hardest in the final part of the move. This moment (when gold performs very strongly against the rallying USD and miners are strong relative to gold after its substantial decline) is likely to be the best entry point for long-term investments, in my view. This can also happen with gold close to $1,400, but at the moment it’s too early to say with certainty.
- The above is based on the information available today, and it might change in the following days/weeks.
You will find my general overview of the outlook for gold on the chart below:
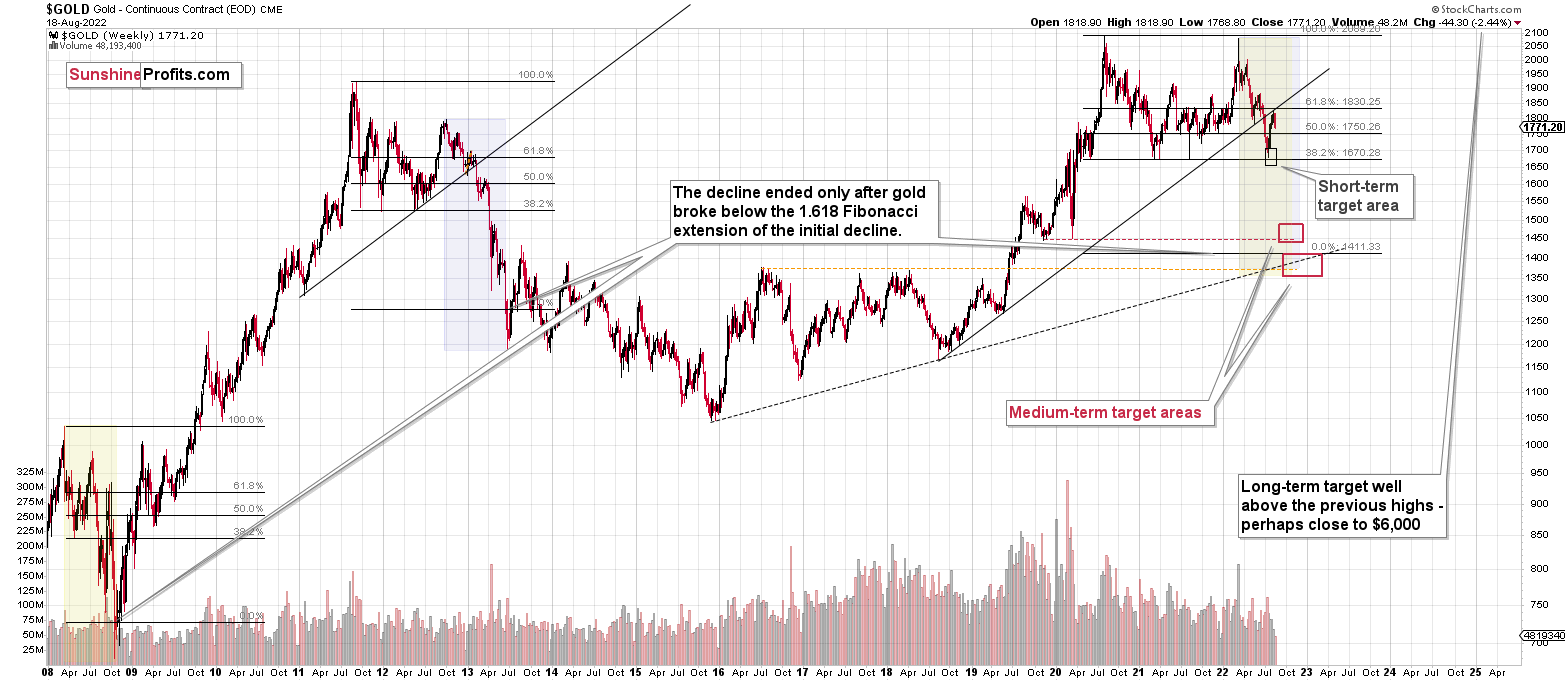
Please note that the above timing details are relatively broad and “for general overview only” – so that you know more or less what I think and how volatile I think the moves are likely to be – on an approximate basis. These time targets are not binding nor clear enough for me to think that they should be used for purchasing options, warrants, or similar instruments.
Summary
Summing up, it seems that the corrective upswing is over (or close to being over), which means that the powerful medium-term downtrend can now resume.
Two weeks ago, we closed yet another profitable trade in a row. This year’s profits are already enormous, but it seems likely to me that they will grow even more in the following weeks and months. In particular, I expect the profits on the current short positions to be really profound.
After the final sell-off (that takes gold to about $1,350-$1,500), I expect the precious metals to rally significantly. The final part of the decline might take as little as 1-5 weeks, so it's important to stay alert to any changes.
As always, we'll keep you – our subscribers – informed.
To summarize:
Trading capital (supplementary part of the portfolio; our opinion): Full speculative short positions (300% of the full position) in junior mining stocks are justified from the risk to reward point of view with the following binding exit profit-take price levels:
Mining stocks (price levels for the GDXJ ETF): binding profit-take exit price: $20.32; stop-loss: none (the volatility is too big to justify a stop-loss order in case of this particular trade)
Alternatively, if one seeks leverage, we’re providing the binding profit-take levels for the JDST (2x leveraged). The binding profit-take level for the JDST: $29.87; stop-loss for the JDST: none (the volatility is too big to justify a SL order in case of this particular trade).
For-your-information targets (our opinion; we continue to think that mining stocks are the preferred way of taking advantage of the upcoming price move, but if for whatever reason one wants / has to use silver or gold for this trade, we are providing the details anyway.):
Silver futures downside profit-take exit price: $12.32
SLV profit-take exit price: $11.32
ZSL profit-take exit price: $79.87
Gold futures downside profit-take exit price: $1,504
HGD.TO – alternative (Canadian) 2x inverse leveraged gold stocks ETF – the upside profit-take exit price: $19.87
HZD.TO – alternative (Canadian) 2x inverse leveraged silver ETF – the upside profit-take exit price: $49.87
Long-term capital (core part of the portfolio; our opinion): No positions (in other words: cash)
Insurance capital (core part of the portfolio; our opinion): Full position
Whether you’ve already subscribed or not, we encourage you to find out how to make the most of our alerts and read our replies to the most common alert-and-gold-trading-related-questions.
Please note that we describe the situation for the day that the alert is posted in the trading section. In other words, if we are writing about a speculative position, it means that it is up-to-date on the day it was posted. We are also featuring the initial target prices to decide whether keeping a position on a given day is in tune with your approach (some moves are too small for medium-term traders, and some might appear too big for day-traders).
Additionally, you might want to read why our stop-loss orders are usually relatively far from the current price.
Please note that a full position doesn't mean using all of the capital for a given trade. You will find details on our thoughts on gold portfolio structuring in the Key Insights section on our website.
As a reminder - "initial target price" means exactly that - an "initial" one. It's not a price level at which we suggest closing positions. If this becomes the case (as it did in the previous trade), we will refer to these levels as levels of exit orders (exactly as we've done previously). Stop-loss levels, however, are naturally not "initial", but something that, in our opinion, might be entered as an order.
Since it is impossible to synchronize target prices and stop-loss levels for all the ETFs and ETNs with the main markets that we provide these levels for (gold, silver and mining stocks - the GDX ETF), the stop-loss levels and target prices for other ETNs and ETF (among other: UGL, GLL, AGQ, ZSL, NUGT, DUST, JNUG, JDST) are provided as supplementary, and not as "final". This means that if a stop-loss or a target level is reached for any of the "additional instruments" (GLL for instance), but not for the "main instrument" (gold in this case), we will view positions in both gold and GLL as still open and the stop-loss for GLL would have to be moved lower. On the other hand, if gold moves to a stop-loss level but GLL doesn't, then we will view both positions (in gold and GLL) as closed. In other words, since it's not possible to be 100% certain that each related instrument moves to a given level when the underlying instrument does, we can't provide levels that would be binding. The levels that we do provide are our best estimate of the levels that will correspond to the levels in the underlying assets, but it will be the underlying assets that one will need to focus on regarding the signs pointing to closing a given position or keeping it open. We might adjust the levels in the "additional instruments" without adjusting the levels in the "main instruments", which will simply mean that we have improved our estimation of these levels, not that we changed our outlook on the markets. We are already working on a tool that would update these levels daily for the most popular ETFs, ETNs and individual mining stocks.
Our preferred ways to invest in and to trade gold along with the reasoning can be found in the how to buy gold section. Furthermore, our preferred ETFs and ETNs can be found in our Gold & Silver ETF Ranking.
As a reminder, Gold & Silver Trading Alerts are posted before or on each trading day (we usually post them before the opening bell, but we don't promise doing that each day). If there's anything urgent, we will send you an additional small alert before posting the main one.
Thank you.
Przemyslaw Radomski, CFA
Founder, Editor-in-chief

