

Briefly: in our opinion, full (200% of the regular position size) speculative long positions in junior mining stocks are justified from the risk/reward point of view at the moment of publishing this Alert.
Overall, the precious metals sector didn’t do much last week. Gold was up by 1.4%, silver was up by 0.12%, GDX was down by 0.7%, and the GDXJ was up by 2.46%.
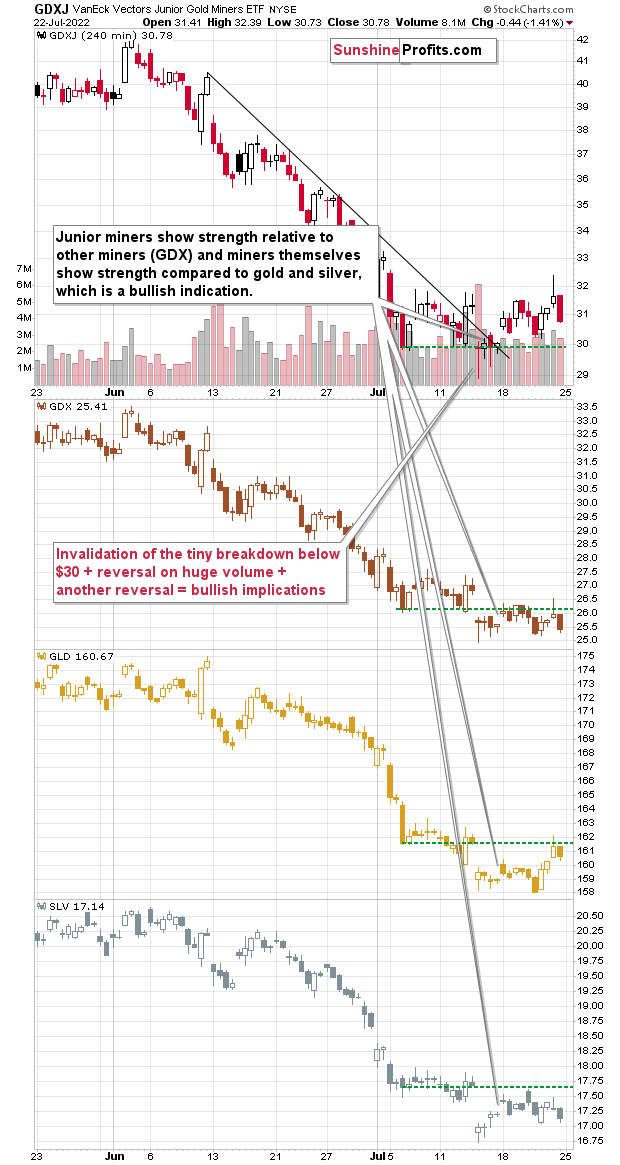
Junior miners are the bullish exception that reacts to gold’s recent strength. Seniors and silver are not really participating in the rebound – at least not yet. As a reminder, the above is not necessarily a sign that junior gold and silver miners are particularly strong – it’s likely the case that they have simply fallen the most recently, and therefore their rebound is the strongest.
As you may recall, silver tends to outperform gold close to the end of a given rally, and we haven’t seen this phenomenon this time, except for the last rally that ended on July 18. However, that was too early in the rally to really call this type of performance something close to the end of the rally – it was too close to its beginning.
Consequently, it could be the case that we’re going to see more strength in the precious metals market before the big move lower continues.
What we saw in the general stock market confirms this scenario.
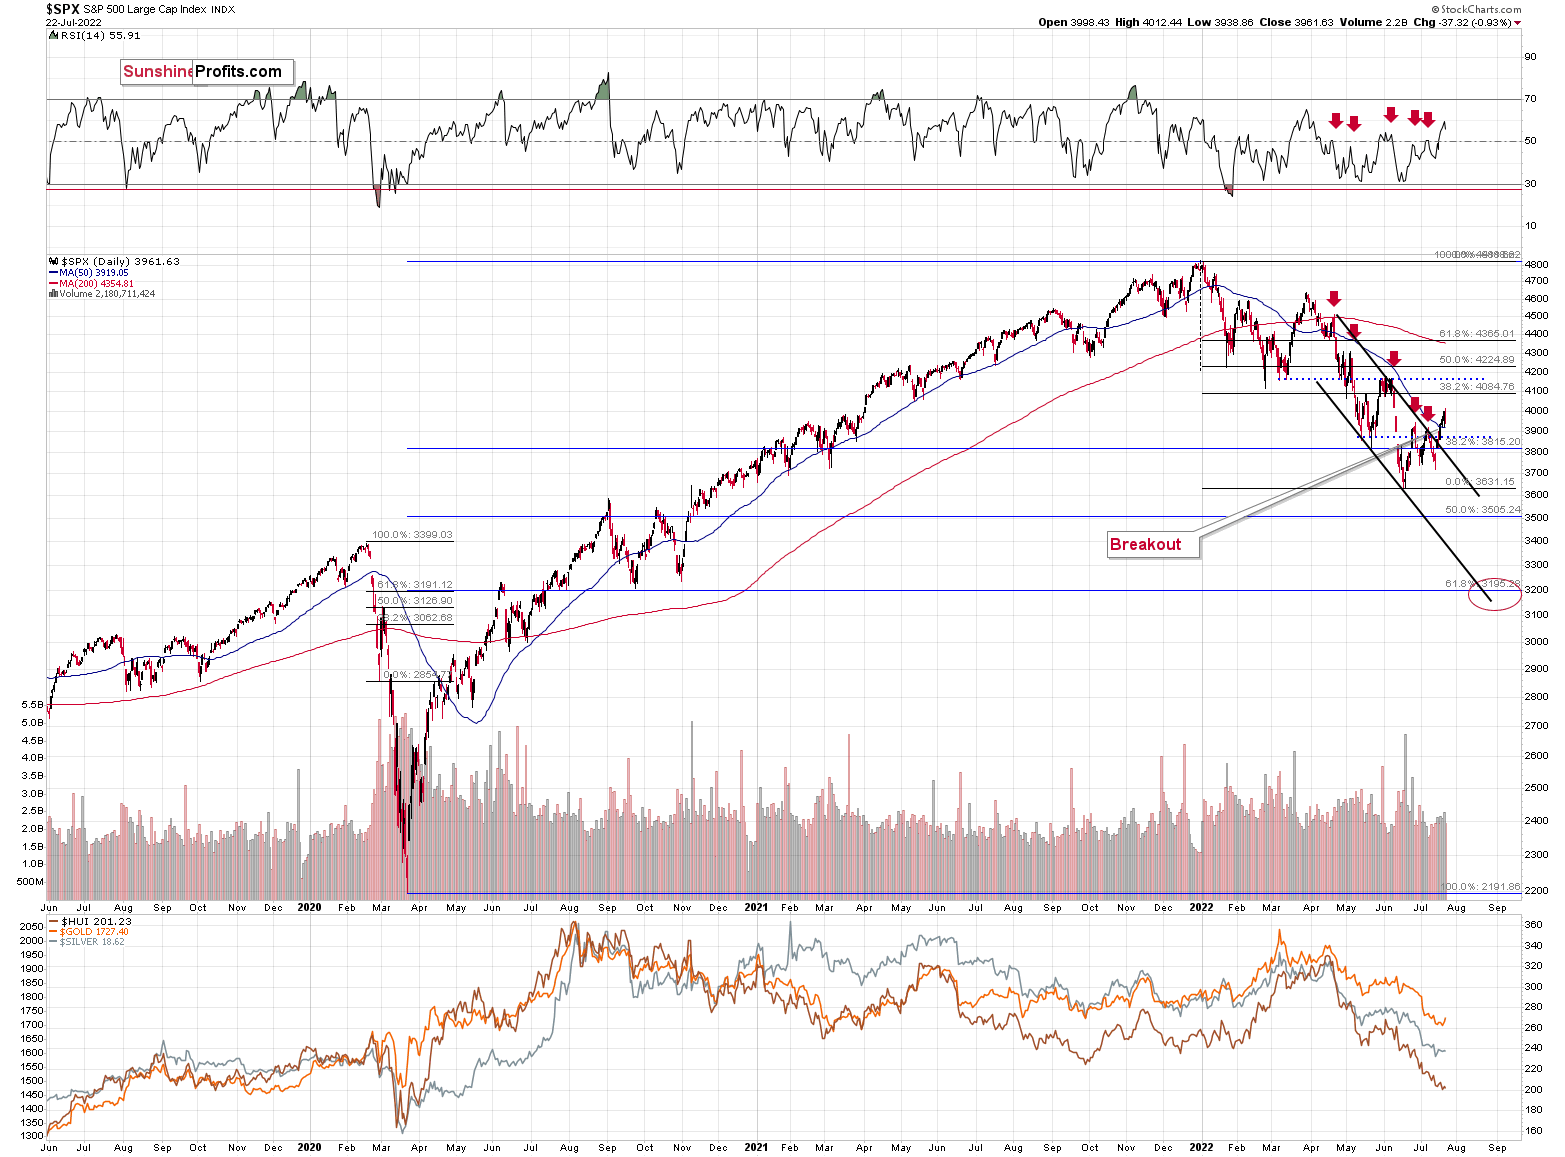
Stocks declined somewhat on Friday, but overall, they ended last week visibly above their declining short-term trend channel and above their 50-day moving average. That’s simply a bullish combination for the short run.
This tells us that silver and mining stocks (and especially junior mining stocks) are likely to move higher unless gold truly plunges.
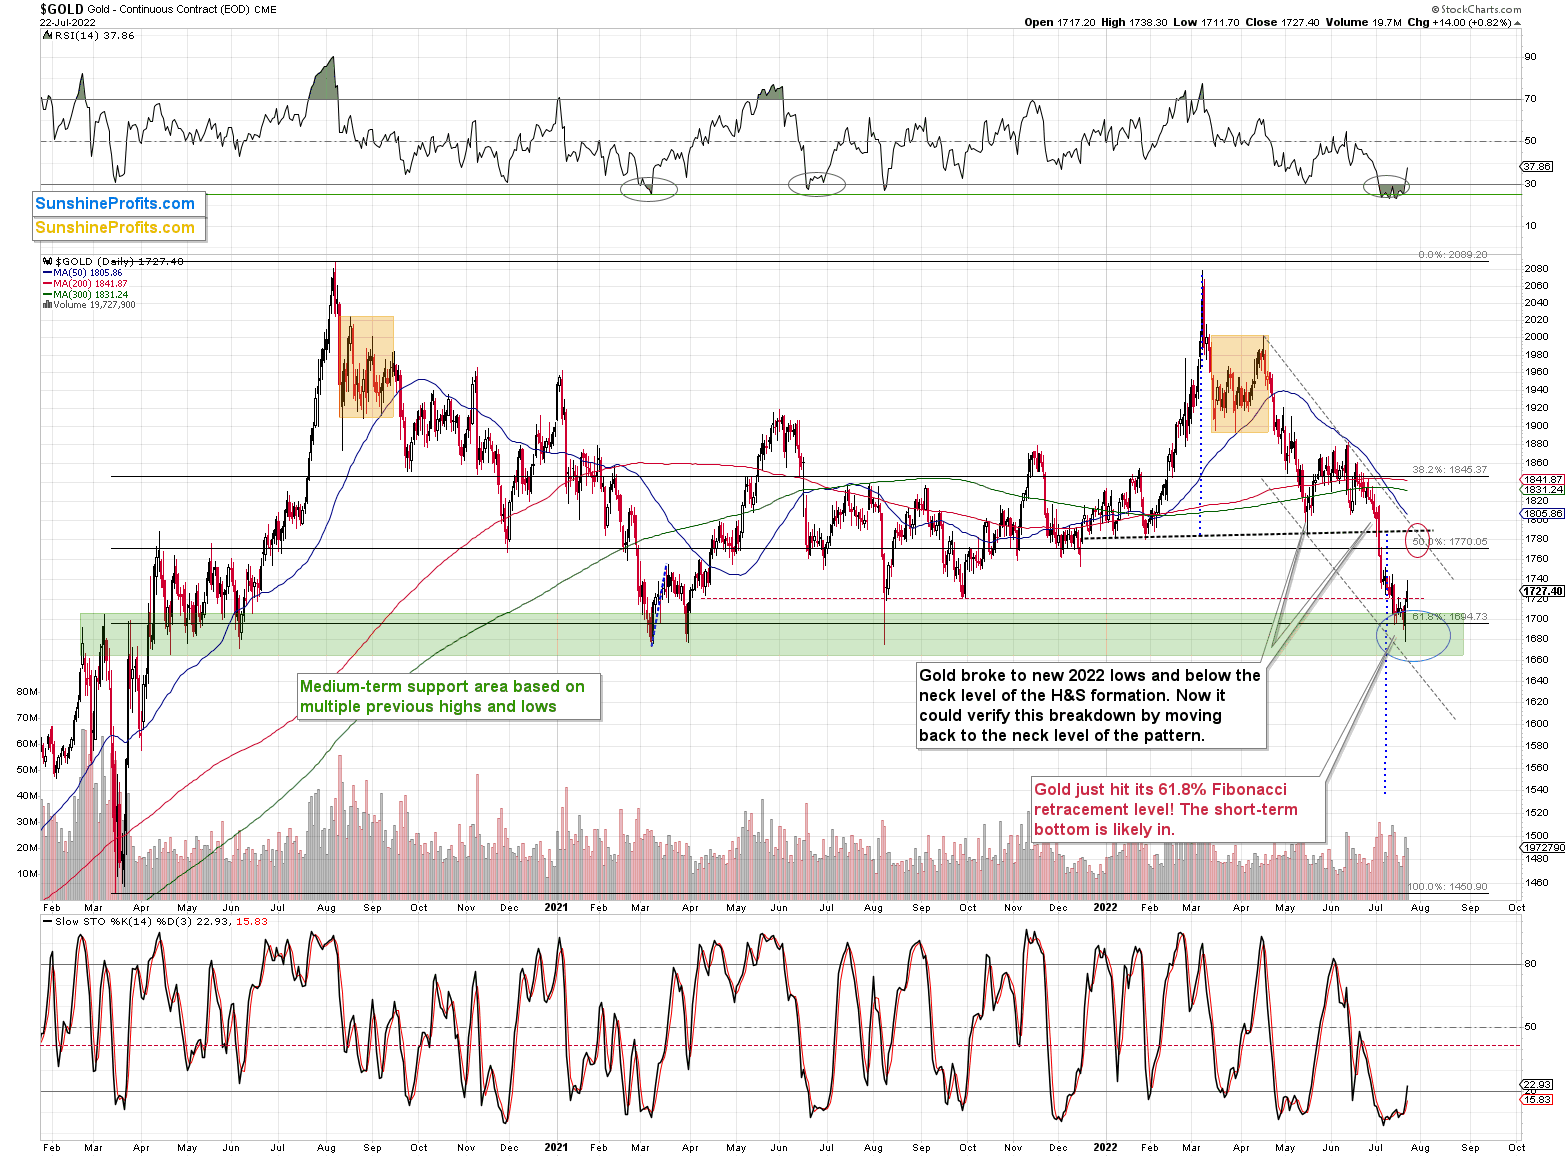
Gold is likely to move higher in the short term, not plunge. The reason is that it just invalidated the breakdown below its mid-2021 lows and the 61.8% Fibonacci retracement level based on the entire 2020 rally. The yellow metal did so after bottoming right in the middle of my target area, close to its previous lows.
Besides, in all recent cases when gold rallied after its RSI was below or very close to the 30 level, it then rallied at least until the RSI was close to 50. That’s not the case yet, so it doesn’t seem that gold is done rallying yet.
All in all, gold is likely to move higher within the next several days, and the same goes for the general stock market. Both are likely to contribute to higher prices in junior mining stocks. The latter are likely to rally, top, and then start another very powerful move lower. For now, however, the short-term outlook remains bullish.
Having said that, let’s take a look at the markets from a more fundamental angle.
Rough Seas, but We Stay the Course
With Snap Inc. tanking on Jul. 22 following poor Q2 earnings after hours the day before, the negativity helped bring down other risk assets. Moreover, with the bulk of S&P 500 companies reporting earnings this week, the FOMC poised to raise interest rates by 0.75% on Jul. 27, and the Q2 GDP print released on Jul. 28, large gyrations could confront the financial markets.
However, with the PMs relatively oversold and rampant outflows from gold-backed ETFs likely to reverse, we remain long the GDXJ ETF in the days ahead. To explain, I wrote on Jul. 21:
I’ve noted how oversold conditions support a short-term rally for the GDXJ ETF. Moreover, with fund flows emphasizing the technical conclusions, it’s important to remember that too much bearishness is often bullish.
Please see below:
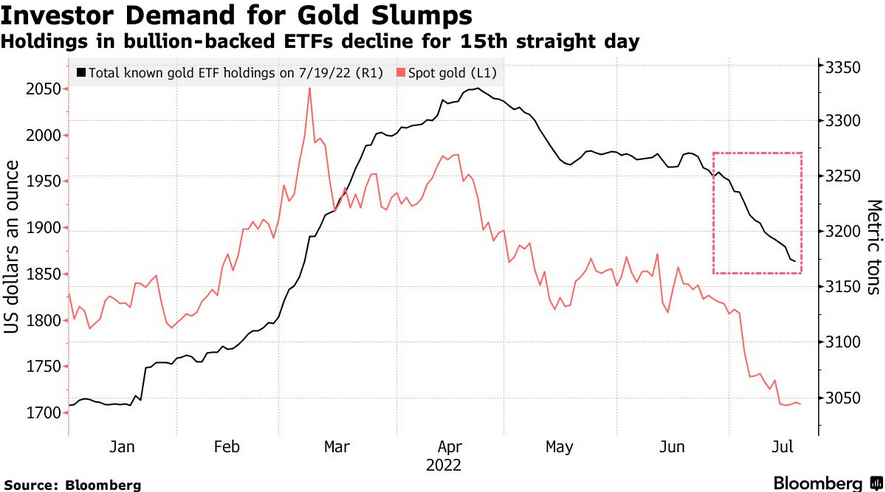
To explain, the red line above tracks the spot gold price, while the black line above tracks gold-backed ETF holdings as of Jul. 19. If you analyze the right side of the chart, you can see that gold-backed ETFs have suffered 15 straight days of outflows. Moreover, with the PMs declining on Jul. 20, the tally is likely at 16 days.
Furthermore, Suki Cooper, a precious metals analyst at Standard Chartered Plc, said: “There’s actually scope for a relief rally coming up to the July FOMC meeting where we can see a little bit of a bounce and perhaps prices heading back toward $1,750 in the near term.”
As such, with gold a winner on Jul. 22 and already halfway to $1,750, the GDXJ ETF should play catch up.
Calling Inflation
While the GDXJ ETF’s short-term outlook is promising, its medium-term outlook is fraught with peril. For example, I’ve sounded the inflation alarm since 2021 and added how the consensus still underestimates how far the Fed has to go to curb the pricing pressures.
Furthermore, I noted on Jul. 22 that earnings calls from Blackstone, Hasbro and Tractor Supply highlight how inflation is entrenched in the U.S. economy. In addition, with more earnings calls showcasing how the situation continues to worsen, market participants don’t realize that the U.S. federal funds rate needs to hit ~4.5% or more for the Fed to materially reduce inflation. For context, the consensus expects a figure in the 2.5% to 3.5% range.
Supporting the claim, PepsiCo released its second-quarter earnings on Jul. 12. For context, it’s the largest food & beverage company in the U.S. CFO Hugh Johnston said during the Q2 earnings call:
“Balance of the year inflation is higher than it is for the first half of the year. I think we've mentioned in the past, we're in the teens in terms of commodity inflation. That will continue, but a little bit higher in the back half. But we do expect stronger productivity in the back half as well.”
Furthermore, CEO Ramon Laguarta commented on the company’s Q2 net revenue composition. He said:
“A bit less volume, a bit more price, second quarter versus first quarter. But overall, sales has remained stable, high single digit, a bit of a difference between beverages and snacks. Snacks a bit higher than beverages, but stable. And that has continued into the last few weeks. So we don't see any meaningful consumer behavioral change as gas prices go up.”
However, “a bit less volume, a bit more price” materially understates the ferocity of PepsiCo’s price increases.
Please see below:
 Source: PepsiCo
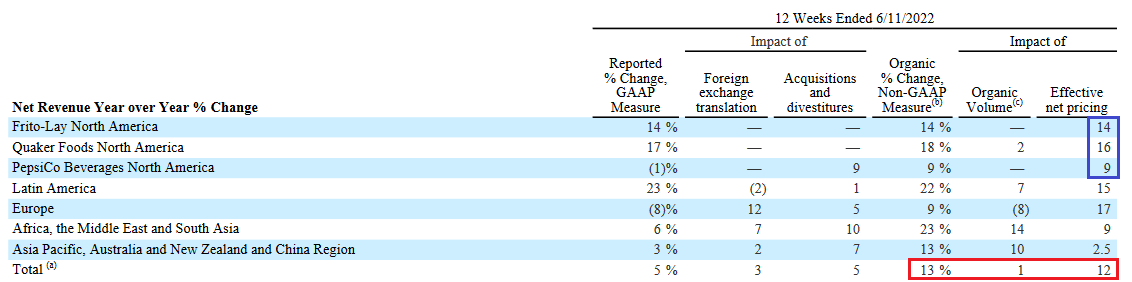
To explain, the table above breaks down the components that contributed to PepsiCo’s YoY percentage net revenue growth. If you analyze the 13% figure in the red box, you can see that consolidated organic net revenue – which excludes the impact of acquisitions, divestitures, and currency fluctuations – was in the teens. However, organic volume only increased by 1%. As a result, organic net revenue growth was driven by a 12% YoY increase in prices.
Furthermore, the blue box shows that Frito-Lay, Quaker, and PepsiCo beverage products in North America realized YoY price increases of 14%, 16% and 9%, respectively. Therefore, does it seem like we’re close to the Fed’s 2% target?
Second, Union Pacific released its second-quarter earnings on Jul. 21. For context, it’s the second-largest railroad shipping company in the U.S. EVP Kenny Rocker said during the Q2 earnings call:
“Starting with bulk, revenue for the quarter was up 10% compared to last year, driven by a 12% increase in average revenue per car, reflecting higher fuel surcharges and solid core pricing gains. Volume was down 1% YoY (...).”
“Moving on, Industrial. Industrial revenue was up 12% for the quarter, driven by 6% increase in volume and a 7% improvement in average revenue per car due to higher fuel surcharges and core pricing gains (…).”
“Turning to Premium, revenue for the quarter was up 19% on a 5% decrease in volume versus last year. Average revenue per car increased by 26% due to higher fuel surcharge revenue, core pricing gains and a positive mix of traffic.”
As a result, Union Pacific is pricing well ahead of the headline Consumer Price Index (CPI).
Please see below:
 Source: Union Pacific
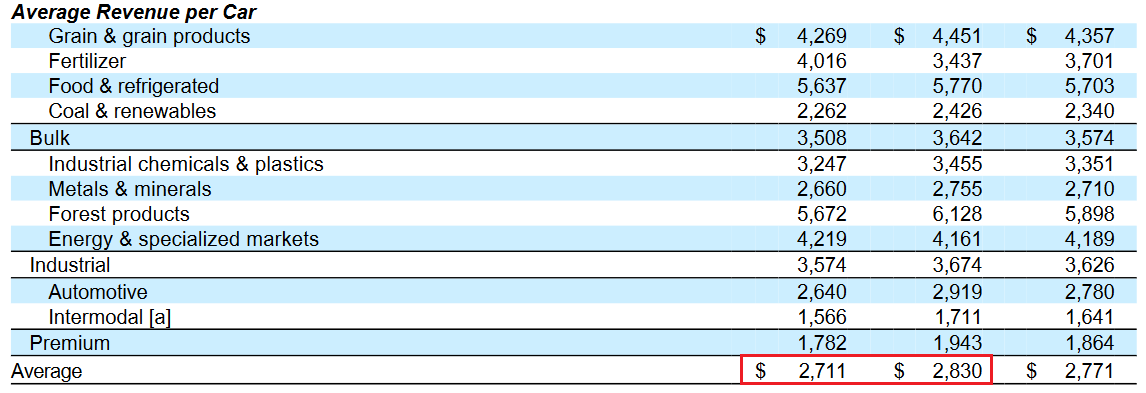
To explain, the data above is from Union Pacific’s Q2 earnings release. I noted above how YoY volume across the company’s three segments was -1%, 6%, and -5%. Therefore, consolidated shipping volume was essentially flat in Q2.
However, if you analyze the red rectangle above, you can see that the company’s average revenue per car increased from $2.71 billion in Q1 to $2.83 billion in Q2. As such, flat volume means the 4.4% quarter-over-quarter (QoQ) increase was driven by price increases. Moreover, a 4.4% QoQ rise annualizes to 18.8%.
Furthermore, with CFO Jennifer Hamann noting that “the demand environment continues to support actions that yield price dollars exceeding inflation dollars,” the consensus vastly underestimates how difficult the Fed’s job has become.
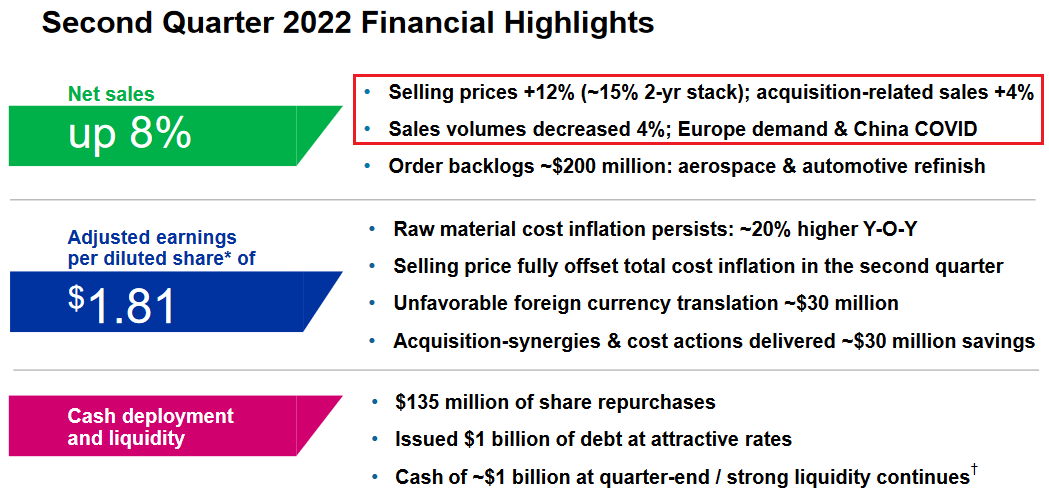
Third, PPG Industries – the second-largest paint manufacturer in the U.S. – released its second-quarter earnings on Jul. 21. CEO Michael McGarry said during the Q2 earnings call:
“Our earnings performance was aided by higher selling prices of about 12% YoY, marking the 21st consecutive quarter of higher selling prices. Our selling prices are now up over 15% on a two-year stacked basis, reflecting our continued actions to offset persistent cost inflation. We anticipate by the end of 2022, we will fully offset all cumulative total inflation from 2021 and 2022.”
Moreover, CFO Vince Morales said:
“We expect higher pricing on a percentage basis and certainly on a two-year stack for Q3. With respect to the inflation, I think your numbers are directionally correct in terms of the inflation we've absorbed over the past, call it, 18 and soon to be 24 months.
“We anticipate offsetting that fully with price. But not just that, as Michael mentioned in the opening remarks, we're offsetting logistics. We're offsetting employee-related inflation so in packaging inflation. So, again, our pricing will overcome that by the end of the year.”
Thus, it’s a similar story. With PPG Industries’ Q2 volume down by 4% and its net sales up by 8%, the company also prices its products (12%) well ahead of the headline CPI.
Please see below:
 Source: PPG Industries
On top of that, as Morales mentioned, more price increases are scheduled to commence.
Please see below:
 Source: PPG Industries
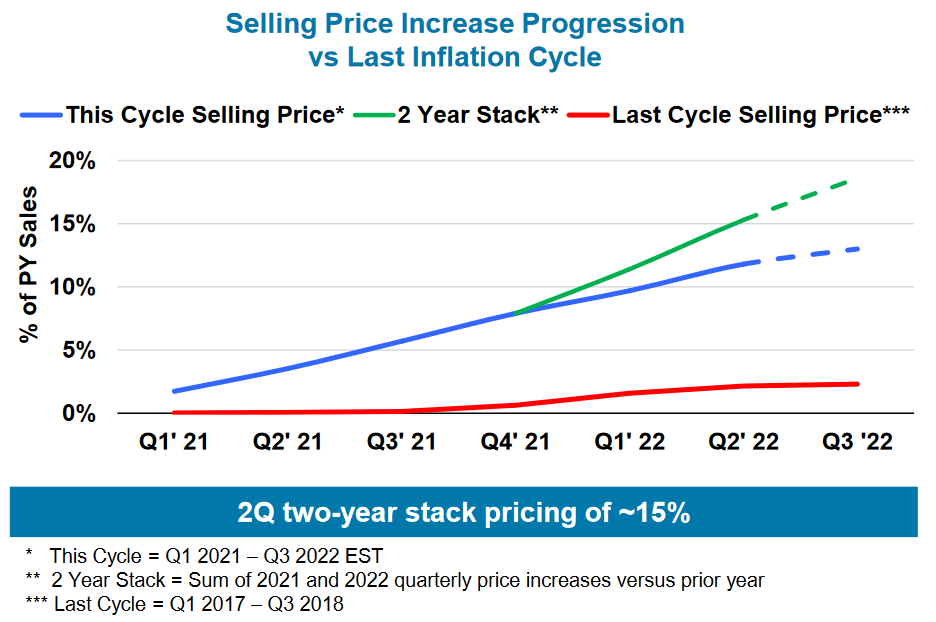
To explain, the red line above tracks the increases during PPG Industries' last pricing cycle (Q1 2017 to Q3 2018), while the blue line above tracks the current cycle. If you analyze the dashed portions on the right, you can see that the company projects even higher prices in the months ahead. As such, investors are kidding themselves if they think a ~3% U.S. federal funds rate will solve all of these issues.
Also noteworthy, American Express released its second-quarter earnings on Jul. 22. For context, it's the second-largest credit card company in the U.S. Moreover, while I've noted for some time that investors underestimated the amount of demand that’s driving inflation, CEO Steve Squeri said during the Q2 earnings call:
“We continue to see no significant signs of stress in our consumer base (…). You look at 8% or 9% sort of spending inflation out there in the environment, it's not an 8% or 9% benefit to our business because you do have a grow over. The most important thing for us is we're seeing an increase in transactions.”
Therefore:
“The combination of all of these things led us to increase our expectations for full-year revenue growth to 23% to 25%, up from our original range of 18% to 20%. For now, though, our EPS guidance remains unchanged, from between $9.25 and $9.65.”
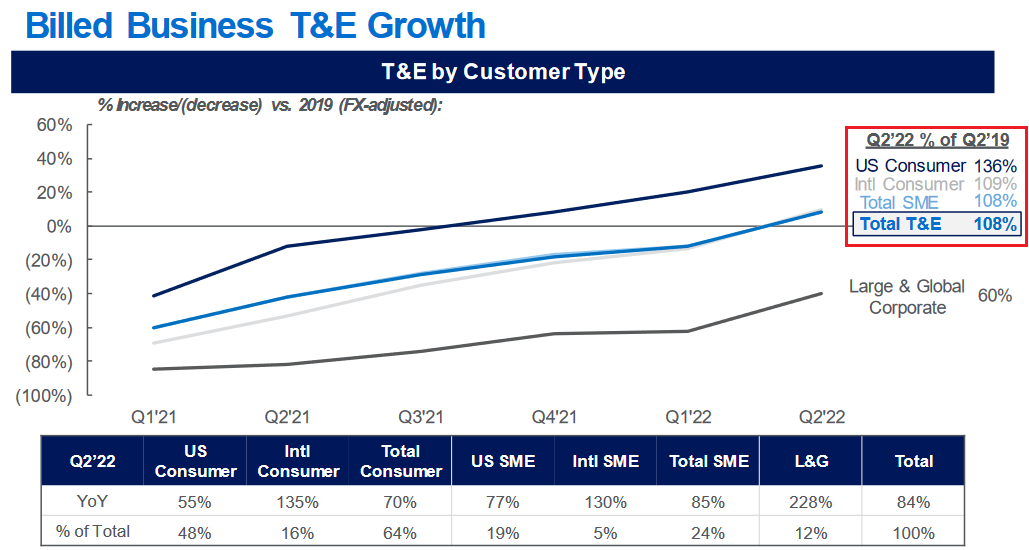
Thus, with American Express enjoying revenue growth well in excess of inflation and upping its guidance, consumer spending is outperforming. Moreover, citing “huge pent-up demand,” Squeri added that “we don't see demand in the T&E [travel & entertainment] categories declining significantly anytime soon, based on the strength of future bookings coming through our consumer travel agency.”
Please see below:
 Source: American Express
To explain, the dark blue line at the top shows that U.S. consumer T&E spending hit a new 2022 high in Q2 and is now 36% above Q2 2019. As such, higher prices have not deterred Americans from spending money.
The PMI Story
With S&P Global releasing its U.S. Composite PMI on Jul. 22, the inflation results support the data above. For context, the headline index declined from 52.3 in June to 47.5 in July, marking a “solid contraction in private sector output.” As a result, while the U.S. economic outlook weakens, unanchored inflation highlights the Fed’s catch-22. The report revealed:
“Challenges retaining employees and some reports of cost-cutting initiatives led to the weakest rise in staffing numbers since February. Job creation was led by service sector firms, which continued to register a strong upturn in employment. Manufacturers, on the other hand, recorded only a slight rise in workforce numbers.”
Therefore, while the picture is far from perfect, “slight” to “strong” increases in employment are bullish for Fed policy, given where we are in the inflation cycle. To that point:
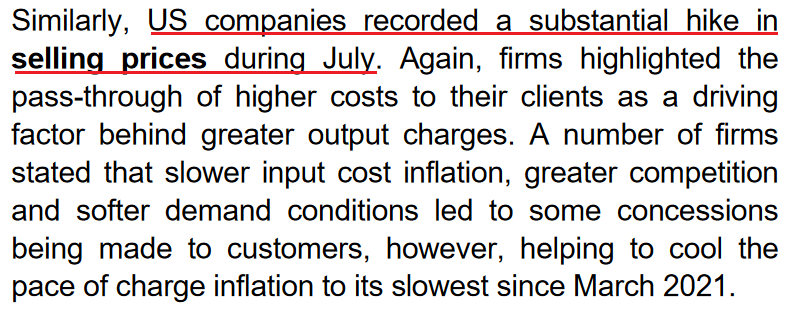
“Firms continued to highlight marked upticks in input costs at suppliers, as fuel, transportation, raw material and wage expenses rose further. However, the pace of input price inflation eased again from May’s series peak and was the softest for six months, despite being faster than in any period seen before May 2021.”
As a result:
 Source: S&P Global
Thus, while the pace of inflation has cooled somewhat in recent months, that should be expected after six rate hikes (25 basis point increments). However, the important point is that inflation is still increasing month-over-month (MoM), and therefore, is still running away from the Fed. Moreover, with U.S. job creation showcasing a similar trend (slowing but still increasing MoM), we’re far from the demand destruction necessary to curb inflation.
The Bottom Line
While we could be in for a rocky week, the PMs may rally even if volatility strikes the general stock market. Moreover, with many companies that have reported earnings passing on higher costs with little pushback, more resilient prints could provide fundamental fuel for further optimism. As a result, while the medium-term outlook continues to worsen, we remain buyers in the short term.
In conclusion, the PMs were mixed on Jul. 22, as negativity across the general stock market helped suppress silver and mining stocks. However, the USD Index, the U.S. 10-Year real yield and high yield credit spreads have all declined in recent days, and the developments are short-term bullish as financial conditions have loosened. However, with the Fed needing to tighten financial conditions to curb inflation, a painful uprising of all three should occur in the months ahead.
Overview of the Upcoming Part of the Decline
- It seems to me that we’re going to see a corrective upswing here (probably ending in the final week of July) that will then be followed by a very big decline in the precious metals sector.
- If we see a situation where miners slide in a meaningful and volatile way while silver doesn’t (it just declines moderately), I plan to – once again – switch from short positions in miners to short positions in silver. At this time, it’s too early to say at what price levels this could take place and if we get this kind of opportunity at all – perhaps with gold prices close to $1,600.
- I plan to exit all remaining short positions once gold shows substantial strength relative to the USD Index while the latter is still rallying. This may be the case with gold close to $1,400. I expect silver to fall the hardest in the final part of the move. This moment (when gold performs very strongly against the rallying USD and miners are strong relative to gold after its substantial decline) is likely to be the best entry point for long-term investments, in my view. This can also happen with gold close to $1,400, but at the moment it’s too early to say with certainty.
- The above is based on the information available today, and it might change in the following days/weeks.
You will find my general overview of the outlook for gold on the chart below:
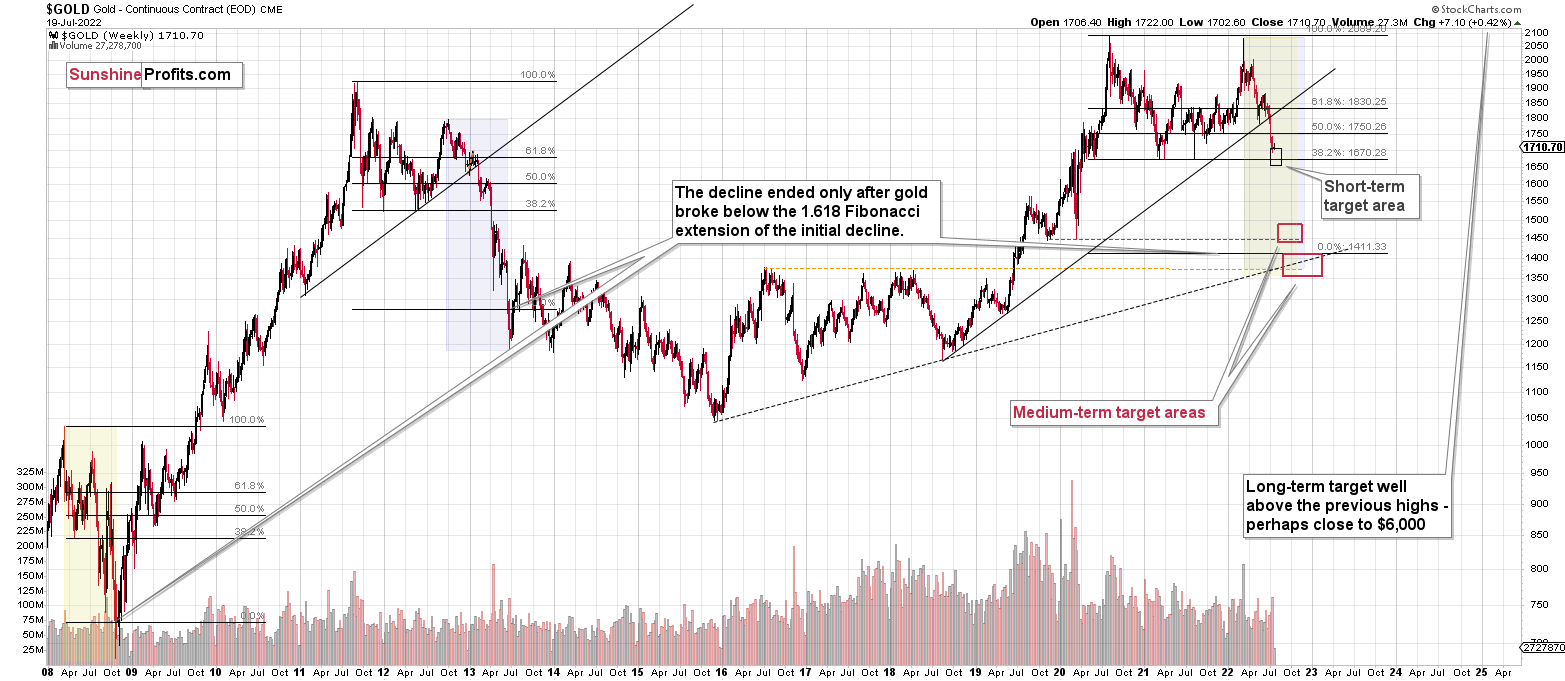
Please note that the above timing details are relatively broad and “for general overview only” – so that you know more or less what I think and how volatile I think the moves are likely to be – on an approximate basis. These time targets are not binding nor clear enough for me to think that they should be used for purchasing options, warrants, or similar instruments.
Summary
Summing up, it seems that while the medium-term trend in the precious metals sector remains down, we are likely to see a corrective upswing soon. Based on the confirmations that we have seen recently, the short-term outlook is bullish.
In my opinion, the GDXJ will most likely move higher this week and at least initially next week, correcting the recent powerful decline. Let’s keep in mind that the Fed’s interest rate decision is next week, and that’s when (approximately) PMs and miners could top.
There might be some intraday volatility on Thursday as that’s when we get the initial jobless claims in the U.S. and there’s also the interest rate decision (and press conference) from the ECB. However, I don’t think that it will change the short-term trend, even if the intraday back-and-forth movement is rather large.
It seems likely that the profits that we earned from the last couple of trades will increase even further in the near future.
After the final sell-off (that takes gold to about $1,350-$1,500), I expect the precious metals to rally significantly. The final part of the decline might take as little as 1-5 weeks, so it's important to stay alert to any changes.
As always, we'll keep you – our subscribers – informed.
To summarize:
Trading capital (supplementary part of the portfolio; our opinion): Full speculative long positions (200% of the full position) in junior mining stocks are justified from the risk to reward point of view with the following binding exit profit-take price levels:
Mining stocks (price levels for the GDXJ ETF): binding profit-take exit price: $33.87; stop-loss: none (the volatility is too big to justify a stop-loss order in case of this particular trade)
Alternatively, if one seeks leverage, we’re providing the binding profit-take levels for the JNUG (2x leveraged). The binding profit-take level for the JNUG: $36.78; stop-loss for the JNUG: none (the volatility is too big to justify a SL order in case of this particular trade).
For-your-information targets (our opinion; we continue to think that mining stocks are the preferred way of taking advantage of the upcoming price move, but if for whatever reason one wants / has to use silver or gold for this trade, we are providing the details anyway.):
Silver futures upside profit-take exit price: $20.28
SLV profit-take exit price: $18.78
AGQ profit-take exit price: $24.57
Gold futures upside profit-take exit price: $1,776
HGU.TO – alternative (Canadian) 2x leveraged gold stocks ETF – the upside profit-take exit price: $13.46
HZU.TO – alternative (Canadian) 2x leveraged silver ETF – the upside profit-take exit price: $9.18
Long-term capital (core part of the portfolio; our opinion): No positions (in other words: cash)
Insurance capital (core part of the portfolio; our opinion): Full position
Whether you’ve already subscribed or not, we encourage you to find out how to make the most of our alerts and read our replies to the most common alert-and-gold-trading-related-questions.
Please note that we describe the situation for the day that the alert is posted in the trading section. In other words, if we are writing about a speculative position, it means that it is up-to-date on the day it was posted. We are also featuring the initial target prices to decide whether keeping a position on a given day is in tune with your approach (some moves are too small for medium-term traders, and some might appear too big for day-traders).
Additionally, you might want to read why our stop-loss orders are usually relatively far from the current price.
Please note that a full position doesn't mean using all of the capital for a given trade. You will find details on our thoughts on gold portfolio structuring in the Key Insights section on our website.
As a reminder - "initial target price" means exactly that - an "initial" one. It's not a price level at which we suggest closing positions. If this becomes the case (as it did in the previous trade), we will refer to these levels as levels of exit orders (exactly as we've done previously). Stop-loss levels, however, are naturally not "initial", but something that, in our opinion, might be entered as an order.
Since it is impossible to synchronize target prices and stop-loss levels for all the ETFs and ETNs with the main markets that we provide these levels for (gold, silver and mining stocks - the GDX ETF), the stop-loss levels and target prices for other ETNs and ETF (among other: UGL, GLL, AGQ, ZSL, NUGT, DUST, JNUG, JDST) are provided as supplementary, and not as "final". This means that if a stop-loss or a target level is reached for any of the "additional instruments" (GLL for instance), but not for the "main instrument" (gold in this case), we will view positions in both gold and GLL as still open and the stop-loss for GLL would have to be moved lower. On the other hand, if gold moves to a stop-loss level but GLL doesn't, then we will view both positions (in gold and GLL) as closed. In other words, since it's not possible to be 100% certain that each related instrument moves to a given level when the underlying instrument does, we can't provide levels that would be binding. The levels that we do provide are our best estimate of the levels that will correspond to the levels in the underlying assets, but it will be the underlying assets that one will need to focus on regarding the signs pointing to closing a given position or keeping it open. We might adjust the levels in the "additional instruments" without adjusting the levels in the "main instruments", which will simply mean that we have improved our estimation of these levels, not that we changed our outlook on the markets. We are already working on a tool that would update these levels daily for the most popular ETFs, ETNs and individual mining stocks.
Our preferred ways to invest in and to trade gold along with the reasoning can be found in the how to buy gold section. Furthermore, our preferred ETFs and ETNs can be found in our Gold & Silver ETF Ranking.
As a reminder, Gold & Silver Trading Alerts are posted before or on each trading day (we usually post them before the opening bell, but we don't promise doing that each day). If there's anything urgent, we will send you an additional small alert before posting the main one.
Thank you.
Przemyslaw Radomski, CFA
Founder, Editor-in-chief

