

Briefly: In our opinion, full (200% of the regular size of the position) speculative short positions in gold, silver and mining stocks are justified from the risk/reward perspective at the moment of publishing this alert.
The silver volume that we saw last week was huge and we don’t mean only the one that accompanied the sizable daily price spike. The volume was huge also if we take the entire week into account. In fact, there was only a single week when silver rallied on volume that was bigger than what we saw during last week’s rally – ever. That was the 2011 silver top, when the emotions reached their zenith. But surely that was just a coincidence as there’s nothing else that connects these cases, some will claim, forgetting about the thing that is more important than price – time. The 2011 top formed on Monday, April 25th. You’re are reading this on Monday, April 23rd. Time is almost in perfect tune. Will this be a happy anniversary? It will, for those who are prepared.
Let’s take a look at silver’s long-term chart for the details (chart courtesy of http://stockcharts.com).
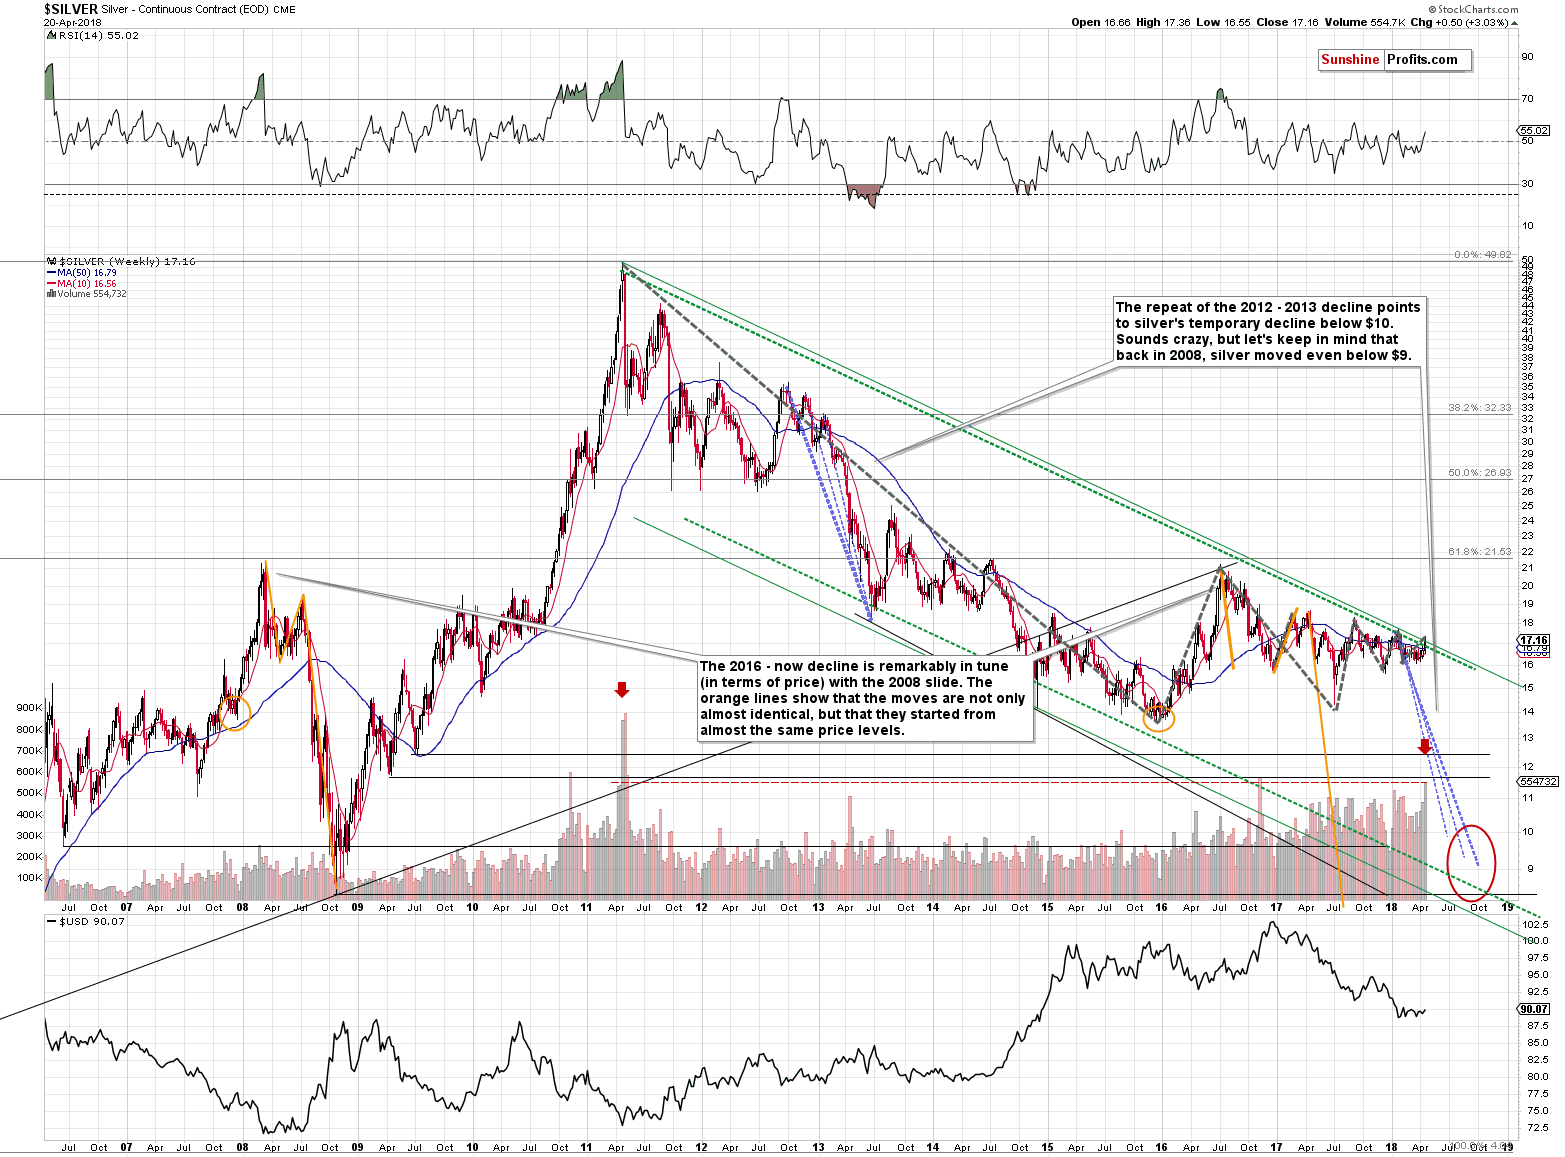
We marked the two biggest volumes that we saw during weekly upswings with red arrows. There were also two weeks when the volume during a rally was similarly big (but not as big) as the last week’s one. These were the weeks that preceded the 2011 top. In other words, the only situation that is similar to what we saw last week is the 2011 top and what we saw immediately beforehand. The implications are obviously very bearish for the following weeks. The less clear – but just as important – implication is that the decline that is likely to follow is probably going to be very sharp. This is what we’ve been expecting anyway based on several other techniques (i.a. silver’s oscillating characteristic and the similarity to the 2012-2013 decline), so the odds for this kind of movement increased further.
This well-confirmed expectation has important implications. If it wasn’t likely for the next big downswing to be volatile, it could make sense to focus on short-term price moves. But, since it is indeed the case that the decline is likely to be volatile, then it overall doesn’t seem worth it to engage in more short-term trading. It’s much better to lose a smaller fish and catch a much bigger one than the other way around. Of course, it’s not pleasant at the moment of losing the small fish, but it’s still the right and prudent thing to do.
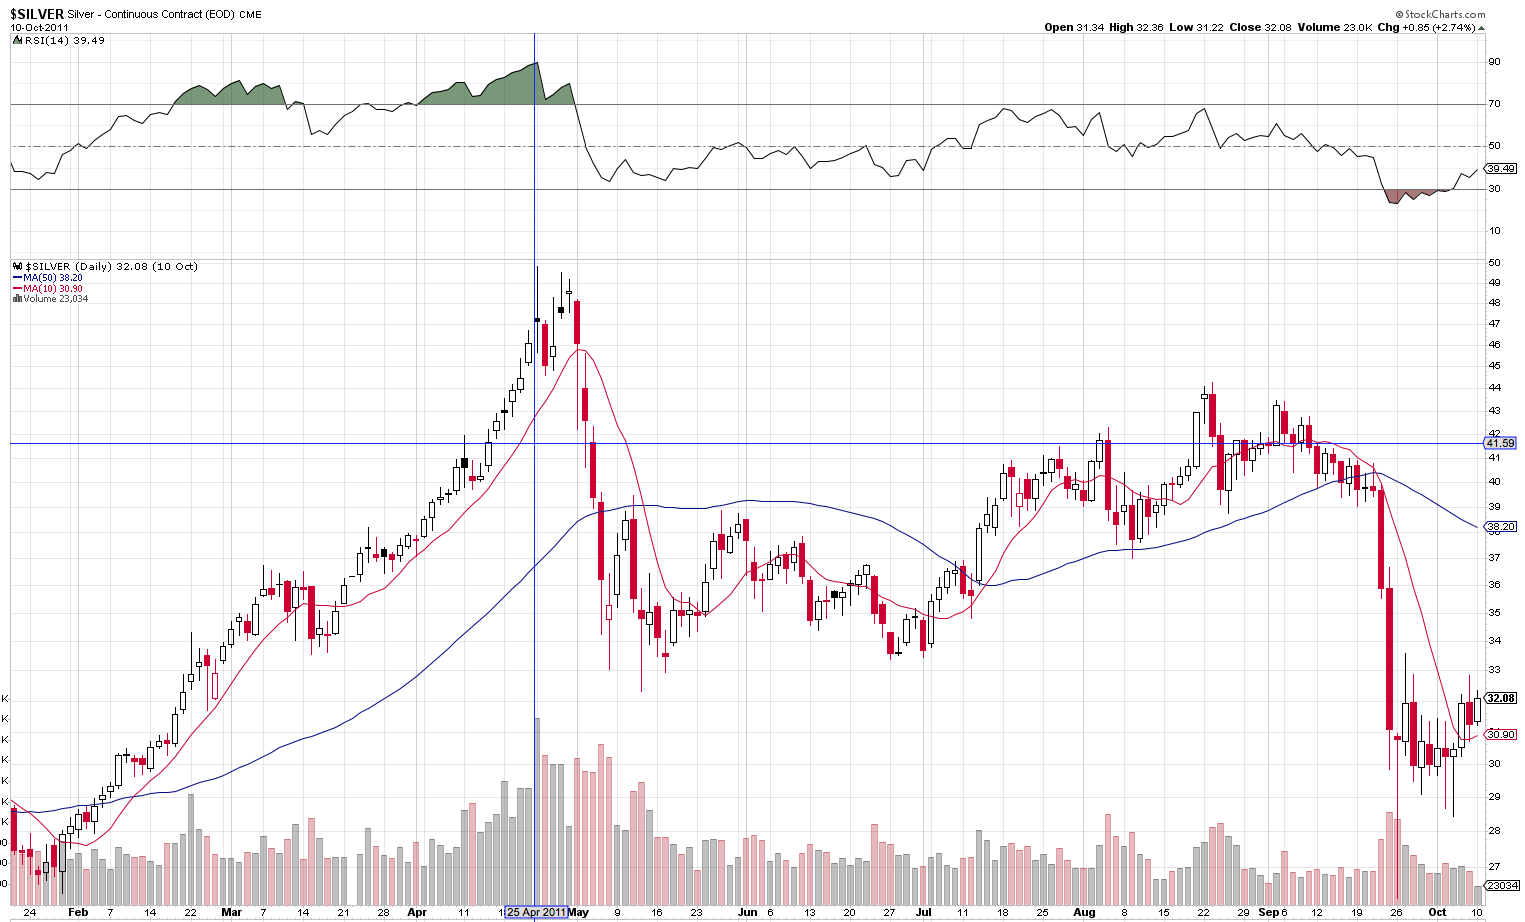
In 2011, silver did two major things on Mondays that we saw at this time of the year. It topped on April 25th in intraday terms and it started its huge decline on May 1st.
So does this mean that silver will still rally for a week?
This could be the case and let’s keep the above analogy in mind in case the white metal moves close to Wednesday’s intraday high. However, we wouldn’t bet the farm on this scenario. History doesn’t have to repeat itself to the letter, especially that the rally that preceded the 2011 top was much bigger than what we saw recently, and it took more time. Therefore, back in 2011 it seemed necessary for the market to take a few extra days to cool down the enthusiasm and this doesn’t have to apply this year. The decline could start shortly – and in a profound manner – without the few additional days of higher closing prices.
Silver’s Outperformance Continues
On Thursday, we wrote the following on silver to gold ratio:
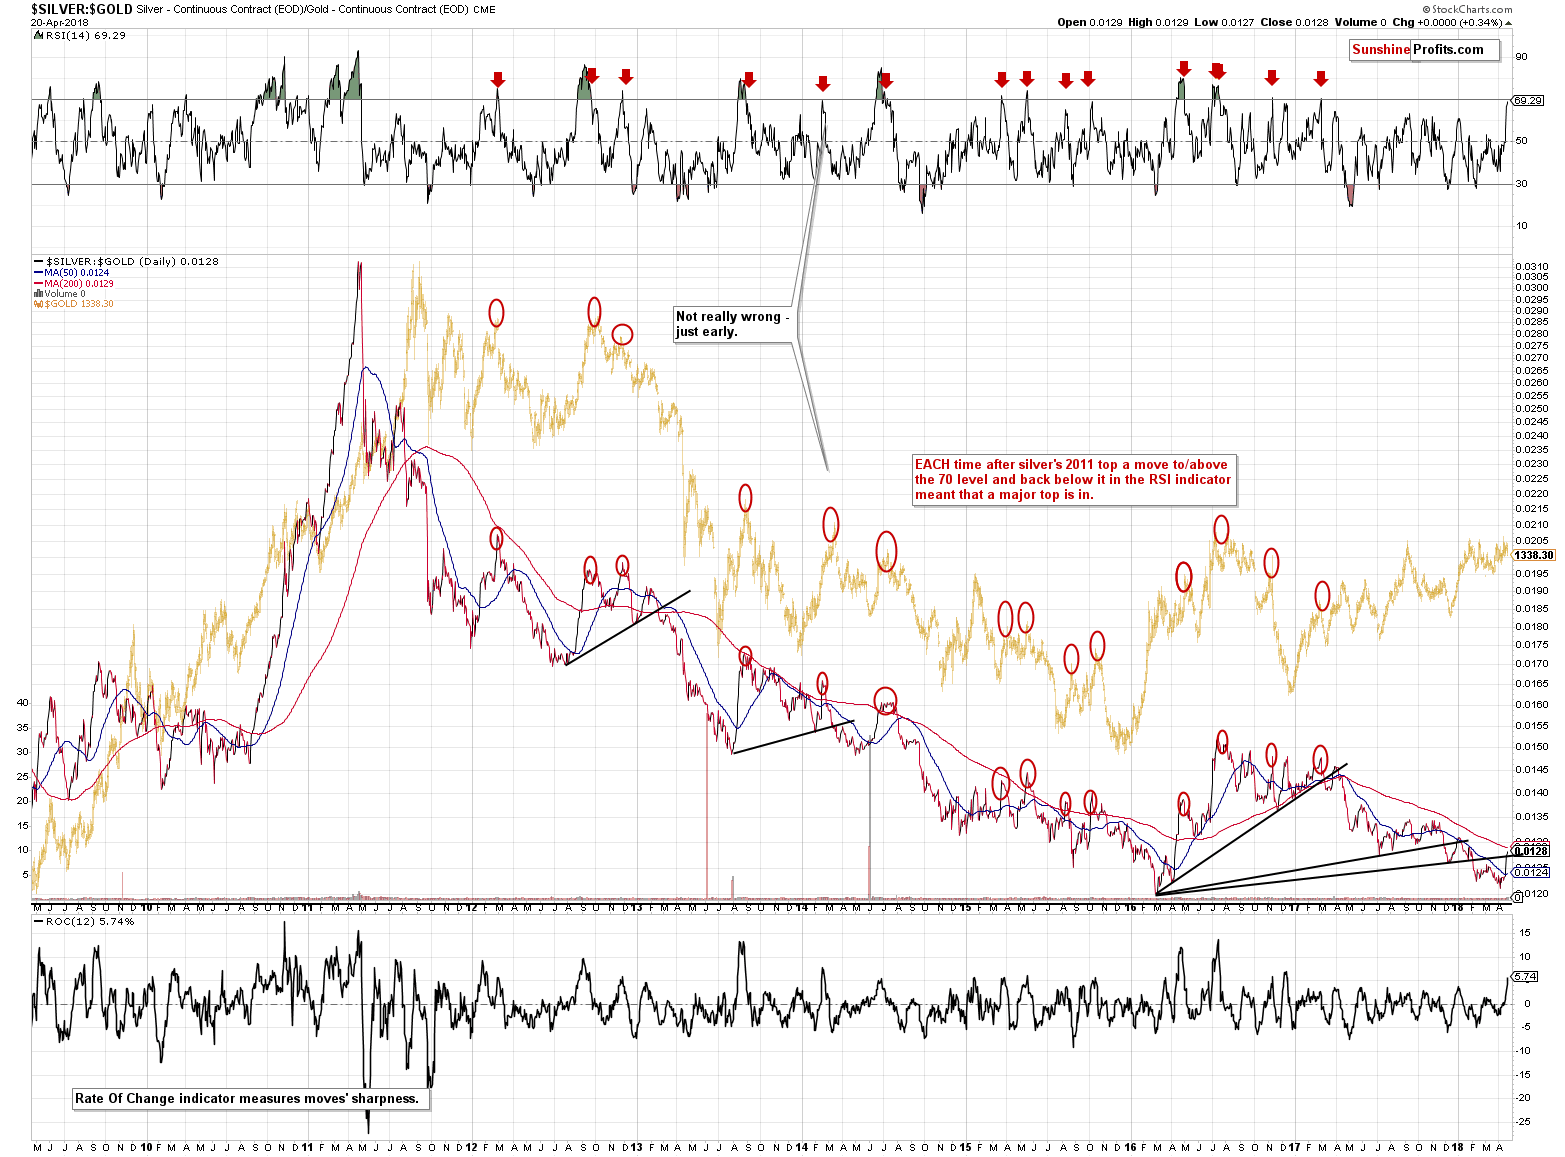
The silver to gold ratio shows that the ratio moved back to the rising black resistance line which it broke earlier this year. That’s the third time that that we’ve seen something like that in the recent history. Each breakdown below the rising black line was followed by a correction back to this line. Then the ratio moved lower once again.
That’s not the most important thing about the silver to gold ratio, though. The most important thing is that the RSI based on it moved very close to the 70 level and whenever the RSI gets above it and then declines, we see a major decline in the precious metals sector. To be clear, there are no certainties in any market, but please look at the areas marked on the above chart for details.
Now, the RSI is only at 66.84, not above 70, but let’s keep in mind that there were cases when the RSI didn’t move to 70 and we saw tops in its proximity. For instance, the early 2013 top and the late 2015 top.
This means that the precious metals sector could slide right away, but if silver outperforms just a bit more today (taking RSI above 70) and then declines in the following days, we’ll have a major and extremely effective confirmation that the final top is in.
On Friday (based on Thursday’s outperformance), we added the following:
Silver has indeed outperformed once again yesterday, but the outperformance in terms of the daily closing prices wasn’t significant enough to push the RSI above 70. It moved to 67.98, though, so it’s much closer to the key 70 barrier. It seems close enough to say that if we saw a sizable downswing in silver and in the ratio here, it would serve as a very strong confirmation that the final top is indeed in from the medium-term perspective.
Silver is declining so far today, so we could be seeing the start of the above.
Silver did decline, but it was still strong relative to gold, thus pushing the ratio a bit higher. The same goes for the RSI indicator based on it, which moved to 69.29. It’s almost right at the critical 70 level.
Combining this with the analogy to the 2011 top, we see a situation in which silver once again outperforms for a day or two and then slides erasing the entire previous week of gains, and then declines further.
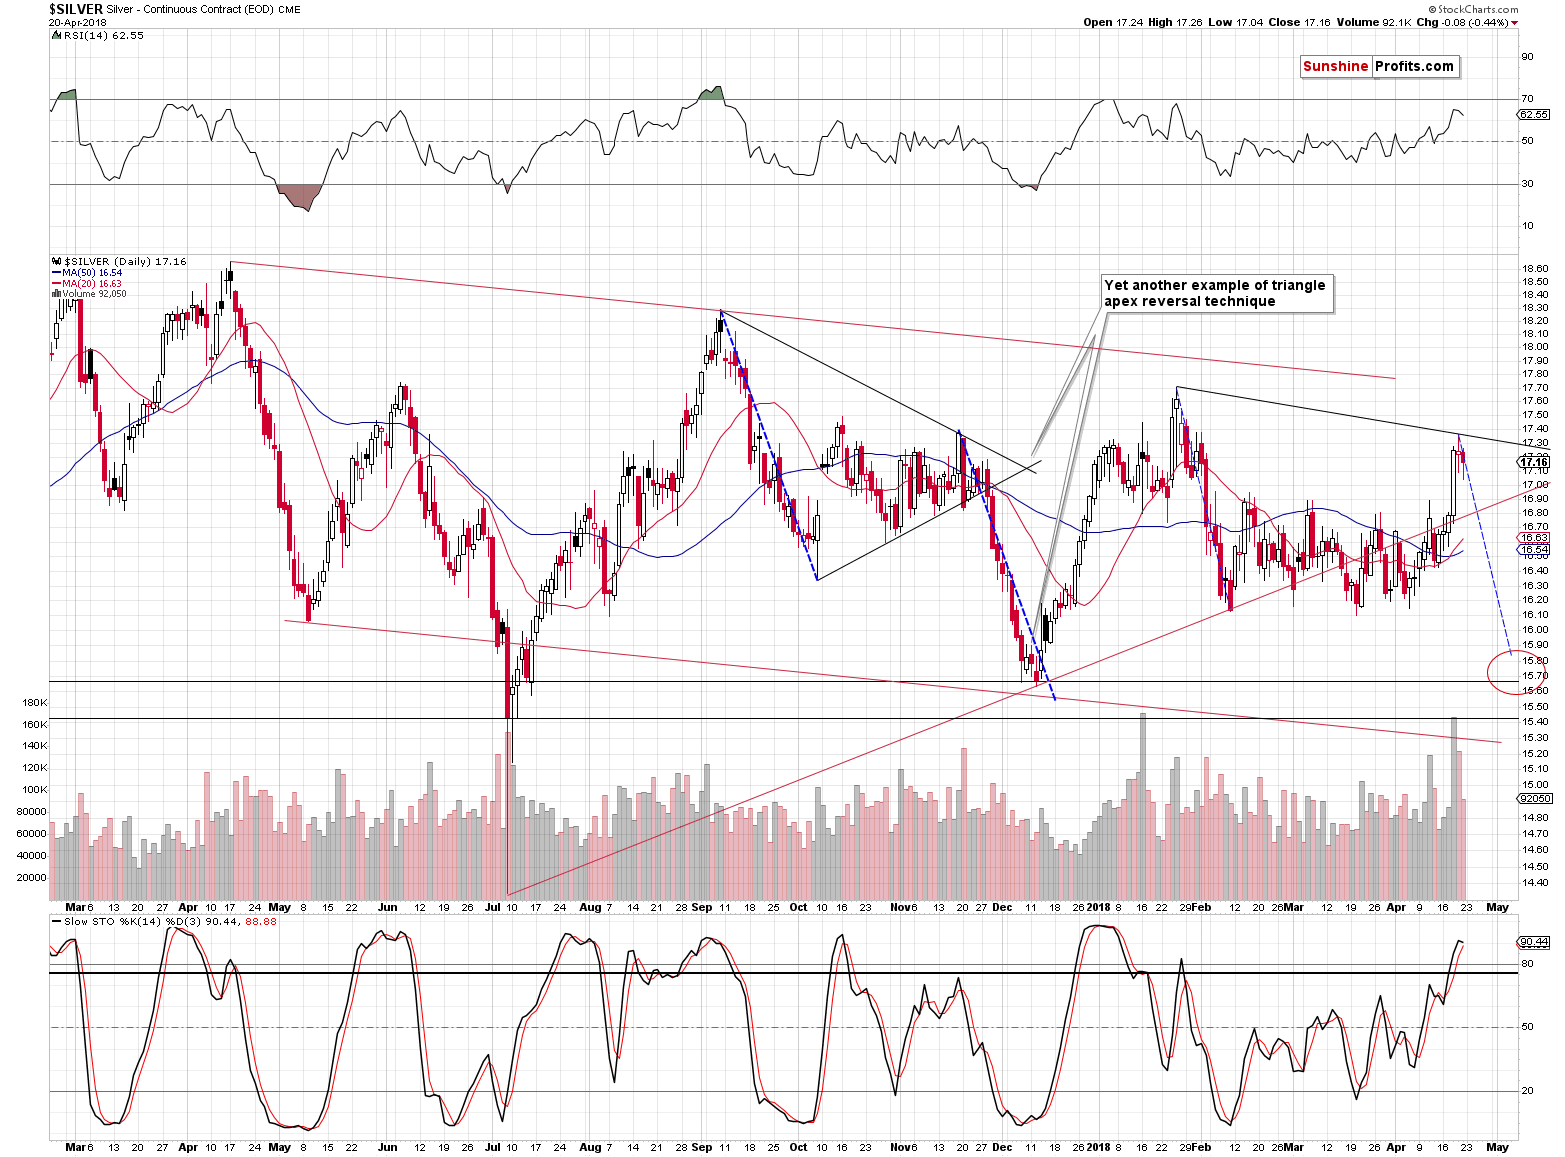
On a very short-term basis, we see that silver declined, but as we discussed earlier, it would not be impossible – or bullish – for silver to test the Wednesday’s high once again before plunging.
Before moving to gold, let’s take a moment to consider what the likely effect of the upcoming price moves in silver will be on those who trusted silver’s outperformance directly and went long. Based on many years or working with investors and traders, we know this effect – people are likely to think and react to certain price moves. Naturally, there are always exceptions, but on average investors and traders often act similarly.
Those who went long silver are likely very happy with their positions right now, feeling very confident and dismissing anything that could make their position seem incorrect. Some of them would even respond very emotionally (even to the extent of being aggressive) to the suggestions that they should short the market. They are also likely to dismiss the decline initially and then to argue that the outlook remains bullish. Once the position is under water, they will convince themselves that their trading position is actually a long-term investment because of silver’s positive fundamentals (forgetting that silver’s fundamentals will not stop a short-term slide, just like they didn’t in 2008) and this will go on until the losses are unbearable, which is when they will capitulate. For the entire time they will likely be blaming everyone else and manipulation in general.
But not you. You’re holding strong, sticking to logic and facts even though it’s very difficult to do amid temporarily rising prices – which is admirable. The funny thing about investing is that what is often difficult to do emotionally is usually also profitable. Your patience and persistence are likely to be well rewarded.
Gold’s Performance After Reversal Week
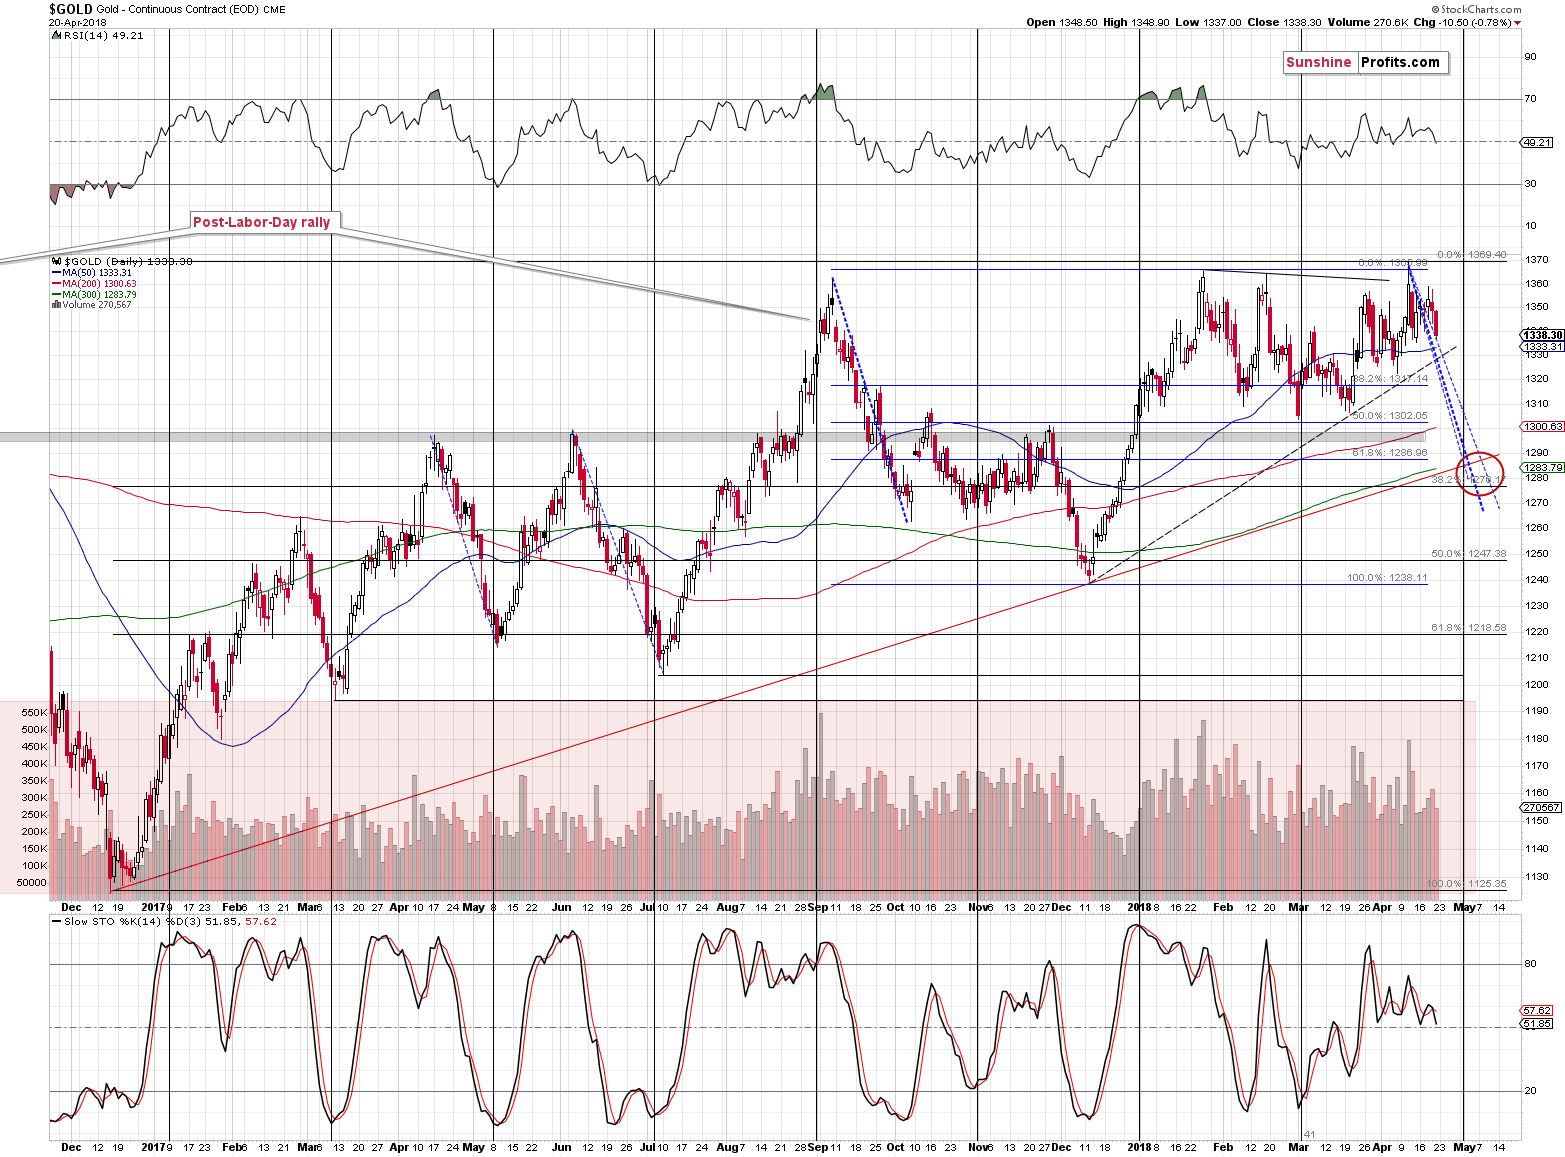
The price of gold declined visibly on Friday and it’s more or less in the middle of this year’s trading range. There is nothing exceptional about this move lower except for the fact that gold seems to be moving in tune with the previous declines that we marked with dashed blue lines. Also, with each daily decline it becomes clearer that the April turnaround that we saw during the reversal week (right between the apex-based reversals for gold, gold stocks, and silver) was a major reversal, and it is increasingly likely that it was the final top for this year.
Mining Stocks’ Big and Small Declines
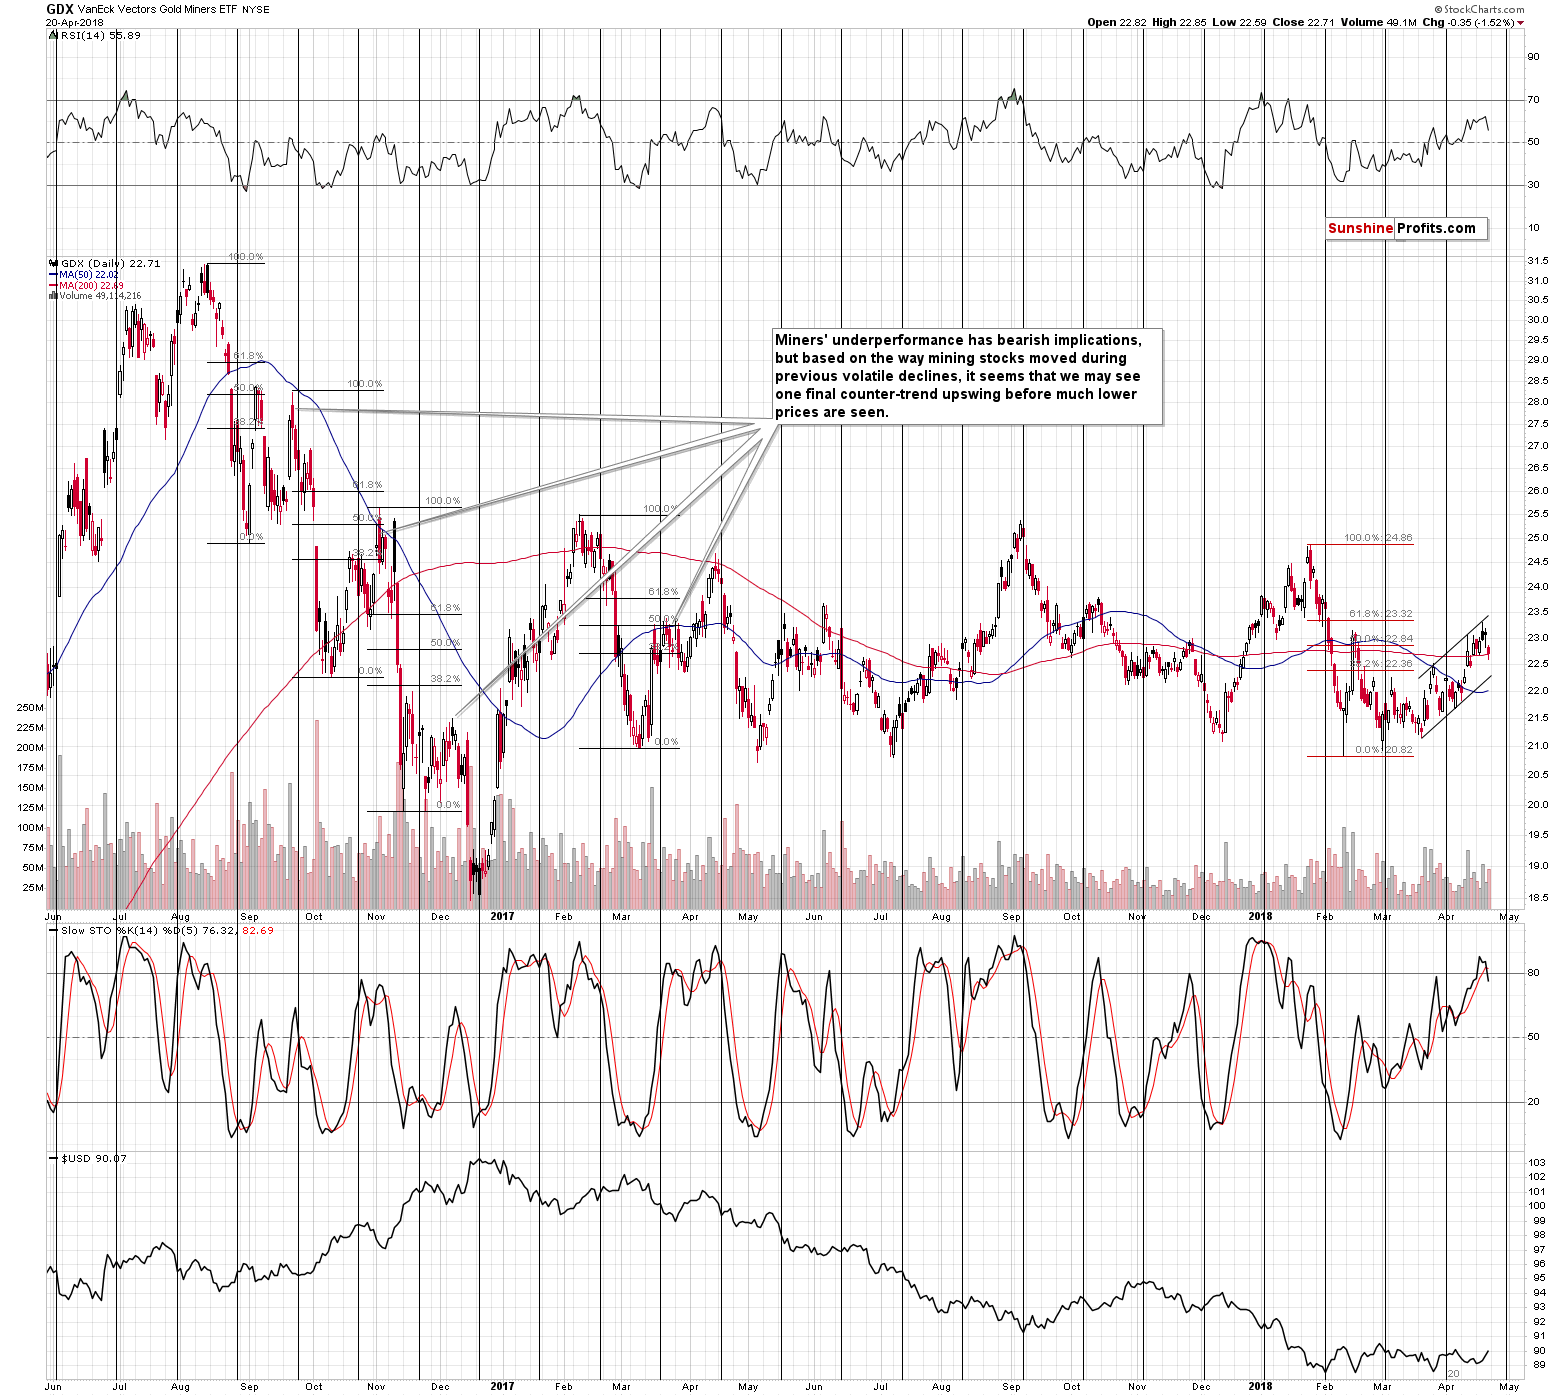
In Friday’s Alert, we commented on the small breakout in the GDX in the following way:
Well, technically, GDX broke above the February high, but it closed just $0.05 above it. The breakout is so small that it would require a meaningful confirmation to really matter. A confirmation that GDX will likely not get based on today’s pre-market move lower in gold.
Instead of the confirmation, we saw a clear invalidation of the tiny breakout, which is a classic sell signal.
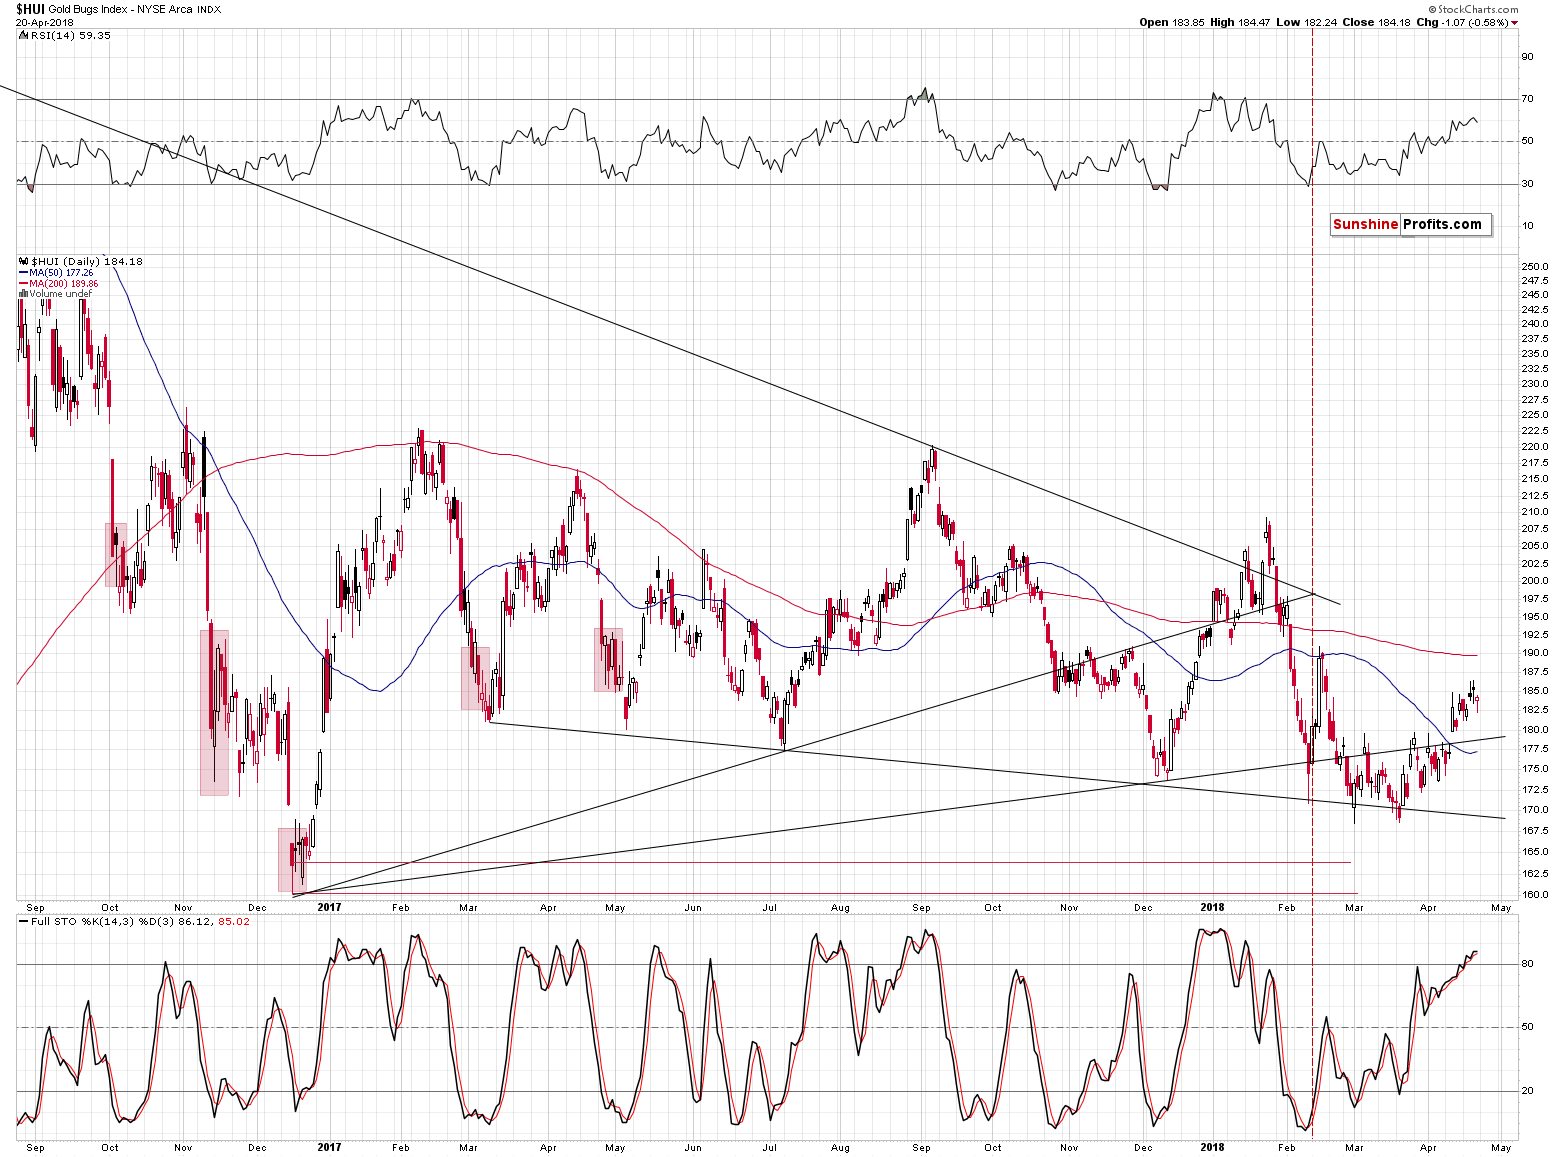
Friday’s session was also interesting in the case of mining stocks because the two major proxies for the sector moved lower in a different way. The GDX ETF moved lower in a visible way and on significant volume, while the HUI Index moved lower rather insignificantly. What should one make of this? It’s just a single-day phenomenon, so it’s not very informative, but there could be a specific reason for which the HUI Index showed some strength. For the same reason it could (! – doesn’t have to) even show strength today or tomorrow once again.
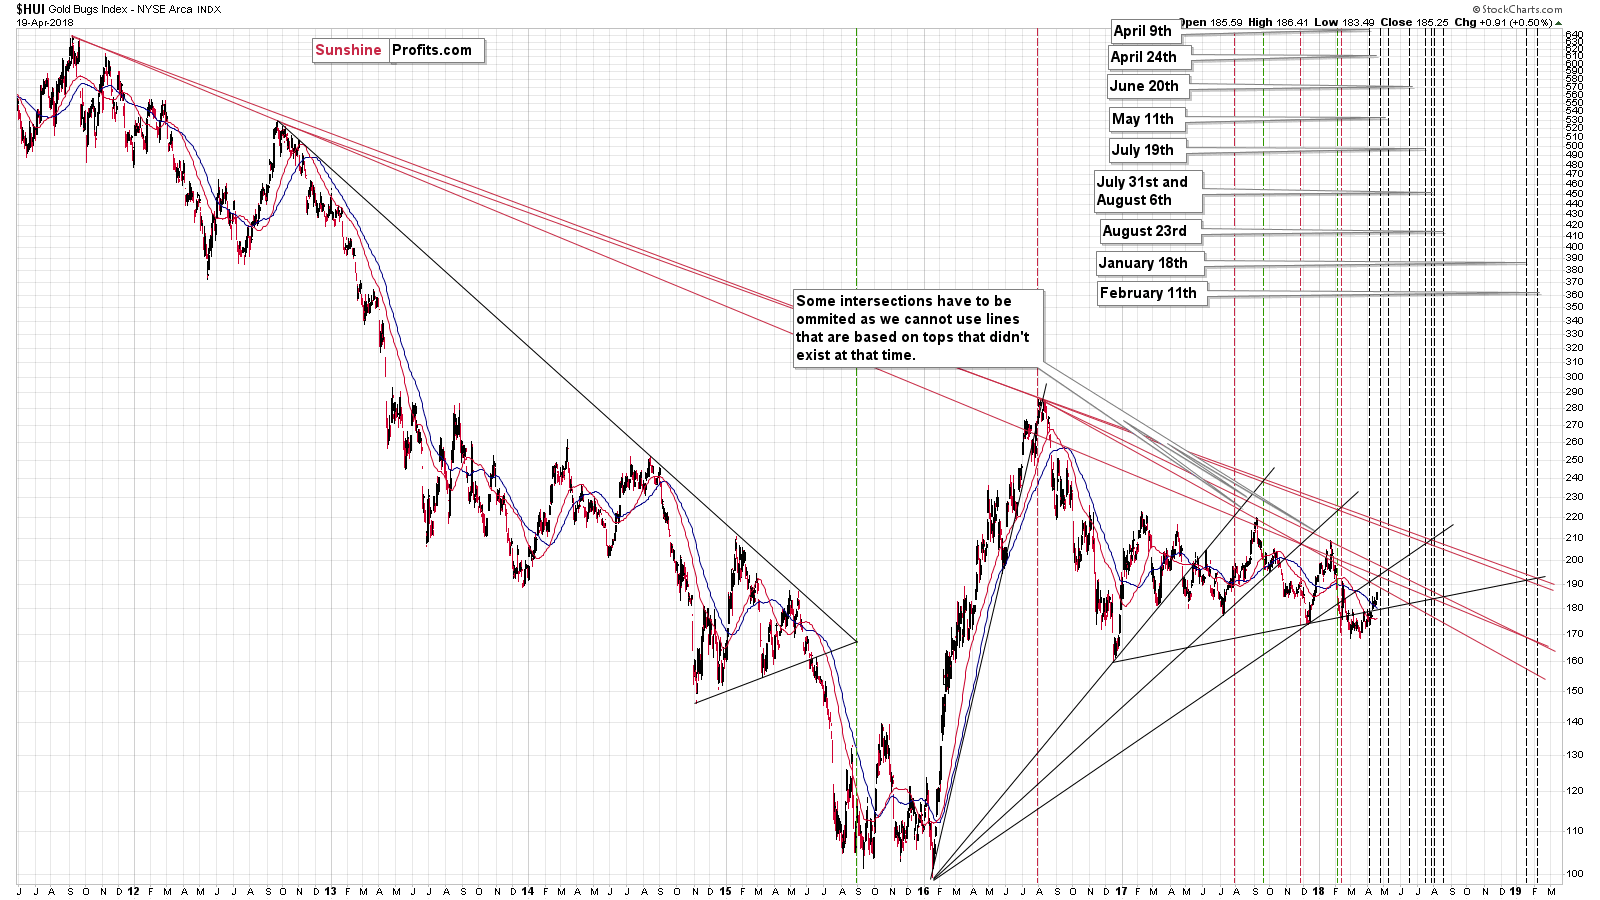
The next triangle-apex-based reversal is tomorrow and since it turned out that the proximity of these dates can serve as a trigger for reversals, miners could easily form a reversal today. There are two consequences. The first one is that we are likely to see a big decline shortly. The second is that even if we see a move to new monthly highs within the next few days, it will not be a major bullish breakout, but rather a way for the reversal to form.
The Relative Top
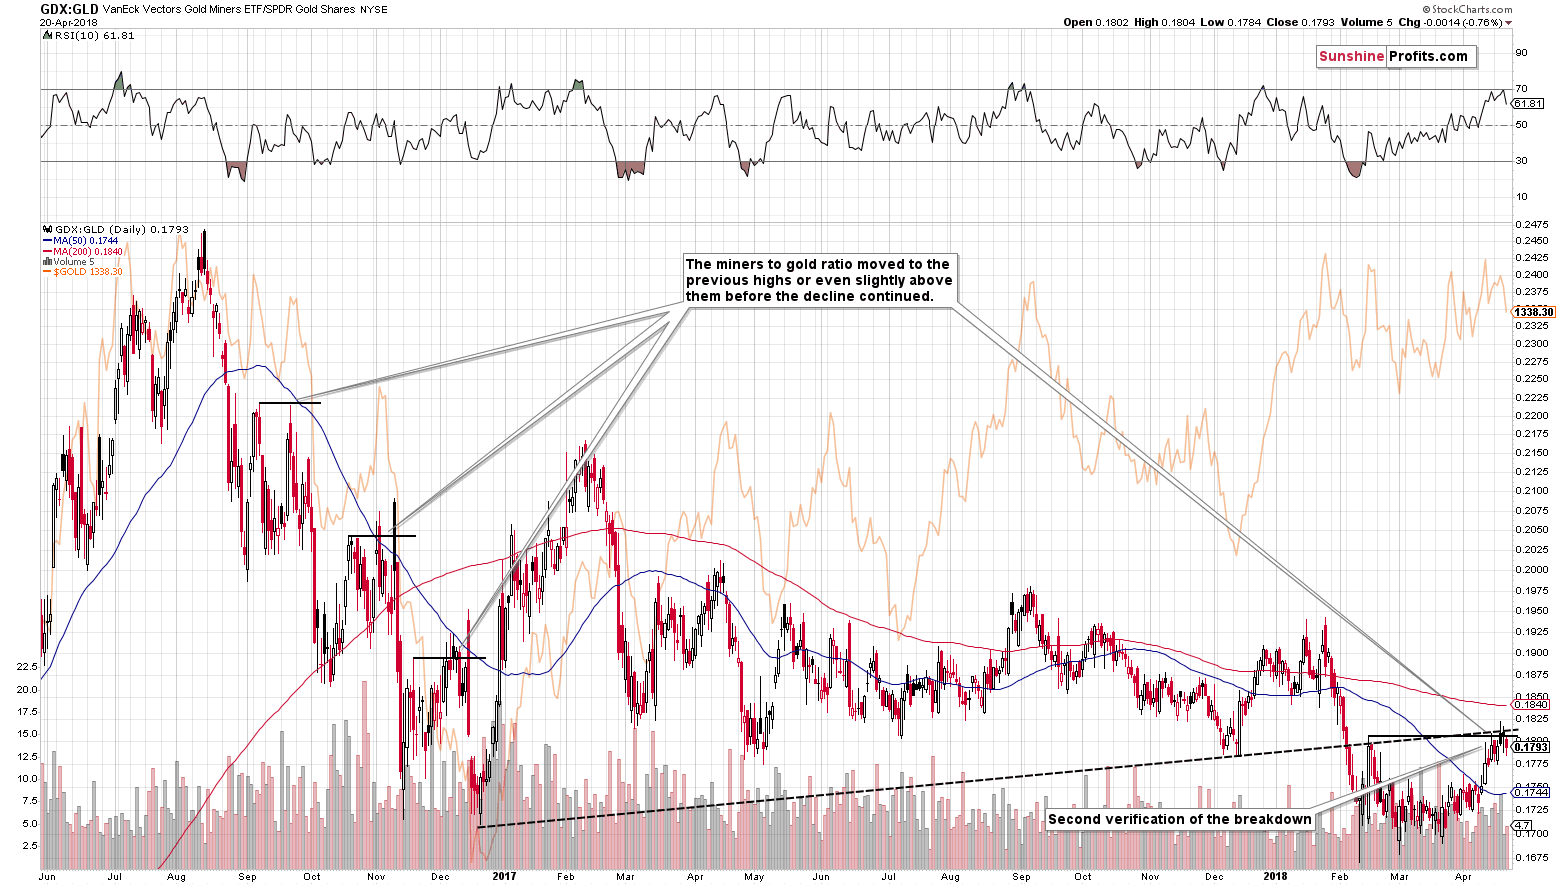
The GDX to GLD ratio also moved lower, closing the week clearly below the mid-February high. The implications are bearish, especially that we saw an analogous signal in the GDX.
The recent strength of the mining stocks relative to gold seems to have been nothing more than just another verification of the breakout above the rising resistance line and a repeat of the 2016 performance that we saw during the big decline.
Forex: Reversal and Breakdown
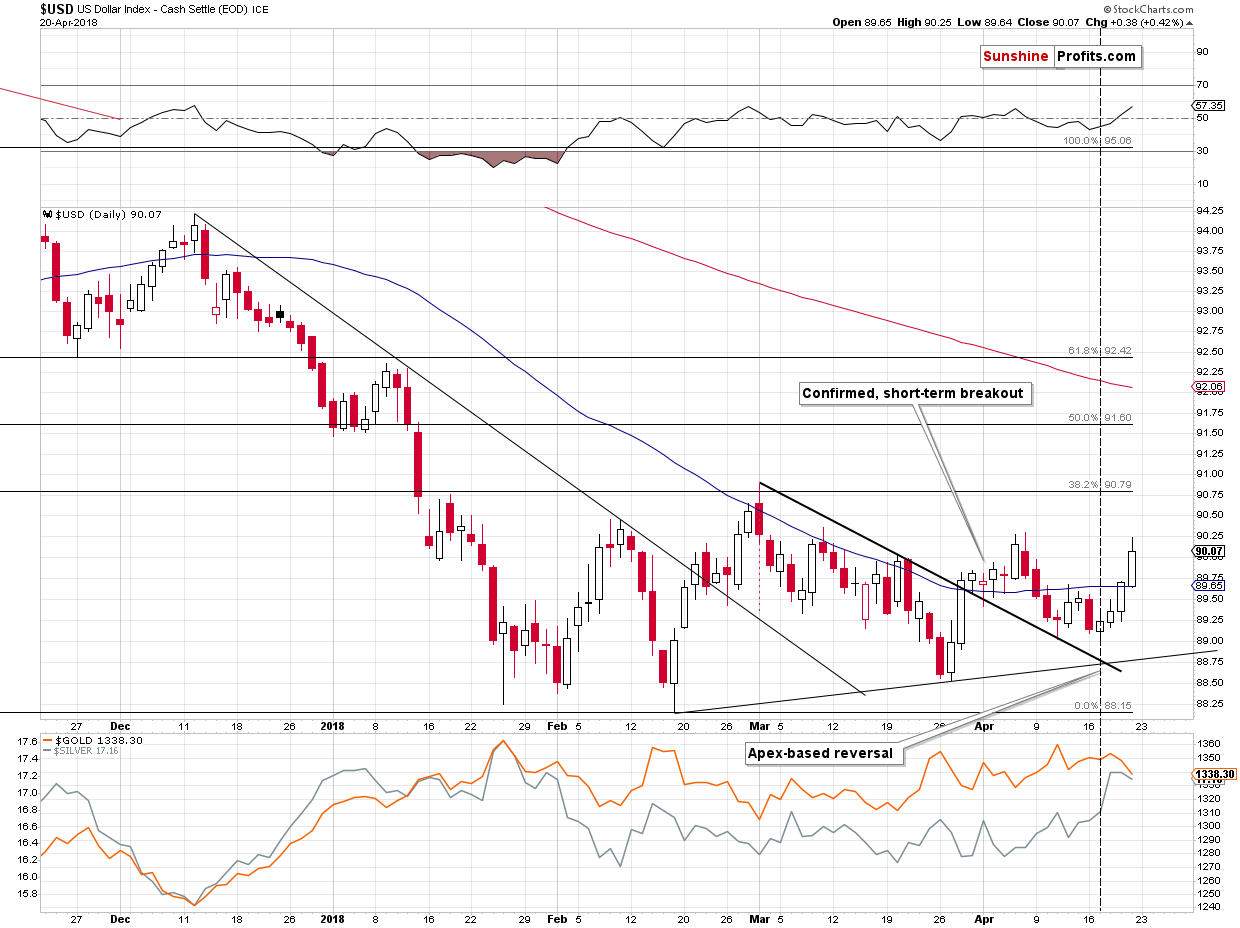
In the previous alerts, we wrote that the USD Index was likely to reverse based on the apex of the triangle that we marked with black lines.
It’s now clear that we indeed saw a reversal as the USD moved higher at the reversal day and in all following days.
This has profound implications for the following weeks and months.
Weeks, because a bigger rally in the USD Index is likely to translate into at least a visible decline in the EUR/USD.
We previously wrote the following:
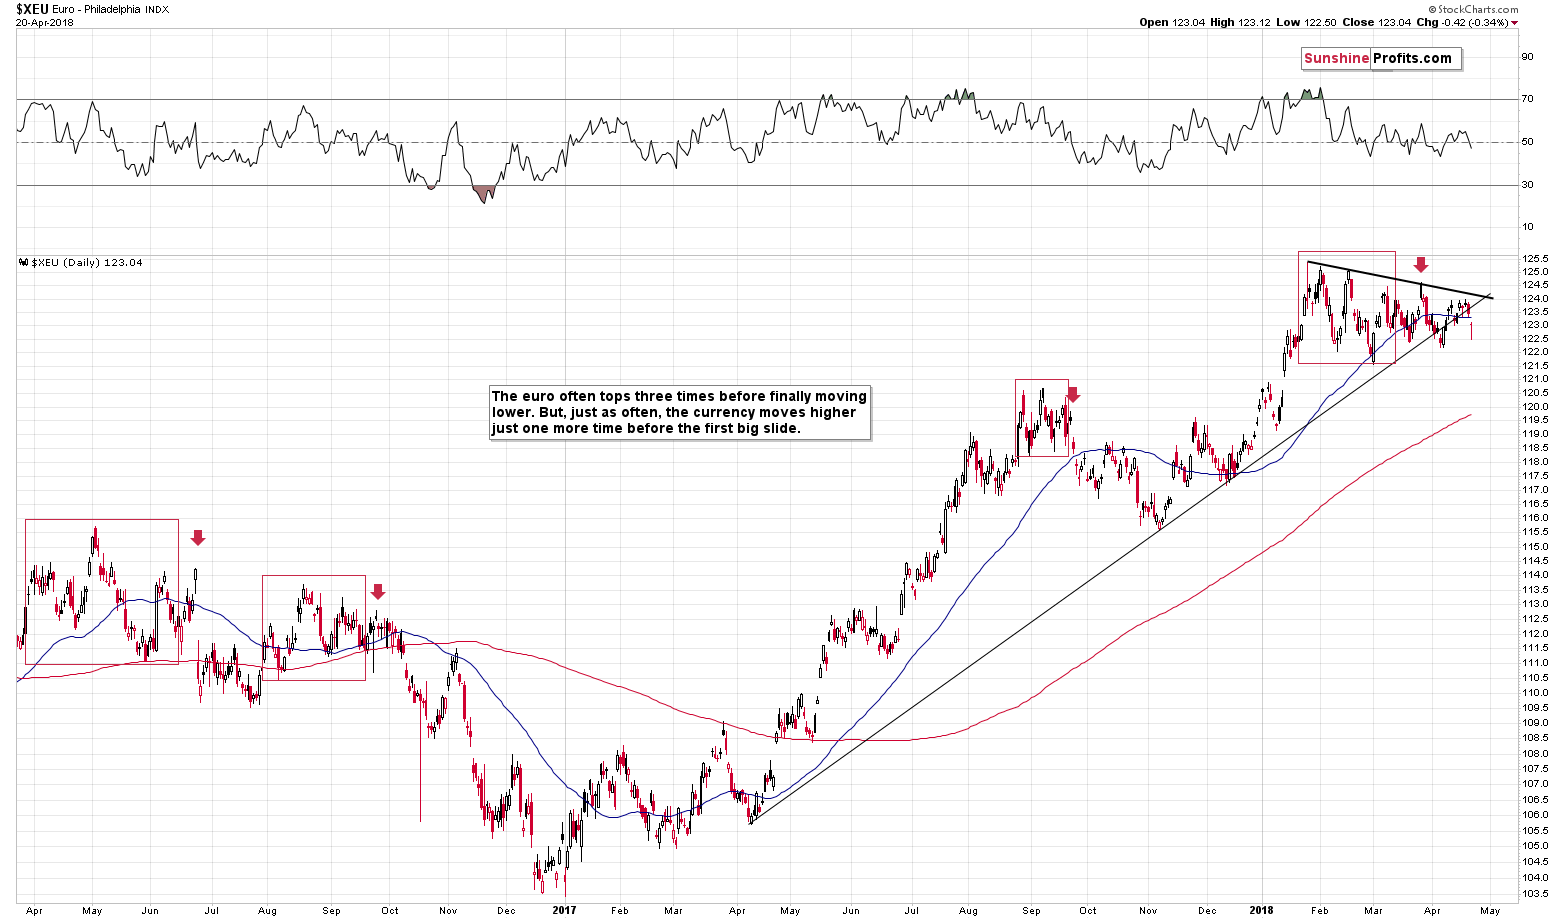
That’s important, because the euro is on the verge of a breakdown. Looking at the above chart alone it’s not clear if we’re going to see a breakout or breakdown, but keeping the USDX picture in mind, a breakdown is much more likely. A breakdown below the medium-term support line would be an important development, so the follow-up action would likely be significant. Especially that the euro has been consolidating for more than 2 months. The last time we saw something similar was between late August 2016 and early October 2016. The decline that followed was the biggest that we saw in recent history.
(…) please note that the apex of the triangle in the euro is at the end of the month. That’s a perfect confirmation of the targets that we have for gold and silver based on the shapes of the previous declines, support lines, and gold’s cyclical turning point.
The implications for the precious metals market are bearish.
We indeed saw a breakdown in yesterday’s [Thursday’s] session. It was not significant, and it will definitely need to be confirmed before there are significant bearish implications, but given the clear reversal in the USD, it seems that the dam is broken for the euro and it’s now only a matter of time before the slide accelerates, taking precious metals with it.
Friday’s move lower made the breakout clear and almost confirmed. Almost, because ideally we would like to see three daily closes below the support level in order to view the breakdown as fully confirmed. We have, however, seen a weekly close below it, which is also significant.
The price reversed before the end of the session, so it might seem bullish, but in light of the major breakdown and the fact that the EUR/USD finally closed the day and week below the support, it’s not. A very short-term corrective upswing is quite natural after a major breakdown and the small move higher that we saw before the end of the session could be just that.
The outlook for the euro deteriorated significantly based on Friday’s session and the same goes for the outlook for the PMs.
Summary
Summing up, silver’s anniversary is approaching, and many signs point to a scenario in which its celebration will take a rather grim turn for those who believed in last week’s sharp rally. The invalidation of the breakouts in the GDX and its ratio to the GLD, the sizable breakdown in the EUR/USD and yet another move higher in the silver to gold ratio (along with its RSI Index) all confirm the bearish outlook.
Thank you for understanding how the markets work (especially the silver market) - it seems very likely that our patience will be well rewarded.
On an administrative note, due to your Editor’s travel plans for the rest of the week, the next few alerts will be shorter than the ones that we’ve been publishing recently. Of course, we will keep an eye on the market and we’ll keep posting the alerts on a daily basis, plus intraday alerts whenever the situation requires it.
As always, we will keep you – our subscribers – informed.
To summarize:
Trading capital (supplementary part of the portfolio; our opinion): Full short positions (200% of the full position) in gold, silver and mining stocks are justified from the risk/reward perspective with the following stop-loss orders and initial target price levels:
- Gold: initial target price: $1,218; stop-loss: $1,382; initial target price for the DGLD ETN: $53.98; stop-loss for the DGLD ETN $37.68
- Silver: initial target price: $14.63; stop-loss: $18.06; initial target price for the DSLV ETN: $33.88; stop-loss for the DSLV ETN $19.27
- Mining stocks (price levels for the GDX ETF): initial target price: $19.22; stop-loss: $23.54; initial target price for the DUST ETF: $39.88; stop-loss for the DUST ETF $21.46
In case one wants to bet on junior mining stocks' prices (we do not suggest doing so – we think senior mining stocks are more predictable in the case of short-term trades – if one wants to do it anyway, we provide the details), here are the stop-loss details and initial target prices:
- GDXJ ETF: initial target price: $27.82; stop-loss: $36.14
- JDST ETF: initial target price: $94.88 stop-loss: $41.86
Long-term capital (core part of the portfolio; our opinion): No positions (in other words: cash)
Insurance capital (core part of the portfolio; our opinion): Full position
Important Details for New Subscribers
Whether you already subscribed or not, we encourage you to find out how to make the most of our alerts and read our replies to the most common alert-and-gold-trading-related-questions.
Please note that the in the trading section we describe the situation for the day that the alert is posted. In other words, it we are writing about a speculative position, it means that it is up-to-date on the day it was posted. We are also featuring the initial target prices, so that you can decide whether keeping a position on a given day is something that is in tune with your approach (some moves are too small for medium-term traders and some might appear too big for day-traders).
Plus, you might want to read why our stop-loss orders are usually relatively far from the current price.
Please note that a full position doesn’t mean using all of the capital for a given trade. You will find details on our thoughts on gold portfolio structuring in the Key Insights section on our website.
As a reminder – “initial target price” means exactly that – an “initial” one, it’s not a price level at which we suggest closing positions. If this becomes the case (like it did in the previous trade) we will refer to these levels as levels of exit orders (exactly as we’ve done previously). Stop-loss levels, however, are naturally not “initial”, but something that, in our opinion, might be entered as an order.
Since it is impossible to synchronize target prices and stop-loss levels for all the ETFs and ETNs with the main markets that we provide these levels for (gold, silver and mining stocks – the GDX ETF), the stop-loss levels and target prices for other ETNs and ETF (among other: UGLD, DGLD, USLV, DSLV, NUGT, DUST, JNUG, JDST) are provided as supplementary, and not as “final”. This means that if a stop-loss or a target level is reached for any of the “additional instruments” (DGLD for instance), but not for the “main instrument” (gold in this case), we will view positions in both gold and DGLD as still open and the stop-loss for DGLD would have to be moved lower. On the other hand, if gold moves to a stop-loss level but DGLD doesn’t, then we will view both positions (in gold and DGLD) as closed. In other words, since it’s not possible to be 100% certain that each related instrument moves to a given level when the underlying instrument does, we can’t provide levels that would be binding. The levels that we do provide are our best estimate of the levels that will correspond to the levels in the underlying assets, but it will be the underlying assets that one will need to focus on regarding the signs pointing to closing a given position or keeping it open. We might adjust the levels in the “additional instruments” without adjusting the levels in the “main instruments”, which will simply mean that we have improved our estimation of these levels, not that we changed our outlook on the markets. We are already working on a tool that would update these levels on a daily basis for the most popular ETFs, ETNs and individual mining stocks.
Our preferred ways to invest in and to trade gold along with the reasoning can be found in the how to buy gold section. Additionally, our preferred ETFs and ETNs can be found in our Gold & Silver ETF Ranking.
As a reminder, Gold & Silver Trading Alerts are posted before or on each trading day (we usually post them before the opening bell, but we don't promise doing that each day). If there's anything urgent, we will send you an additional small alert before posting the main one.
=====
Latest Free Trading Alerts:
What’s Bitcoin really worth? This question might really drive you mad if you think hard enough about it. $0? $10? Maybe $1,000,000 for one coin? The range of the numbers can make your head spin but it is the explanation behind the number that matters. For the most part, investors don’t have a good reason why Bitcoin is worth this or that, apart from claims that “it will take over the world” and so on. This hasn’t stopped people from trying, though. Is it even important for short-term traders? Can it boost profits on our hypothetical positions?
=====
Hand-picked precious-metals-related links:
PRECIOUS-Gold slips to 2-wk low as rising bond yields support dollar
Finally home, Bundesbank's gold goes on show
=====
In other news:
World Stocks stumble as U.S. yields near 3 percent
Dollar puts euro under pressure after U.S. bond yields rise
Bank of England 'dangerously ill-equipped' for next recession, says IPPR
China 'welcomes' Mnuchin's offer to hold trade talks in Beijing
Mobius says there’s a 30% correction coming for U.S. stocks
=====
Thank you.
Sincerely,
Przemyslaw Radomski, CFA
Founder, Editor-in-chief, Gold & Silver Fund Manager
Gold & Silver Trading Alerts
Forex Trading Alerts
Oil Investment Updates
Oil Trading Alerts

