

Briefly: in our opinion, full (300% of the regular position size) speculative short positions in mining stocks are justified from the risk/reward point of view at the moment of publishing this Alert.
Gold just closed the month and quarter and its performance on the final day of both was very encouraging for the bulls. What's going on and what changed?
Let's start with the big picture.
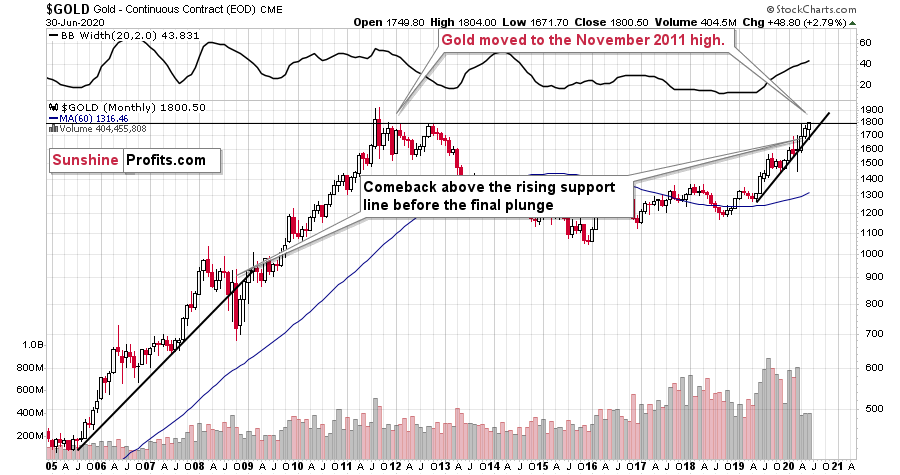
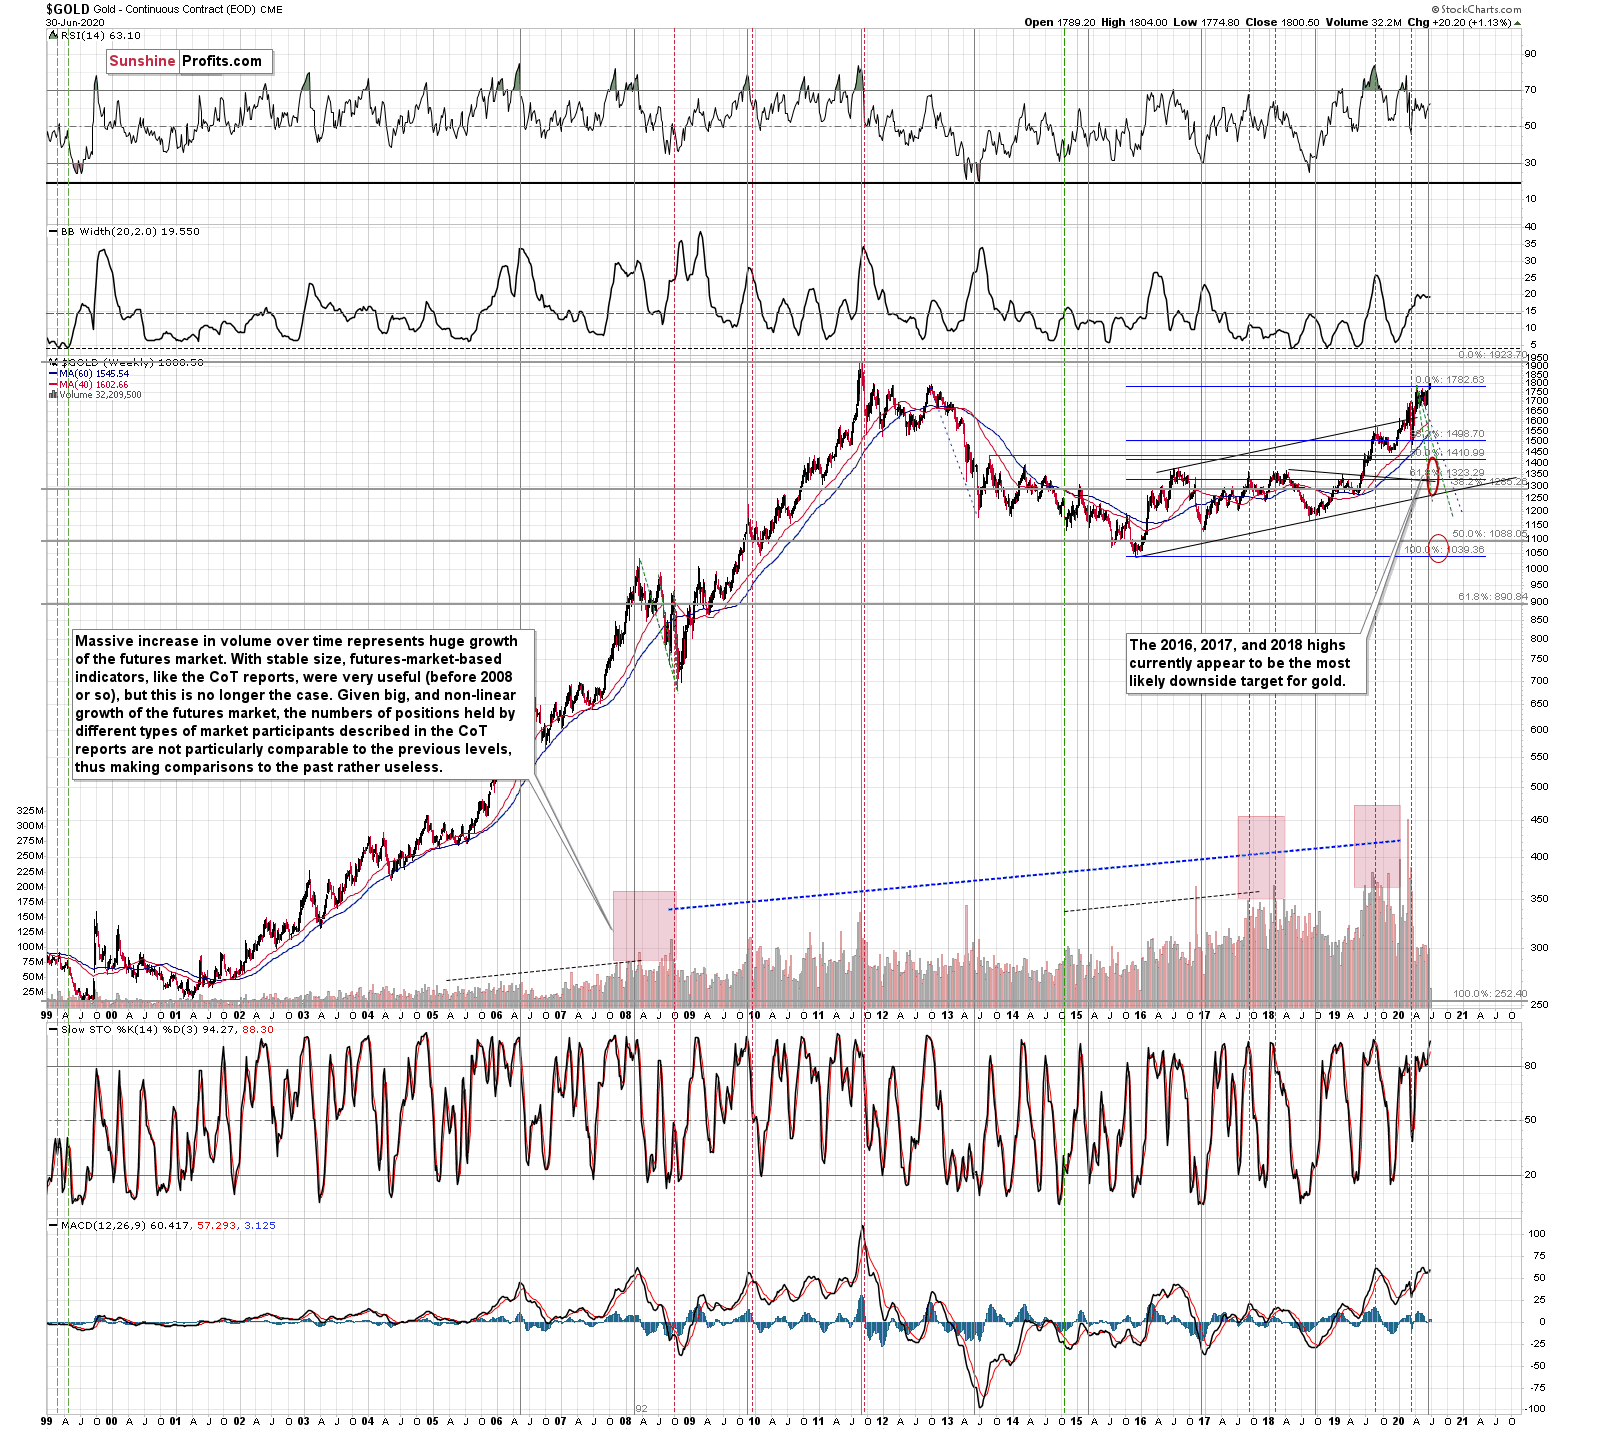
Gold just moved to the November 2011 high and in today's pre-market trading it even moved above it. The volume on which gold moved up last month was relatively small, which doesn't support the bullish case, but a confirmed breakout above the November 2011 high would be an important technical development, nonetheless.
The key word here is "confirmed". The November 2011 high was $1,804.40, and at the moment of writing these words, gold futures are trading at $1,805.15 - that's less than $1 above the above-mentioned high.
The way in which gold moved between 2012 and 2020 created a near-perfect cup from the cup-and-handle formation. Generally, the bigger the base, the stronger the move, and this time the base is huge. Still, the "handle" of the pattern is still missing, and it could take form of a volatile plunge. This would be in tune with how gold reacted to the first wave of coronavirus.
The breakout above the November 2011 high is far from being confirmed, and in our view it's unlikely to be confirmed. Why?
There are multiple reasons for it, but the most precise and technical ones are gold's likelihood to reverse its direction based on the triangle-vertex-based reversal and the long-term cyclical turning point.
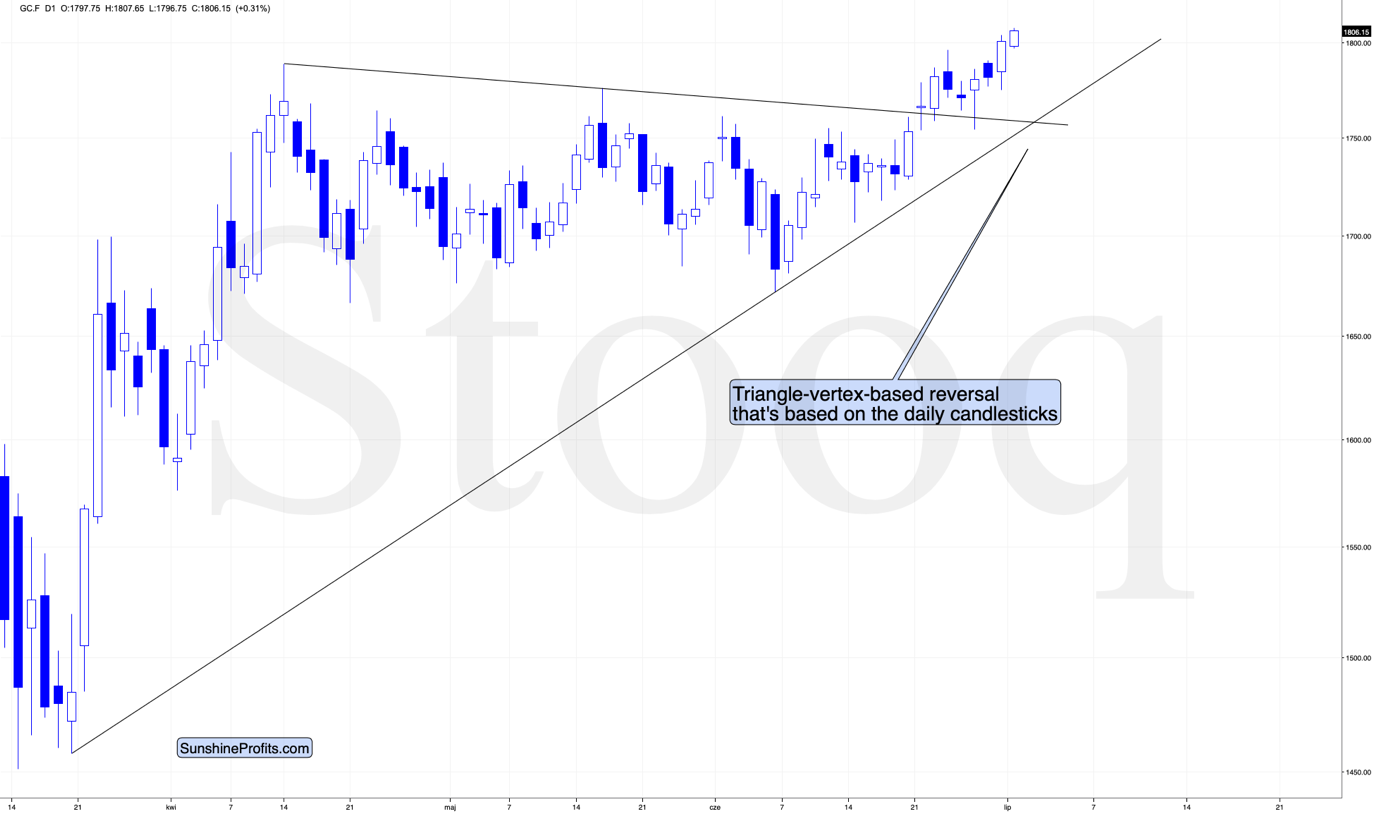
As we wrote previously, the triangle-vertex-based reversal is almost here, which means that gold is likely to reverse. In my Monday's analysis, I described the triangle-vertex-based reversals' implications in the following way:
The resistance line, above which gold tried to break and the rising support line based on the March and June lows cross more or less in the first days of July. The triangle-vertex-based reversals have pointed to many important tops and bottoms in the recent weeks and months, so perhaps the above-mentioned target date will be the date when gold finally bottoms. If gold slides from here this week, the above will become the most likely outcome.
We supplemented the above with another look at the data. When looking at gold's performance through its 4-hour candlesticks, we get different time target for the reversal. We described it on Friday in the following way:
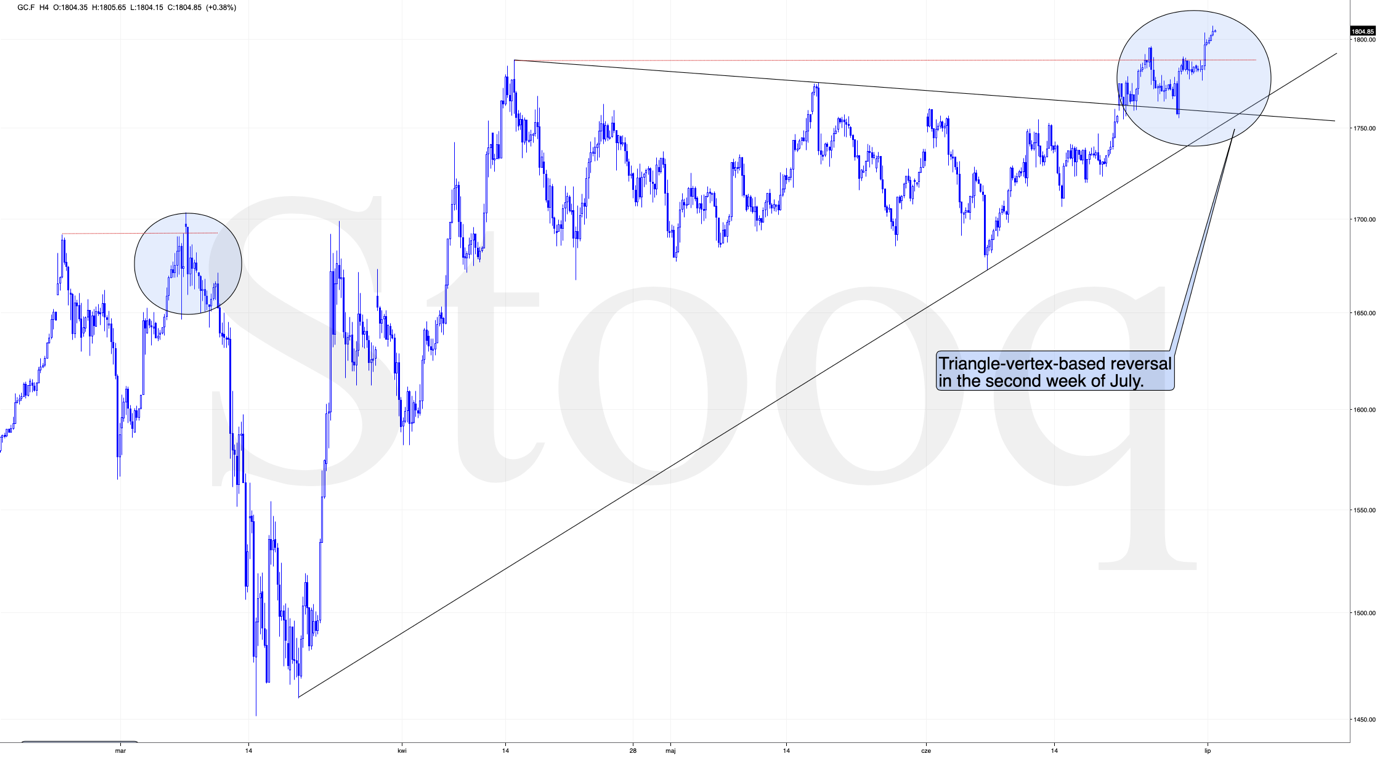
"As you can see, the areas marked with blue ellipses are quite similar in terms of shape. Gold paused shortly after the initial post-top decline, but the move resumed shortly thereafter. Consequently, not having seen the volatile decline yet, doesn't change anything.
We previously wrote about the next major triangle-vertex based reversal being in early July. The chart which we used to create this reversal, was based on daily candlesticks and the above chart shows something slightly different. The 4-hour gold chart tells us that - based on the same technique - gold might actually reverse its course in the second week of July, not at its very beginning. Which is more likely? The latter, as gold is still above $1,700 while there are just three trading days left before the end of the month.
The situation is similar to what happened after March's top in both: technical and Covid-19 terms, and since the latter is the most important fundamental piece of news, the situations are indeed very alike."
So, we have one reversal indication in the next few days, and then another in about 2 weeks. As you may remember from March, a lot can happen in 2 weeks, and prices can move really significantly in such period. At this time, we are not ruling out the situation in which gold starts its slide within the next few days, and then forming a major bottom - much lower - closer to the middle of July.
Speaking of target dates, let's keep in mind that gold's long-term turning point is here, which further emphasizes the likelihood of seeing a major turnaround right now.
The areas that we marked with blue on the previous chart don't appear similar anymore. This might change once gold reverses and they could become similar once again in a different scale. However, that's not the most important take-away. The most important take-away is that the reversals provided by all techniques are actually relatively close to each other given that this is already the first week of July, and that the second week of the month starts in just 2 trading days (the markets are closed in the U.S. this Friday).
The implications here is clear - don't count on gold's breakout's success.
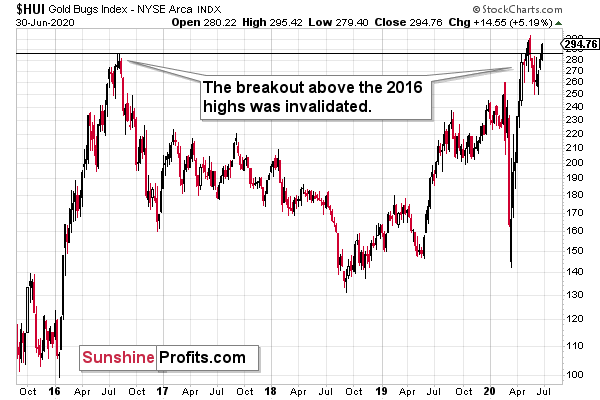
The HUI Index is once again trying to break above the 2016 high. Although it might move higher today, we doubt that it would be able to hold its gains for a long time, in light of gold's looming reversal. Instead, another invalidation of the reversal is likely.
And silver?
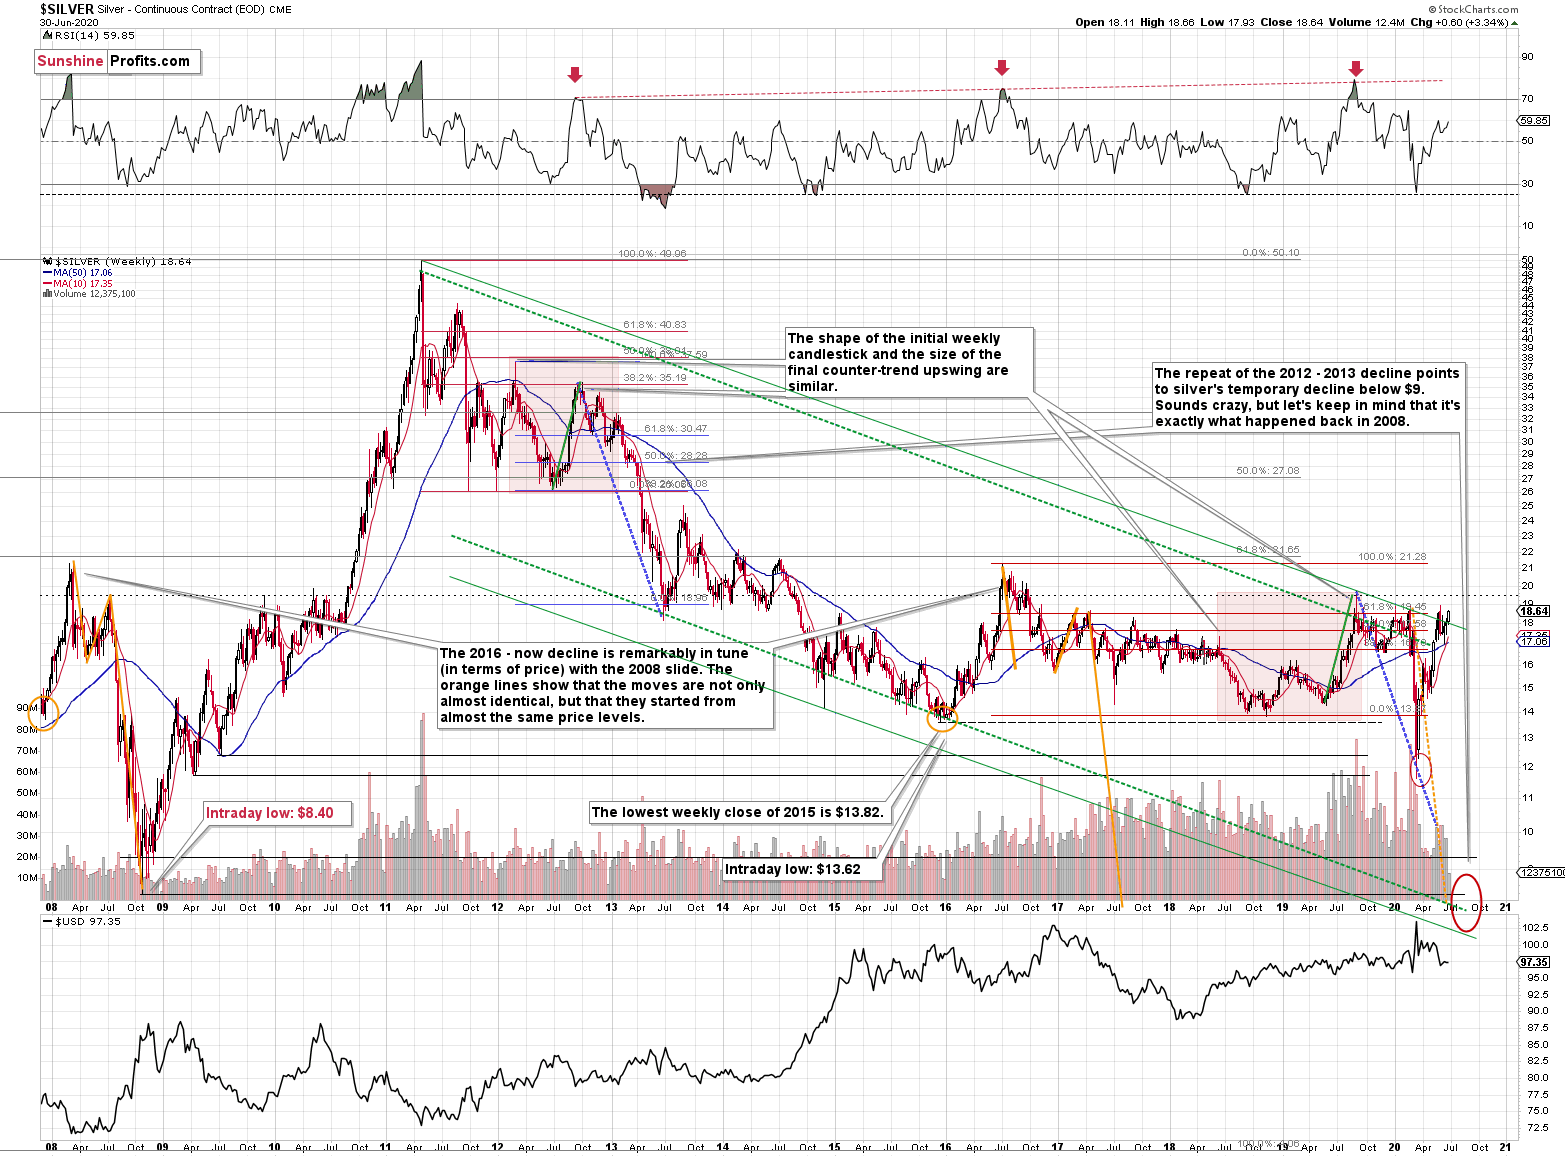
The white metal showed strength as well, rallying almost to the previous 2020 highs. As dramatic as it may sound, please note that silver just a few dollars above its 2015 low and over $30 below its 2011 high. Miners are disappointing too - it is only gold that is stealing the spotlight. And it's doing so on relatively low volume, making its entire "strength" doubtful.
Silver broke above its declining green resistance line... Once again. This line is based on the 2011 high and the 2019 high. There were three previous attempts of the white metal to break above this line and they all failed. Is this time any different? We doubt that, especially given gold's reversal indications.
And in particular, given the rising Covid-19 cases that initially (!) triggered a precious metals sell-off in March. The sell-off started when people started really considering the economic implications of the pandemic and the lockdown, so this kind of thinking is likely to be back once the pandemic prevention mechanisms are going to be re-introduced on a bigger scale.
Summary
Summing up, gold is stealing the spotlight, trying to break above the $1,800 barrier and the November 2011 high, but it's unlikely to be able to confirm this move. Gold did end the previous month and quarter at exceptionally high level, but the monthly volume was low and it was the only part of the precious metals market that showed this kind of strength. Silver is just a few dollars above its 2015 low and over $30 below its 2011 high, while miners are trying to get above their 2016 high - well below their 2011 high. Given the above and gold's looming reversals, I think that a big decline is in the cards for the entire precious metals sector.
After the sell-off (that takes gold below $1,400), we expect the precious metals to rally significantly. The final decline might take as little as 1-3 weeks, so it's important to stay alert to any changes.
Most importantly - stay healthy and safe. We made a lot of money on the March decline and the subsequent rebound (its initial part) price moves (and we'll likely make much more in the following weeks and months), but you have to be healthy to really enjoy the results.
As always, we'll keep you - our subscribers - informed.
To summarize:
Trading capital (supplementary part of the portfolio; our opinion): Full speculative short positions (300% of the full position) in mining stocks is justified from the risk to reward point of view with the following binding exit profit-take price levels:
Senior mining stocks (price levels for the GDX ETF): binding profit-take exit price: $10.32; stop-loss: none (the volatility is too big to justify a SL order in case of this particular trade); binding profit-take level for the DUST ETF: $231.75; stop-loss for the DUST ETF: none (the volatility is too big to justify a SL order in case of this particular trade)
Junior mining stocks (price levels for the GDXJ ETF): binding profit-take exit price: $9.57; stop-loss: none (the volatility is too big to justify a SL order in case of this particular trade); binding profit-take level for the JDST ETF: $284.25; stop-loss for the JDST ETF: none (the volatility is too big to justify a SL order in case of this particular trade)
For-your-information targets (our opinion; we continue to think that mining stocks are the preferred way of taking advantage of the upcoming price move, but if for whatever reason one wants / has to use silver or gold for this trade, we are providing the details anyway. In our view, silver has greater potential than gold does):
Silver futures downside profit-take exit price: $8.58 (the downside potential for silver is significant, but likely not as big as the one in the mining stocks)
Gold futures downside profit-take exit price: $1,382 (the target for gold is least clear; it might drop to even $1,170 or so; the downside potential for gold is significant, but likely not as big as the one in the mining stocks or silver)
Long-term capital (core part of the portfolio; our opinion): No positions (in other words: cash
Insurance capital (core part of the portfolio; our opinion): Full position
Whether you already subscribed or not, we encourage you to find out how to make the most of our alerts and read our replies to the most common alert-and-gold-trading-related-questions.
Please note that the in the trading section we describe the situation for the day that the alert is posted. In other words, it we are writing about a speculative position, it means that it is up-to-date on the day it was posted. We are also featuring the initial target prices, so that you can decide whether keeping a position on a given day is something that is in tune with your approach (some moves are too small for medium-term traders and some might appear too big for day-traders).
Plus, you might want to read why our stop-loss orders are usually relatively far from the current price.
Please note that a full position doesn't mean using all of the capital for a given trade. You will find details on our thoughts on gold portfolio structuring in the Key Insights section on our website.
As a reminder - "initial target price" means exactly that - an "initial" one, it's not a price level at which we suggest closing positions. If this becomes the case (like it did in the previous trade) we will refer to these levels as levels of exit orders (exactly as we've done previously). Stop-loss levels, however, are naturally not "initial", but something that, in our opinion, might be entered as an order.
Since it is impossible to synchronize target prices and stop-loss levels for all the ETFs and ETNs with the main markets that we provide these levels for (gold, silver and mining stocks - the GDX ETF), the stop-loss levels and target prices for other ETNs and ETF (among other: UGLD, DGLD, USLV, DSLV, NUGT, DUST, JNUG, JDST) are provided as supplementary, and not as "final". This means that if a stop-loss or a target level is reached for any of the "additional instruments" (DGLD for instance), but not for the "main instrument" (gold in this case), we will view positions in both gold and DGLD as still open and the stop-loss for DGLD would have to be moved lower. On the other hand, if gold moves to a stop-loss level but DGLD doesn't, then we will view both positions (in gold and DGLD) as closed. In other words, since it's not possible to be 100% certain that each related instrument moves to a given level when the underlying instrument does, we can't provide levels that would be binding. The levels that we do provide are our best estimate of the levels that will correspond to the levels in the underlying assets, but it will be the underlying assets that one will need to focus on regarding the signs pointing to closing a given position or keeping it open. We might adjust the levels in the "additional instruments" without adjusting the levels in the "main instruments", which will simply mean that we have improved our estimation of these levels, not that we changed our outlook on the markets. We are already working on a tool that would update these levels on a daily basis for the most popular ETFs, ETNs and individual mining stocks.
Our preferred ways to invest in and to trade gold along with the reasoning can be found in the how to buy gold section. Additionally, our preferred ETFs and ETNs can be found in our Gold & Silver ETF Ranking.
As a reminder, Gold & Silver Trading Alerts are posted before or on each trading day (we usually post them before the opening bell, but we don't promise doing that each day). If there's anything urgent, we will send you an additional small alert before posting the main one.
Thank you.
Sincerely,
Przemyslaw Radomski, CFA
Editor-in-chief, Gold & Silver Fund Manager

