

Briefly: In our opinion, full (200% of the regular size of the position) speculative short positions in gold, silver and mining stocks are justified from the risk/reward perspective at the moment of publishing this alert.
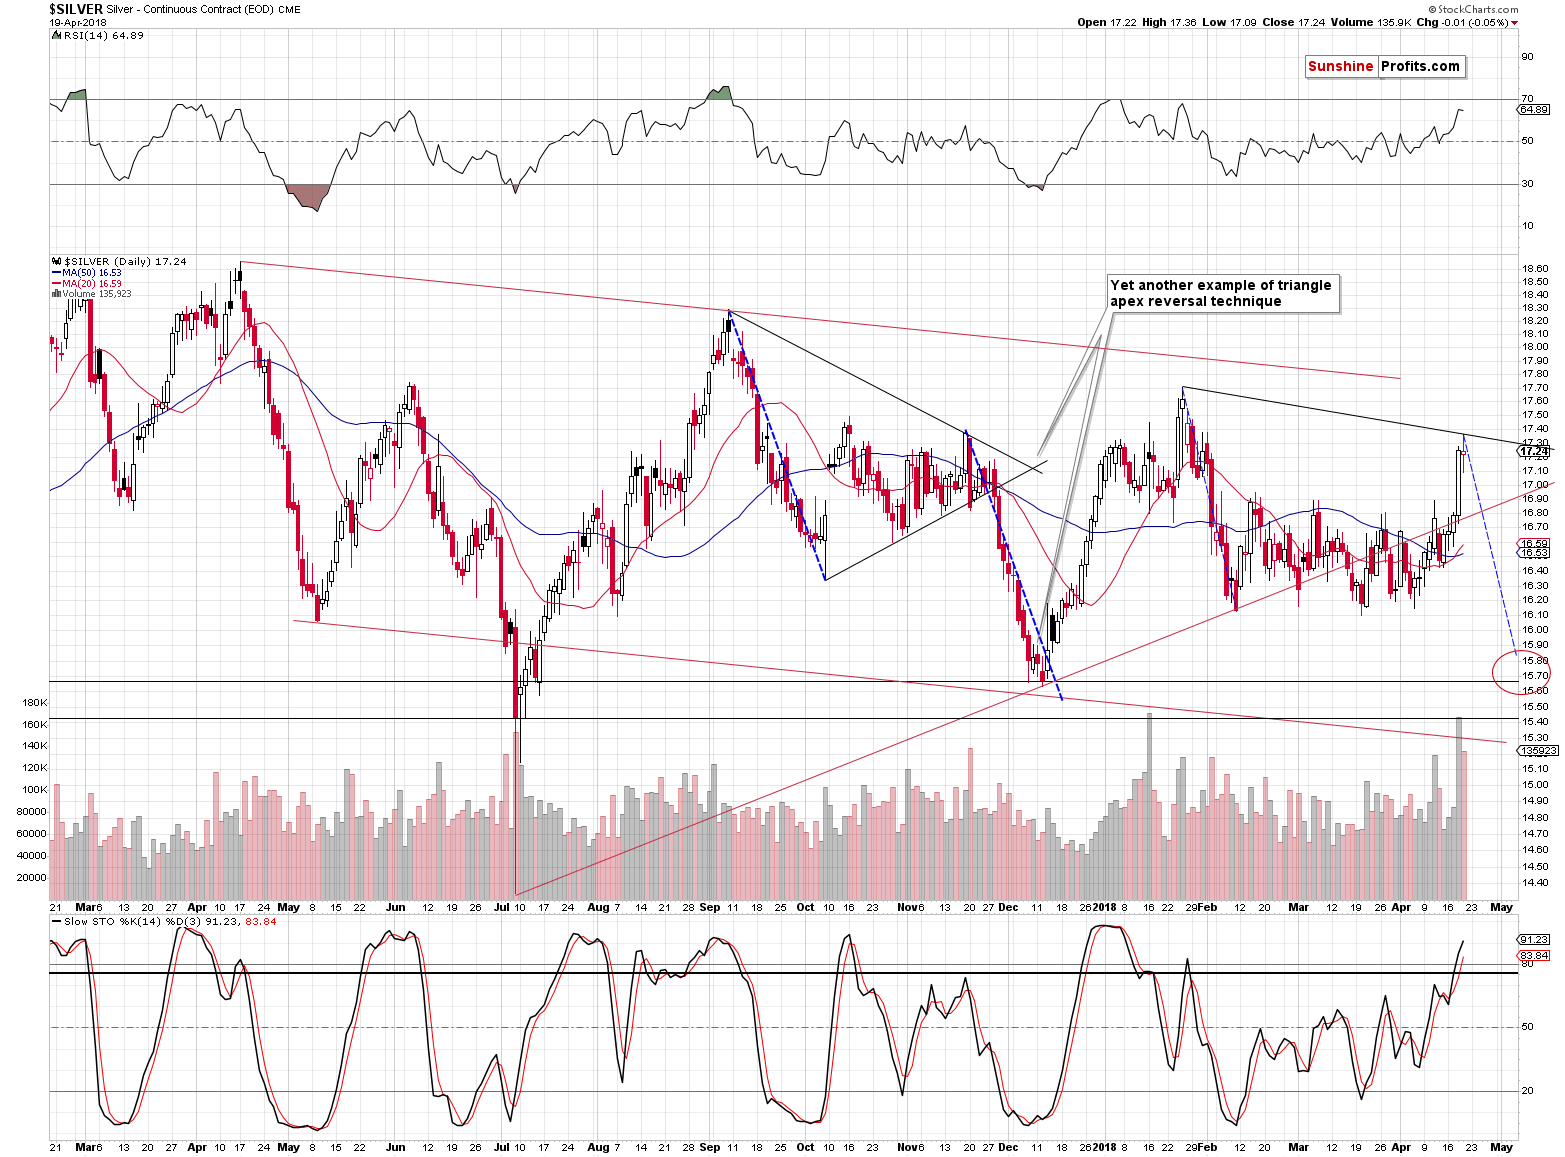
The USD Index finally rallied yesterday, confirming this week’s apex-based reversal and one would expect the precious metals sector to decline in such a case. But it didn’t. In fact, silver moved even higher. How bullish was yesterday’s strength in the precious metals sector?
Barely. Precious metals and mining stocks are known to lag the signs from the USD from time to time and it might have been the case yesterday. At first sight, the daily strength of the PM sector is bullish, but it’s much too early to say so. Let’s take a look at the charts for details, starting with the relative performance of the metals and miners.
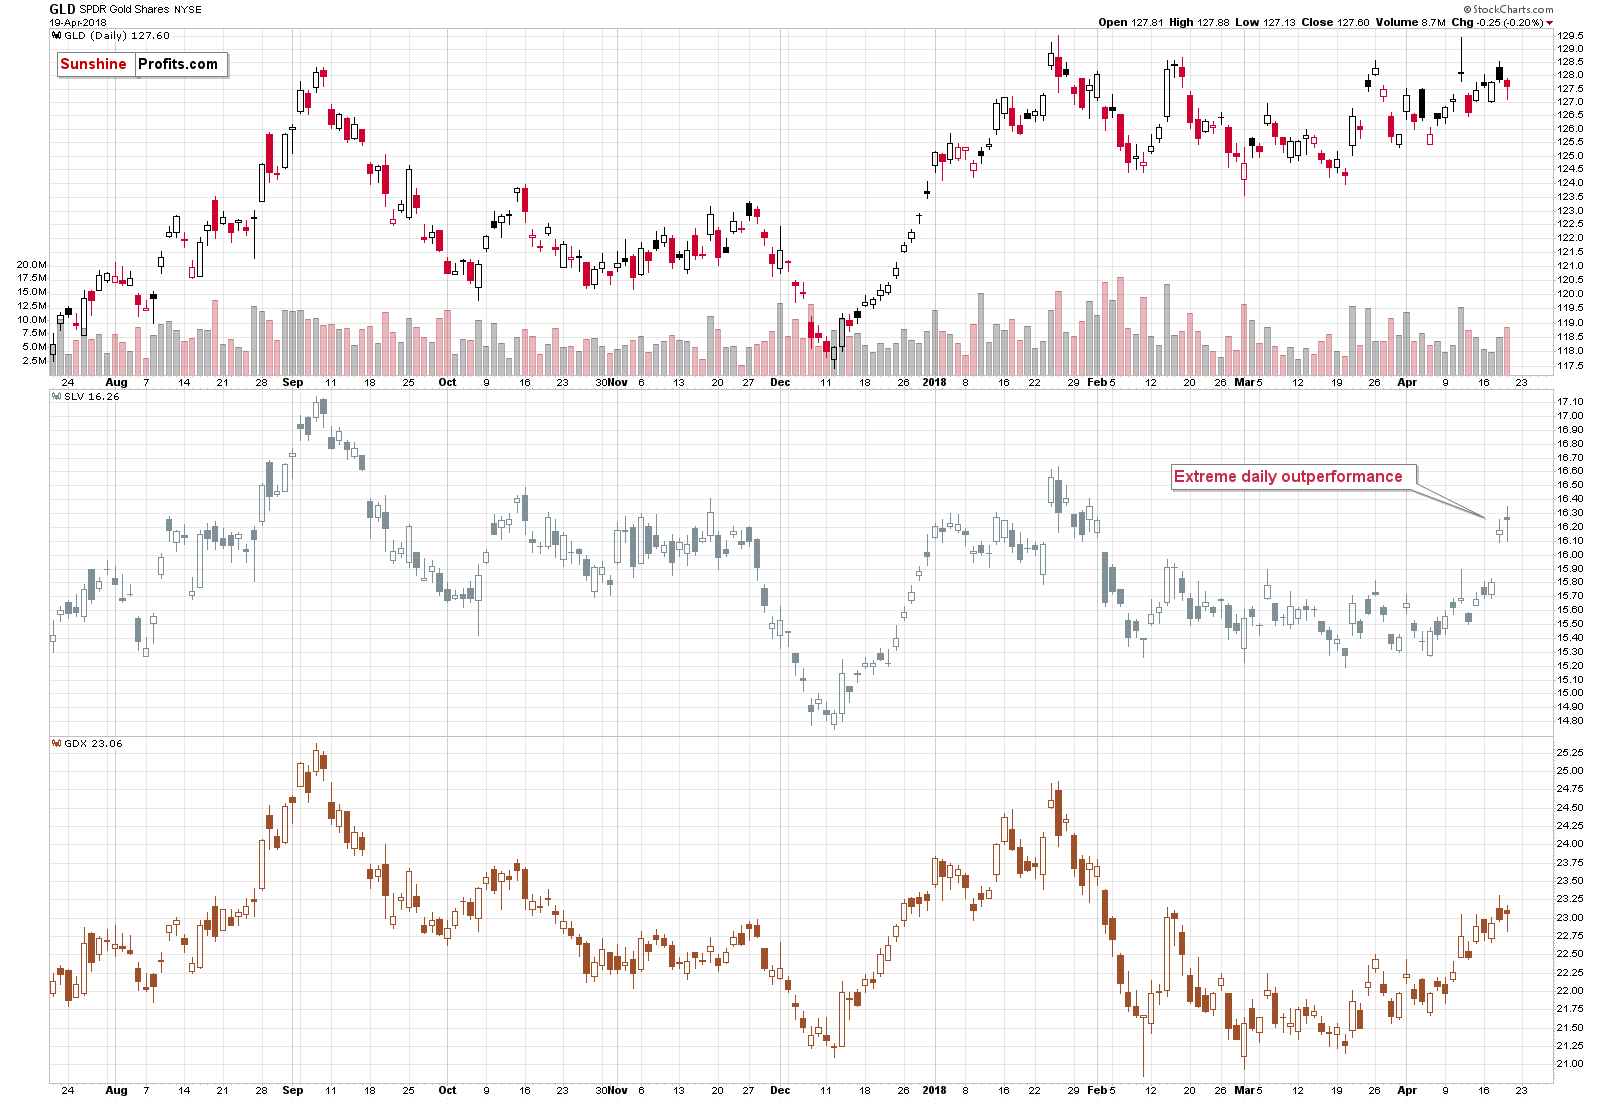
Silver’s Outperformance Continues
In yesterday’s alert, we wrote the following on the above chart:
It’s clear at the first sight that the price of silver outperformed gold to a huge extent. It wasn’t driven by higher stock prices or rising gold. Mining stocks rallied only initially and they reversed the upswing before the end of the session. Silver truly outperformed. We emphasized it numerous times and we’ll say it once again – whenever silver outperforms on a very short-term basis, it’s a very bearish sign for the following days and weeks. Not necessarily for the single session that immediately follows, though, as some buy orders that were placed after hours could still be realized on the following day and this could attract additional momentum buyers.
Still, that’s the kind of performance that is a very bearish sign that should make one at least consider opening short positions in the precious metals sector, not closing them or opening long ones.
The most short-term cases when the above signal worked are not visible in the ratios as the latter are based on daily closing prices and the intraday extremes are not factored in properly. Precisely, using candlesticks will provide us with intraday highs, but if the highs formed at different times of the day, they will not be comparable.
Silver has indeed outperformed once again, but this time to a smaller extent. That’s in tune with the previous cases and the above fragment that we put in bold. In other words, silver’s outperformance simply confirms the bearish case.
In yesterday’s alert, we also wrote the following:
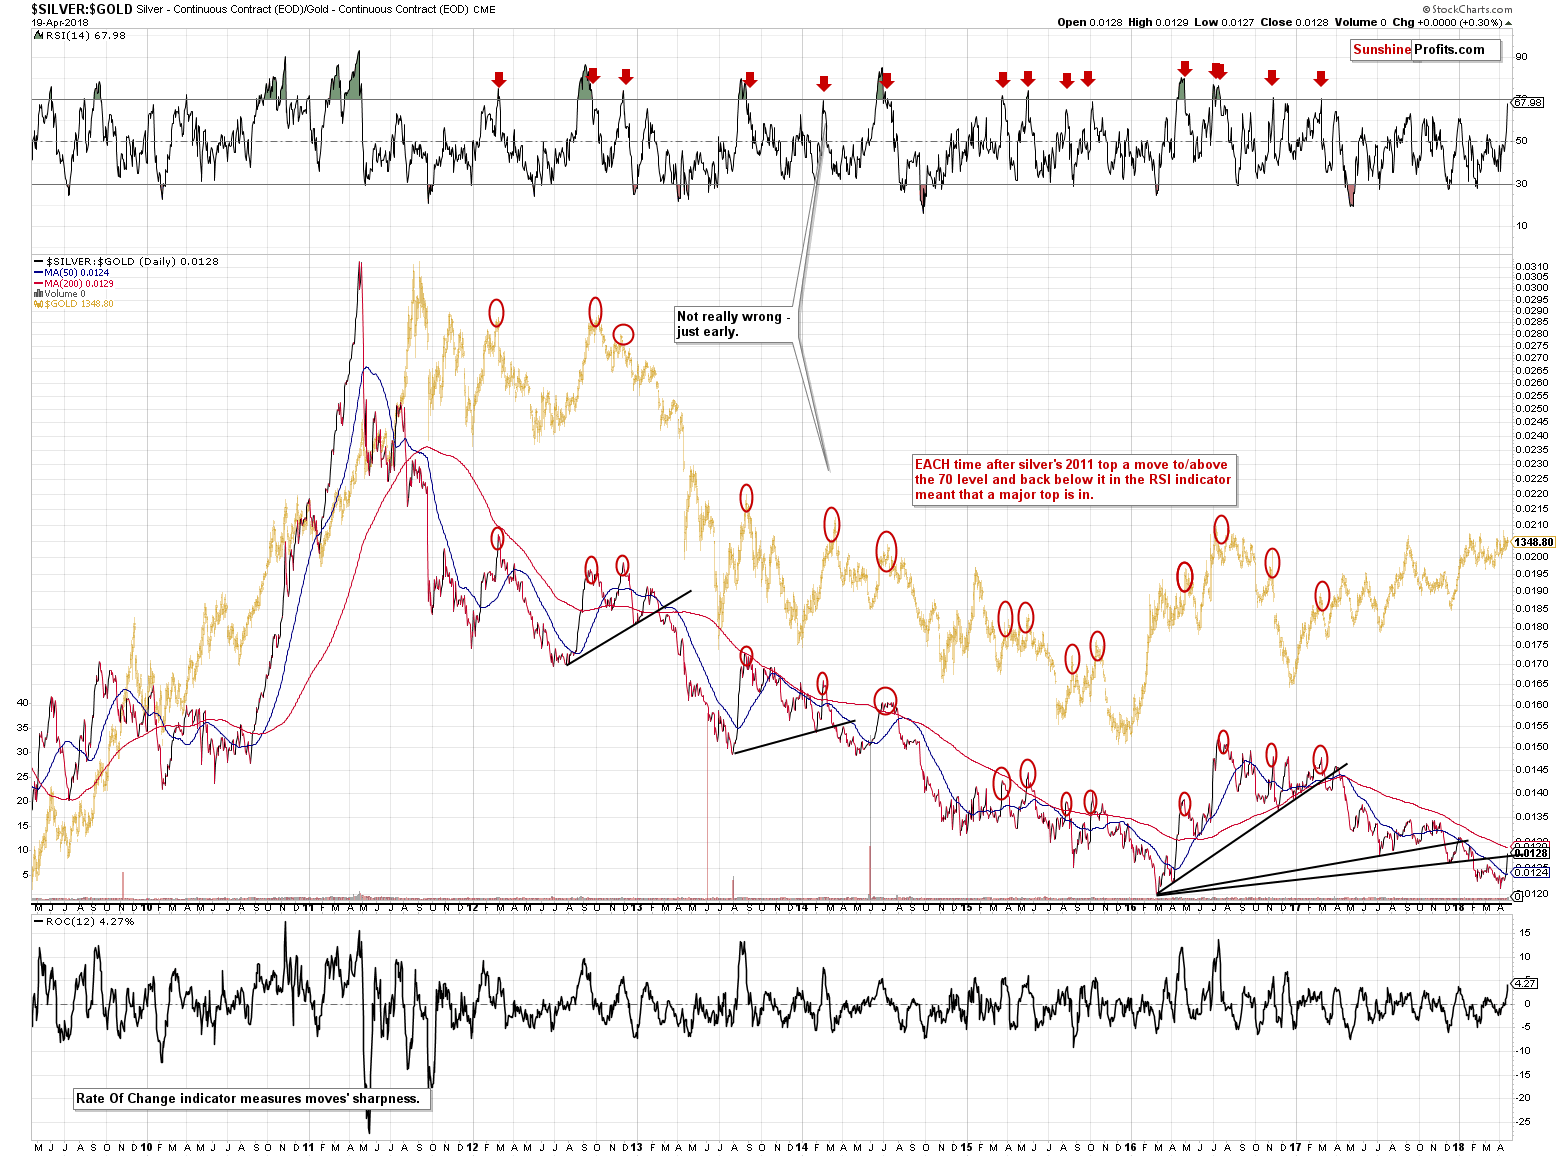
The silver to gold ratio shows that the ratio moved back to the rising black resistance line which it broke earlier this year. That’s the third time that that we’ve seen something like that in the recent history. Each breakdown below the rising black line was followed by a correction back to this line. Then the ratio moved lower once again.
That’s not the most important thing about the silver to gold ratio, though. The most important thing is that the RSI based on it moved very close to the 70 level and whenever the RSI gets above it and then declines, we see a major decline in the precious metals sector. To be clear, there are no certainties in any market, but please look at the areas marked on the above chart for details.
Now, the RSI is only at 66.84, not above 70, but let’s keep in mind that there were cases when the RSI didn’t move to 70 and we saw tops in its proximity. For instance, the early 2013 top and the late 2015 top.
This means that the precious metals sector could slide right away, but if silver outperforms just a bit more today (taking RSI above 70) and then declines in the following days, we’ll have a major and extremely effective confirmation that the final top is in.
Silver has indeed outperformed once again yesterday, but the outperformance in terms of the daily closing prices wasn’t significant enough to push the RSI above 70. It moved to 67.98, though, so it’s much closer to the key 70 barrier. It seems close enough to say that if we saw a sizable downswing in silver and in the ratio here, it would serve as a very strong confirmation that the final top is indeed in from the medium-term perspective.
Silver is declining so far today, so we could be seeing the start of the above.
More Extreme Than Price of Silver
The move in the price of silver was sizable, but the thing that’s even more extreme is the size of the volume. The volume was huge not only during Wednesday’s upswing, but also during yesterday’s session.
In yesterday’s alert we already emphasized the meaning of the above, and the fact that the volume was once again very significant confirms these comments:
This suggests two things. One is that the white metal might have been bought en masse by the investment public, and the second is that there might have been major shifts in the futures contracts’ ownership. Both could indicate a major turnaround.
Moreover, huge volume confirms the extreme nature of this situation – that’s exactly what we want to see as a confirmation of a key top. And it seems that we have just seen one.
Gold’s Performance After Reversal Week
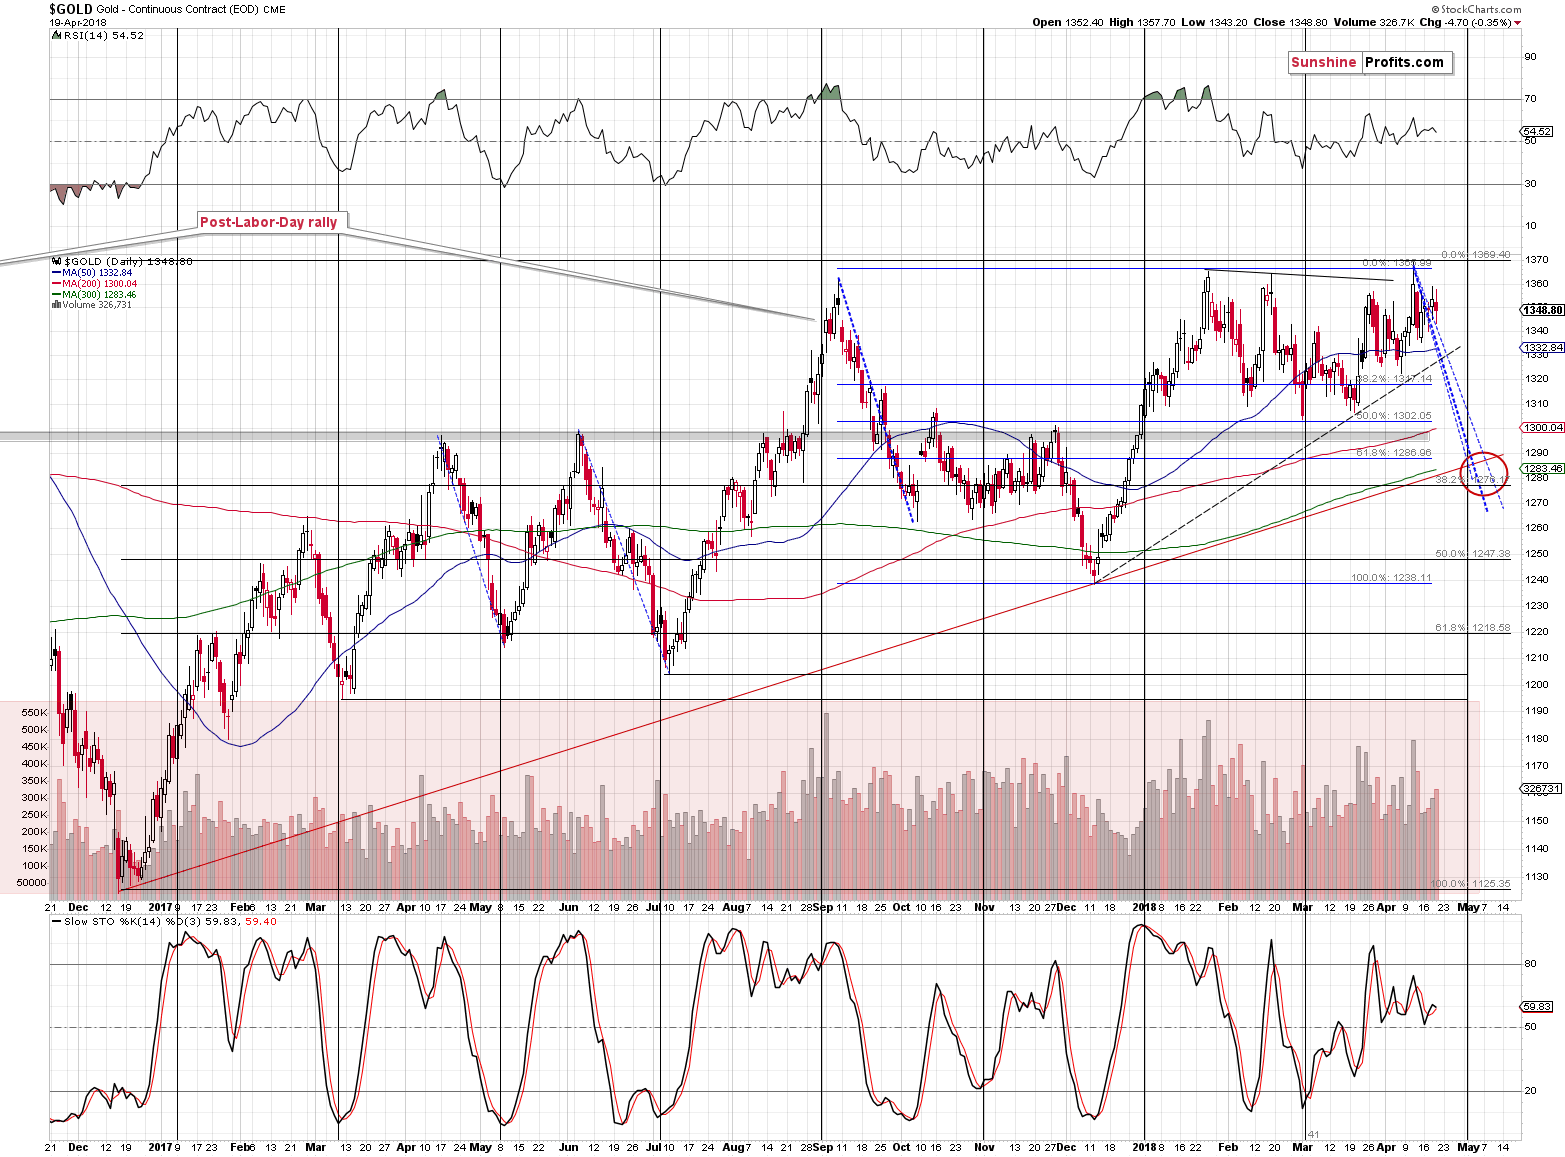
As far as gold’s performance is concerned, nothing really happened yesterday. At the moment of writing these words, gold is trading at about $1,340, which means that it’s already about $30 below the intraday high that it posted during the reversal week (based on the combination of triangle-apex-based reversals). Gold is still likely to decline based on multiple factors, including last week’s reversal.
Mining Stocks’ Reversal
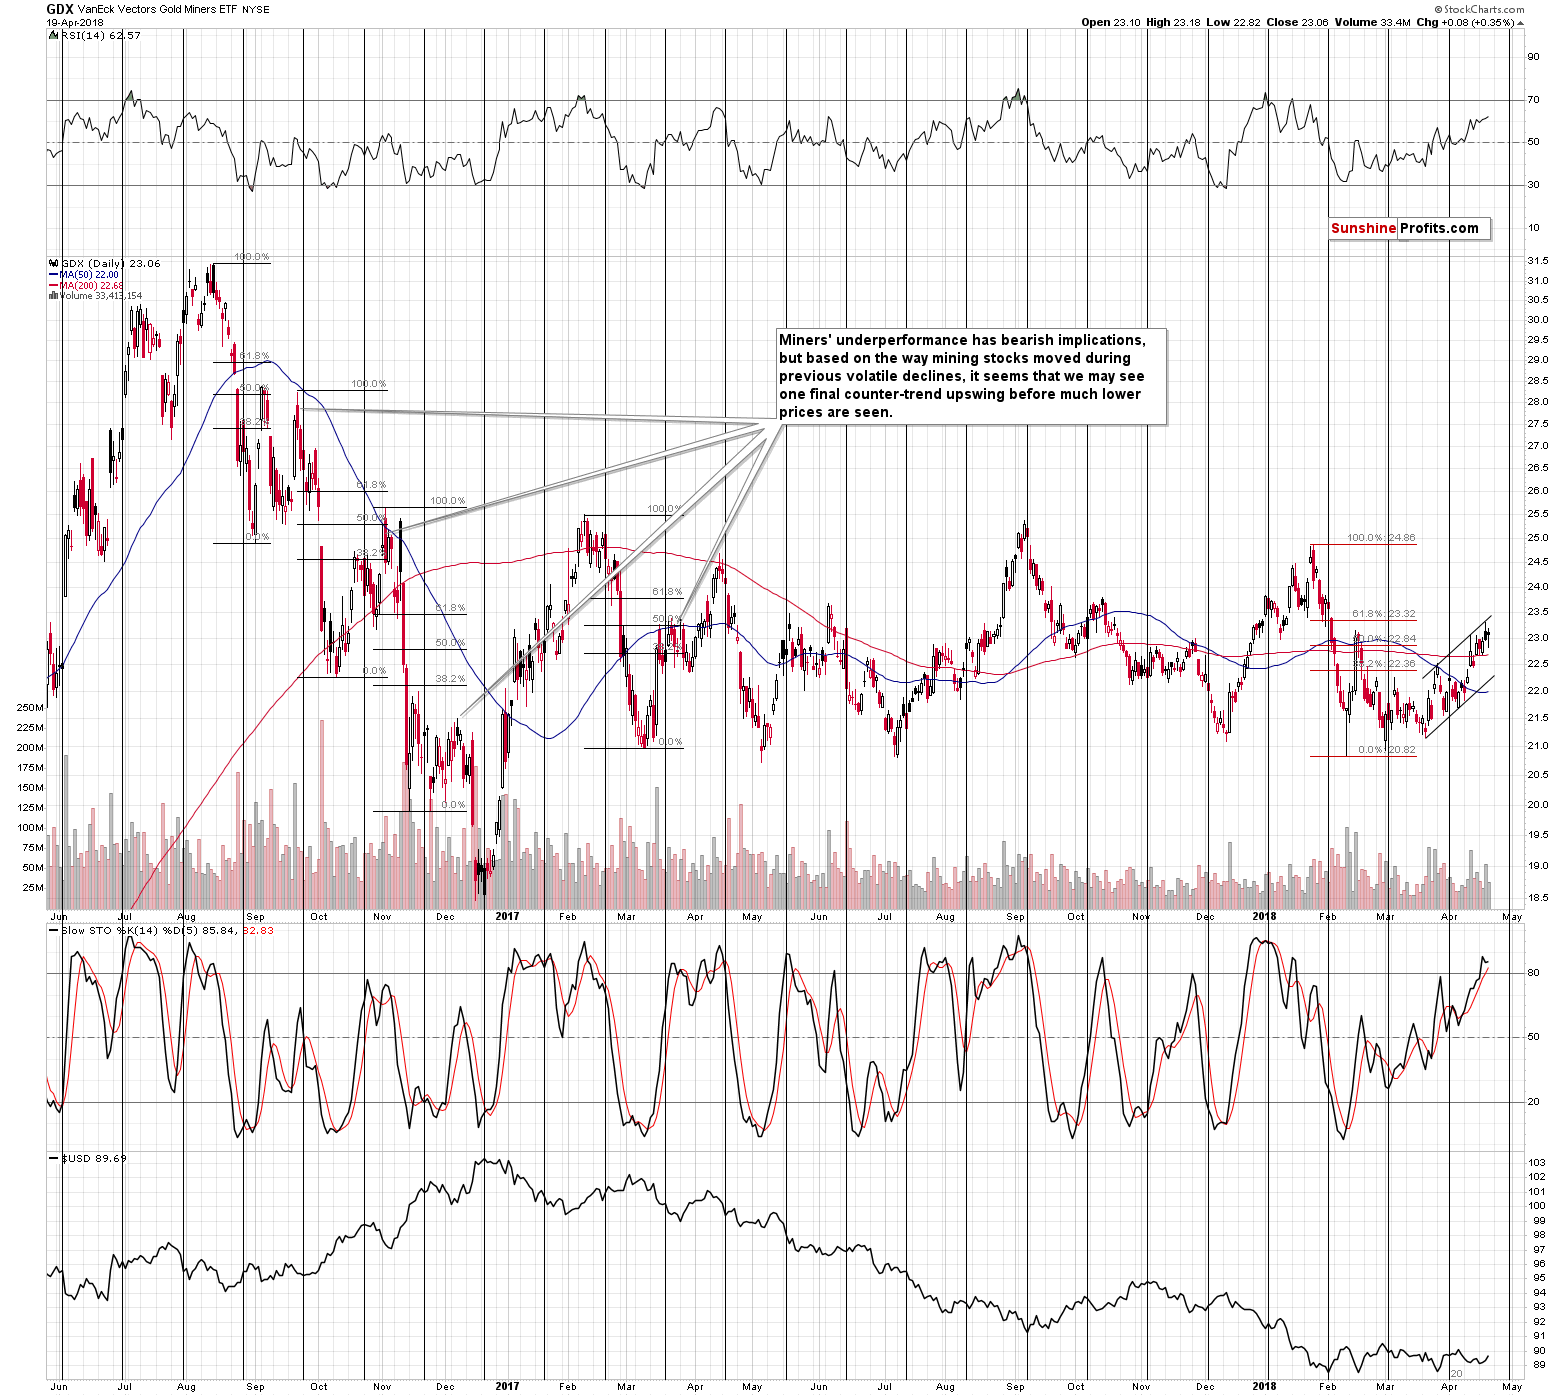
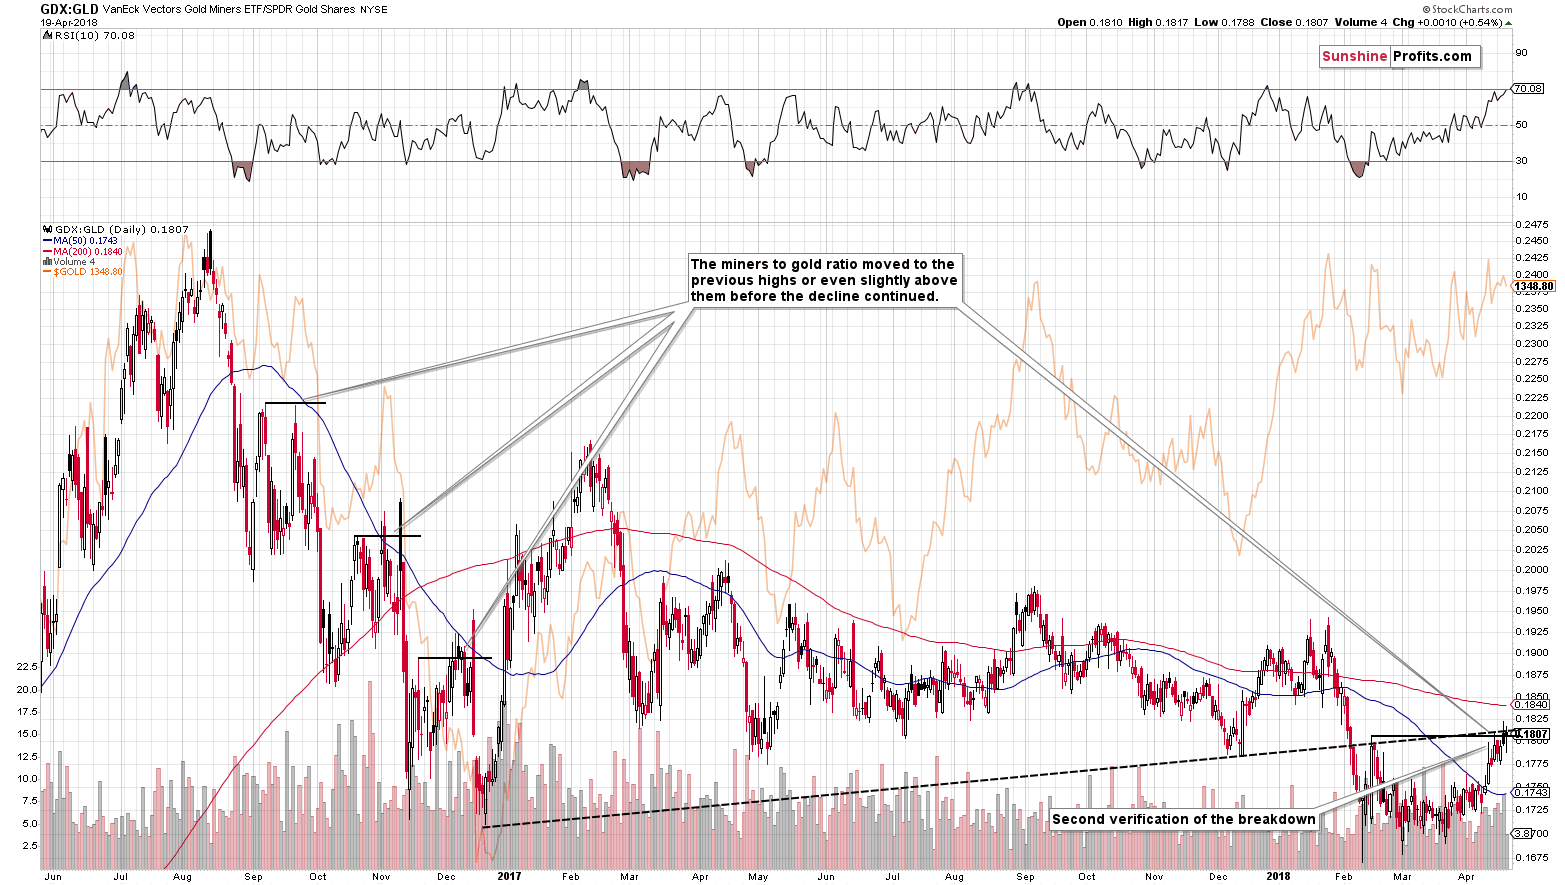
Mining stocks didn’t do much yesterday in terms of both the USD (regular price) and gold (GDX:GLD ratio).
Well, technically, GDX broke above the February high, but it closed just $0.05 above it. The breakout is so small that it would require a meaningful confirmation to really matter. A confirmation that GDX will likely not get based on today’s pre-market move lower in gold.
The outlook, therefore, remains bearish.
But is there anything that will make the mining stocks decline shortly instead of moving back and forth for many days?
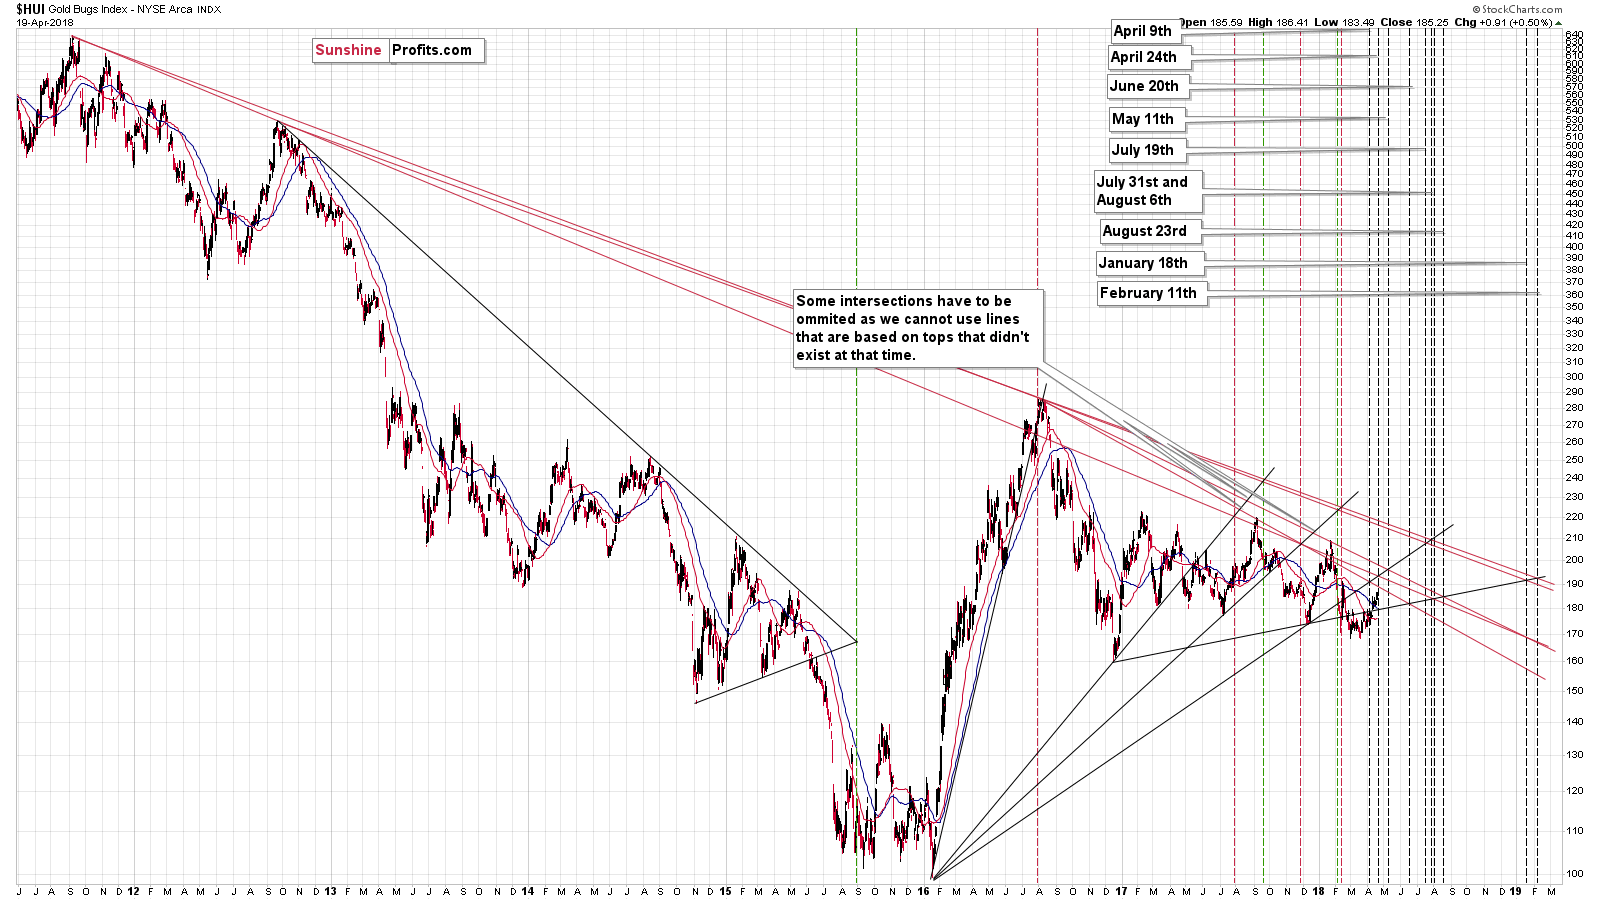
The next triangle-apex-based reversal is on Tuesday and since it turned out that the proximity of these dates can serve as a trigger for reversals, miners are already in the high-risk territory. Consequently, we are likely to see a big decline shortly.
Forex: Reversal and Breakdown
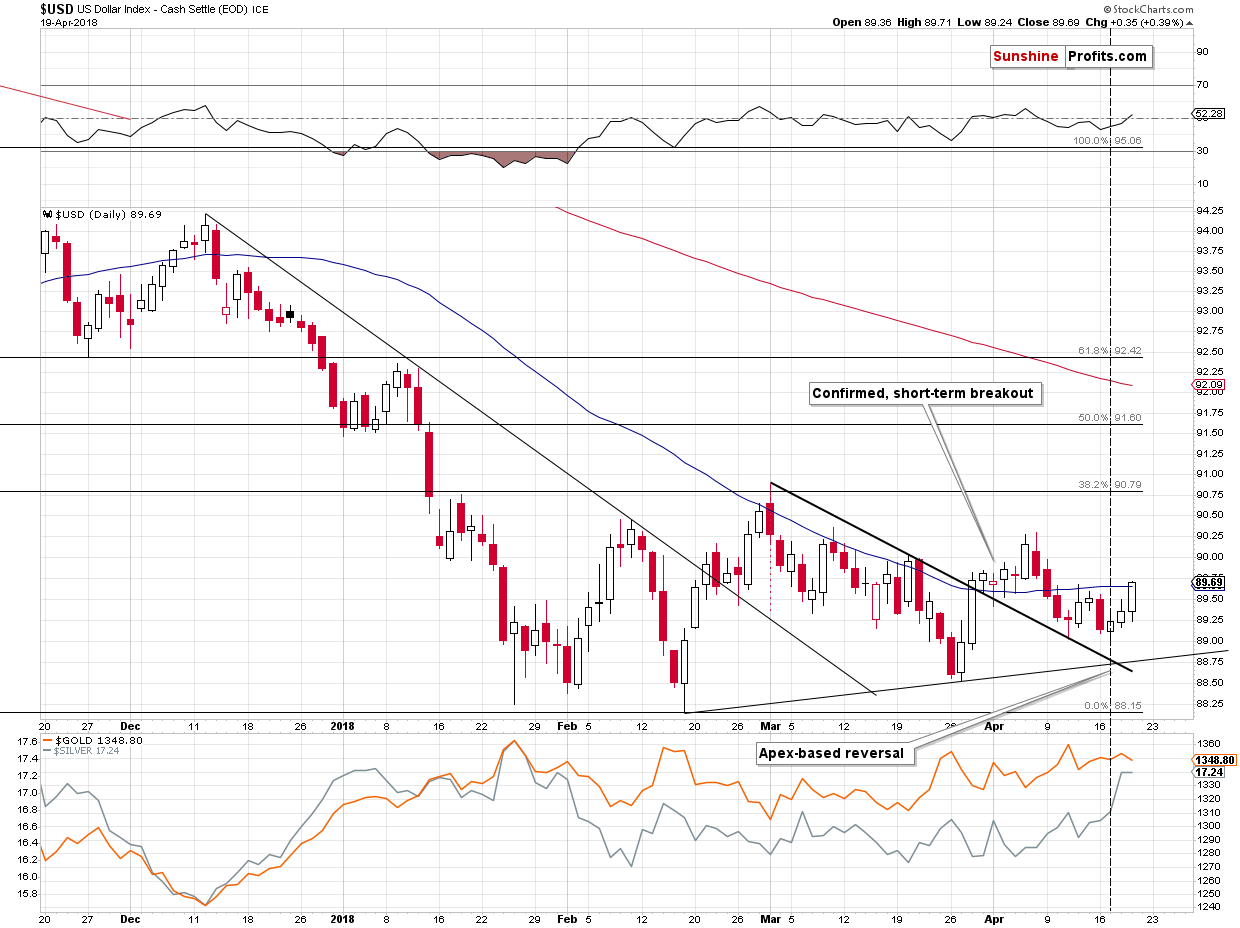
In the previous alerts, we wrote that the USD Index was likely to reverse based on the apex of the triangle that we marked with black lines.
It seems that we indeed saw a reversal as the USD moved higher at the reversal day and for two additional days.
This has profound implications for the following weeks and months.
Weeks, because a bigger rally in the USD Index is likely to translate into at least a visible decline in the EUR/USD.
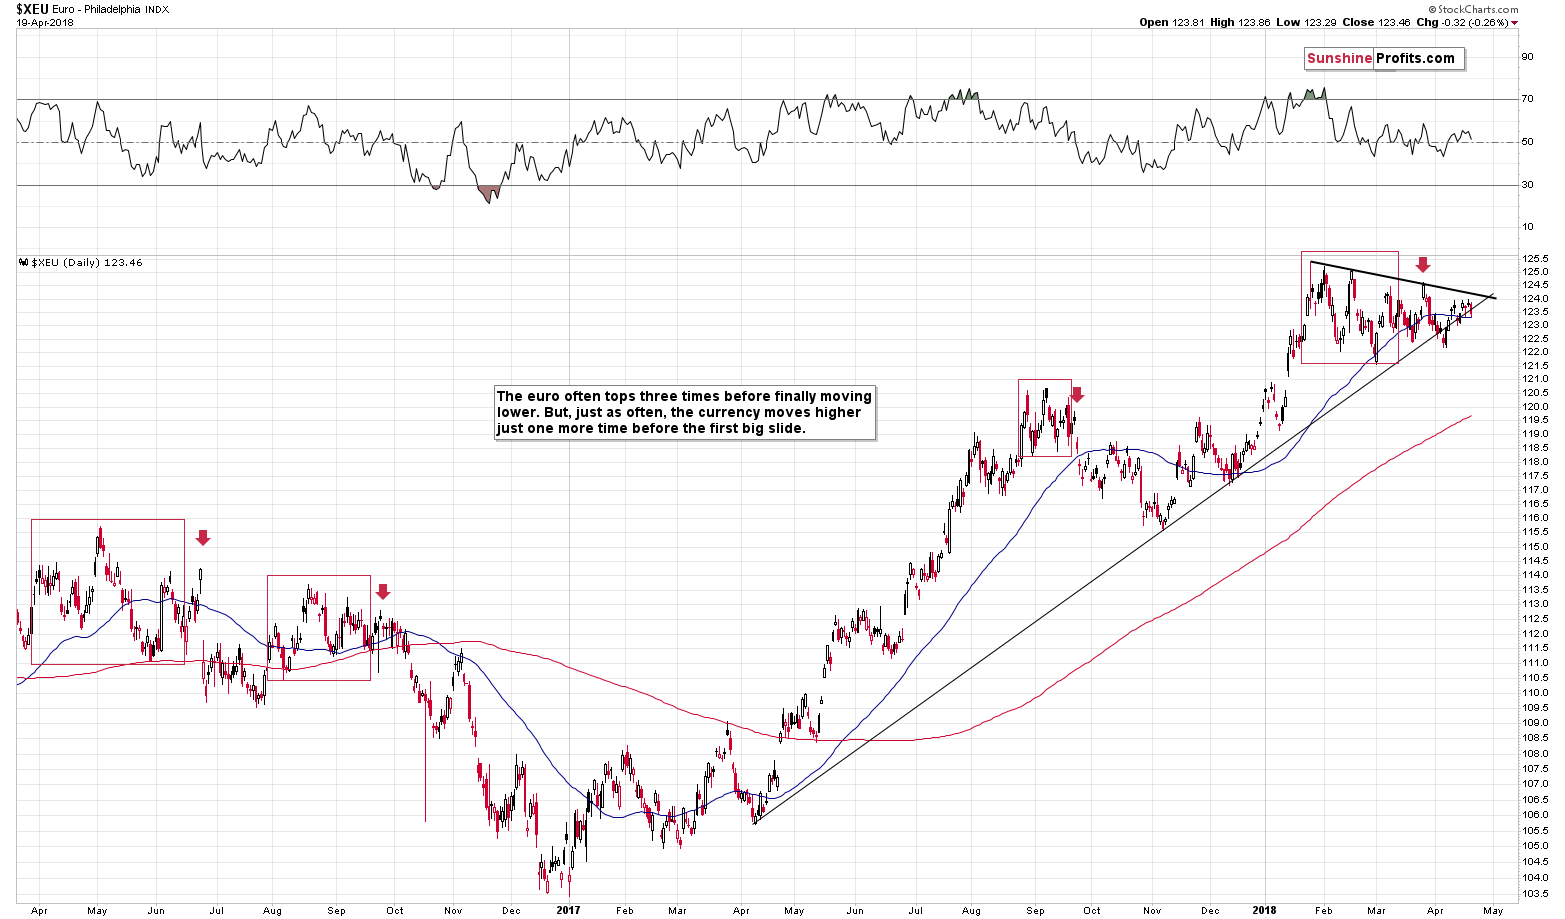
We previously wrote the following:
That’s important, because the euro is on the verge of a breakdown. Looking at the above chart alone it’s not clear if we’re going to see a breakout or breakdown, but keeping the USDX picture in mind, a breakdown is much more likely. A breakdown below the medium-term support line would be an important development, so the follow-up action would likely be significant. Especially that the euro has been consolidating for more than 2 months. The last time we saw something similar was between late August 2016 and early October 2016. The decline that followed was the biggest that we saw in recent history.
(…) please note that the apex of the triangle in the euro is at the end of the month. That’s a perfect confirmation of the targets that we have for gold and silver based on the shapes of the previous declines, support lines, and gold’s cyclical turning point.
The implications for the precious metals market are bearish.
We indeed saw a breakdown in yesterday’s session. It was not significant, and it will definitely need to be confirmed before there are significant bearish implications, but given the clear reversal in the USD, it seems that the dam is broken for the euro and it’s now only a matter of time before the slide accelerates, taking precious metals with it.
Summary
Summing up, silver’s huge volume, rally, and even bigger outperformance of gold and mining stocks is a major bearish confirmation, not something bullish. The reversal that we’ve already seen in the case of the USD Index points to higher USD values, lower EUR/USD values and lower precious metals prices, especially that the euro has already broken below its rising medium-term support line. The precious metals investors and traders don’t believe in the USD Index’s strength yet, but once the euro slides, they are likely to realize that the short-term trend changed and then the PM sector is likely to catch up by declining significantly.
Thank you for understanding how the markets work (especially the silver market) - it seems very likely that our patience will be well rewarded.
As always, we will keep you – our subscribers – informed.
To summarize:
Trading capital (supplementary part of the portfolio; our opinion): Full short positions (200% of the full position) in gold, silver and mining stocks are justified from the risk/reward perspective with the following stop-loss orders and initial target price levels:
- Gold: initial target price: $1,218; stop-loss: $1,382; initial target price for the DGLD ETN: $53.98; stop-loss for the DGLD ETN $37.68
- Silver: initial target price: $14.63; stop-loss: $18.06; initial target price for the DSLV ETN: $33.88; stop-loss for the DSLV ETN $19.27
- Mining stocks (price levels for the GDX ETF): initial target price: $19.22; stop-loss: $23.54; initial target price for the DUST ETF: $39.88; stop-loss for the DUST ETF $21.46
In case one wants to bet on junior mining stocks' prices (we do not suggest doing so – we think senior mining stocks are more predictable in the case of short-term trades – if one wants to do it anyway, we provide the details), here are the stop-loss details and initial target prices:
- GDXJ ETF: initial target price: $27.82; stop-loss: $36.14
- JDST ETF: initial target price: $94.88 stop-loss: $41.86
Long-term capital (core part of the portfolio; our opinion): No positions (in other words: cash)
Insurance capital (core part of the portfolio; our opinion): Full position
Important Details for New Subscribers
Whether you already subscribed or not, we encourage you to find out how to make the most of our alerts and read our replies to the most common alert-and-gold-trading-related-questions.
Please note that the in the trading section we describe the situation for the day that the alert is posted. In other words, it we are writing about a speculative position, it means that it is up-to-date on the day it was posted. We are also featuring the initial target prices, so that you can decide whether keeping a position on a given day is something that is in tune with your approach (some moves are too small for medium-term traders and some might appear too big for day-traders).
Plus, you might want to read why our stop-loss orders are usually relatively far from the current price.
Please note that a full position doesn’t mean using all of the capital for a given trade. You will find details on our thoughts on gold portfolio structuring in the Key Insights section on our website.
As a reminder – “initial target price” means exactly that – an “initial” one, it’s not a price level at which we suggest closing positions. If this becomes the case (like it did in the previous trade) we will refer to these levels as levels of exit orders (exactly as we’ve done previously). Stop-loss levels, however, are naturally not “initial”, but something that, in our opinion, might be entered as an order.
Since it is impossible to synchronize target prices and stop-loss levels for all the ETFs and ETNs with the main markets that we provide these levels for (gold, silver and mining stocks – the GDX ETF), the stop-loss levels and target prices for other ETNs and ETF (among other: UGLD, DGLD, USLV, DSLV, NUGT, DUST, JNUG, JDST) are provided as supplementary, and not as “final”. This means that if a stop-loss or a target level is reached for any of the “additional instruments” (DGLD for instance), but not for the “main instrument” (gold in this case), we will view positions in both gold and DGLD as still open and the stop-loss for DGLD would have to be moved lower. On the other hand, if gold moves to a stop-loss level but DGLD doesn’t, then we will view both positions (in gold and DGLD) as closed. In other words, since it’s not possible to be 100% certain that each related instrument moves to a given level when the underlying instrument does, we can’t provide levels that would be binding. The levels that we do provide are our best estimate of the levels that will correspond to the levels in the underlying assets, but it will be the underlying assets that one will need to focus on regarding the signs pointing to closing a given position or keeping it open. We might adjust the levels in the “additional instruments” without adjusting the levels in the “main instruments”, which will simply mean that we have improved our estimation of these levels, not that we changed our outlook on the markets. We are already working on a tool that would update these levels on a daily basis for the most popular ETFs, ETNs and individual mining stocks.
Our preferred ways to invest in and to trade gold along with the reasoning can be found in the how to buy gold section. Additionally, our preferred ETFs and ETNs can be found in our Gold & Silver ETF Ranking.
As a reminder, Gold & Silver Trading Alerts are posted before or on each trading day (we usually post them before the opening bell, but we don't promise doing that each day). If there's anything urgent, we will send you an additional small alert before posting the main one.
=====
Hand-picked precious-metals-related links:
PRECIOUS-Gold slips as U.S. rate rise hopes, easing global tensions weigh
Nevada gold mine grows production by 130%
Strike halts gold output at two Randgold mines in Mali — union
=====
In other news:
Global stocks set for second week of gains, commodities ease
Fed Will Accept a Recession Before It Allows High Inflation
New York Fed chief sees two risks ahead for interest rate policy
Japan's cryptocurrency exchanges need tighter rules: Monex CEO
Oil stocks face crucial earnings test as investors venture back in
Bitcoin 'miners' are losing money at any price below $8,600: Morgan Stanley
Mt. Gox and the Surprising Redemption of Bitcoin’s Biggest Villain
=====
Thank you.
Sincerely,
Przemyslaw Radomski, CFA
Founder, Editor-in-chief, Gold & Silver Fund Manager
Gold & Silver Trading Alerts
Forex Trading Alerts
Oil Investment Updates
Oil Trading Alerts

