

Briefly: in our opinion, full (300% of the regular position size) speculative short positions in junior mining stocks are justified from the risk/reward point of view at the moment of publishing this Alert.
Omicron gave gold a boost, but business confidence remains high for the next twelve months, which means the USD’s prospects look good, and precious metals will eventually have to find new low ground.
Despite the USD Index’s recent pullback, the PMs’ performance on Feb. 2 was rather pedestrian. For example, gold and silver rallied by 0.49% and 0.50%, respectively, while the GDX ETF rose by 0.33%. However, the GDXJ ETF declined by 0.41% and hasn’t been able to gain any real traction. Moreover, when we consider the USD Index’s recent decline, the PMs should have rallied more. And since they didn’t, it signals investors’ heightened anxiety. As a result, it’s likely another case of corrective upswings within medium-term downtrends.
Having said that, let's take a look at the situation from a fundamental point of view.
Inflated Optimism
As the PMs attempt to recover their post-Fed losses, their misguided confidence could result in hard landings. Similarly, with investors assuming that the USD Index's best days are in the rearview, it's like it's 2021 all over again.
To explain, with the Omicron variant depressing U.S. economic activity, the 'bad news is good news' narrative has spread across Wall Street. For context, the phrase assumes that weak economic data will lead to a more dovish Fed. And with the Atlanta Fed predicting Q1 real GDP growth of only 0.1%, investors believe that potential Fed patience means a weaker USD Index and higher precious metals prices.
Please see below:
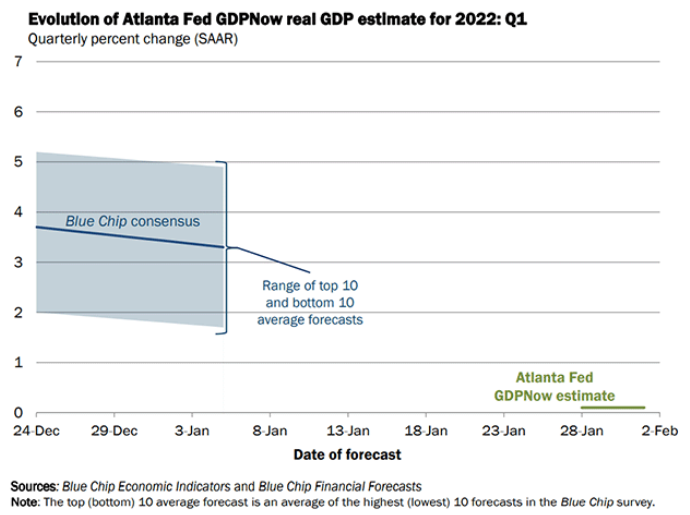
To explain, the blue line above tracks the Blue Chip (large investment firms') consensus Q1 GDP growth estimate, while the green line above tracks the Atlanta Fed's Q1 GDP growth estimate. If you analyze the near-flatline, you can see that the Atlanta Fed predicts next to no growth in Q1.
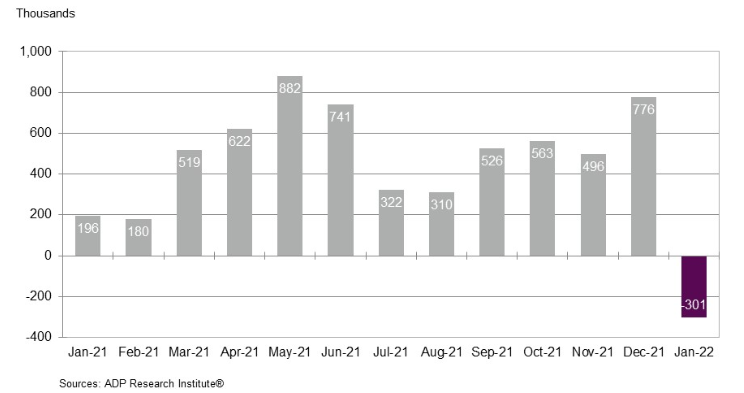
Second, ADP released its National Employment Report on Feb. 2. And with private payrolls declining by 301,000 in January (the purple bar on the right side of the chart below), ADP Chief Economist Nela Richardson said that "the labor market recovery took a step back at the start of 2022 due to the effect of the Omicron variant and its significant, though likely temporary, impact to job growth."
In addition, "leisure and hospitality saw the largest setback after substantial gains in fourth quarter 2021, while small businesses were hit hardest by losses, erasing most of the job gains made in December 2021." As a result, with economically sensitive sectors suffering the brunt of the Omicron variant's wrath, the 'bad news is good news' narrative has investors positioning for a more dovish Fed.
Please see below:
However, the short-term setback doesn’t change the medium-term implications. For example, IHS Markit released its U.S. Manufacturing PMI on Feb. 1. And after the headline index declined from 57.7 in December to 55.5 in January, Chris Williamson, Chief Business Economist at IHS Markit, said:
“The Omicron outbreak has hit manufacturing hard, exacerbating existing headwinds by subduing demand, creating further supply chain issues and causing widespread staff shortages, often through absenteeism due to the surge in COVID-19 infections.”
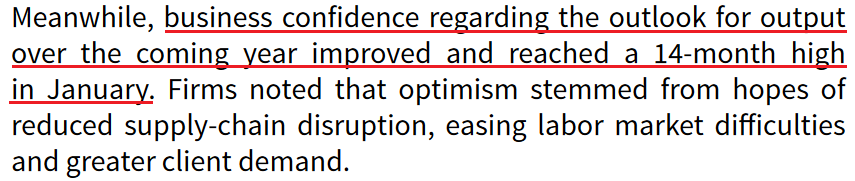
Despite that, though, business confidence regarding the 12-month outlook hit its highest level in more than a year. As such, Williamson opined that "the current downturn may prove short-lived."
Please see below:
 Source: IHS Markit
Thus, while weak short-term data helps the PMs and hurts the USD Index, the Omicron variant's economic impact should decelerate when the warmer weather arrives. Likewise, with roughly 800 of the largest U.S. manufacturers sharing this sentiment, the 2021/2022 theme of 'USD Index up, the PMs’ should be down over the medium term.
On top of that, with inflation still an issue, one-half of the Fed's dual mandate is in the danger zone. For example, the Institute for Supply Management (ISM) released its Manufacturing PMI on Feb. 1. And while the headline index decreased from 58.8 in December to 57.6 in January, the report revealed:
“The ISM Prices Index registered 76.1 percent, an increase of 7.9 percentage points compared to the December reading of 68.2 percent, indicating raw materials prices increased for the 20th consecutive month, at a faster rate in January. This is the 17th month in a row that the index has been above 60 percent…. In January, 17 industries reported paying increased prices for raw materials.”
In addition, McDonald’s – the world's largest fast-food restaurant chain – released its fourth-quarter earnings on Jan. 27. CFO Kevin Ozan said during the Q4 conference call:
“In 2022, we anticipate our operating margin percent will continue to be in the low to mid-40s range as strong top line momentum and minimal other operating income will be hampered by significant commodity and labor inflation in the near term.”
Moreover, Ozan said that McDonald’s input costs may “double” in 2022.
 Source: McDonald’s/Seeking Alpha
If that wasn’t enough, Stanley Black & Decker released its fourth-quarter earnings on Feb. 1. For context, the Fortune 500 company manufacturers hand, power, and industrial tools, and provides security services.
Moreover, CFO Don Allan said during the Q4 conference call that “the operating margin rate for the [tools & storage] segment was 11.4%, down versus last year as pricing benefits were more than offset by inflation, higher supply chain costs, growth investments in volume.” However, looking to avoid a repeat performance in 2022, management stated: Source: Stanley Black & Decker/Seeking Alpha
As a result, while investors assume that weak short-term economic data handcuffs the Fed, the medium-term issues are far from resolved. And with major U.S. corporations still sounding the inflationary alarm, price hikes should continue until their input costs come down. As a result, the ‘bad news is good news’ narrative is much more semblance than substance.
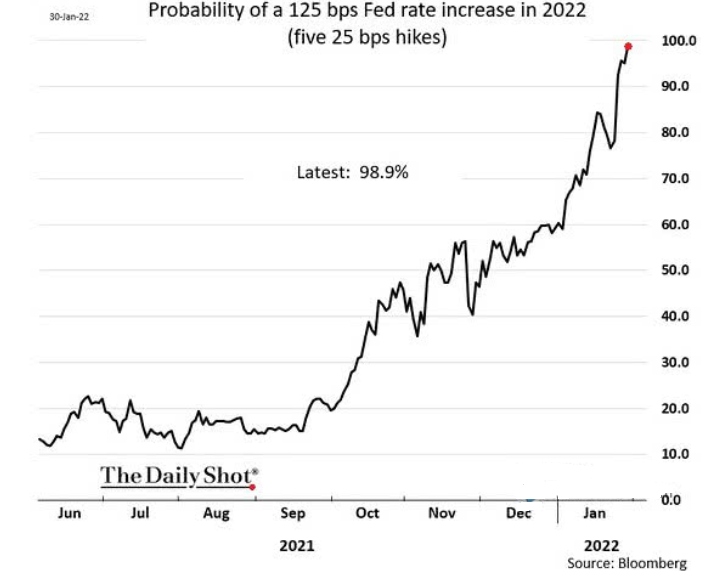
Finally, while investors hope the Fed will perform a dovish 180, the futures market isn’t buying the hype. And with the probability of five rate hikes by the Fed in 2022 hitting nearly 99% on Jan. 30, the short-term narratives impacting the PMs and the USD Index should reverse sharply over the medium term.
The bottom line? While the USD Index has suffered recently, the greenback’s fundamentals remain robust. Moreover, with investors’ upside-down narrative akin to a short-term reprieve, the medium-term implications remain unchanged. To that point, after the Delta variant’s July/August outbreak led to weak U.S. nonfarm payrolls in September, I wrote the following on Sep. 8:
With U.S. nonfarm payrolls coming in at 235,000 vs. 720,000 expected on Sep. 3 (though, the weakness was largely expected due to the disruptions from the Delta variant), the USD Index and the U.S. 10-Year Treasury yield should have suffered the brunt of investors’ wrath.
Weak economic data often elongates the Fed’s taper timeline. And with that, bullish bets on the U.S. dollar and U.S. Treasury yields often unwind when Fed tightening is perceived as delayed. However, whether the taper is officially announced in September, November or December (which is largely immaterial), investors realize that a one or two month wait doesn’t derail an investment thesis.
As a result, we find ourselves in the same situation now. However, despite the short-term implications that materialized in September, the USD Index is higher now, and the GDXJ ETF is lower now. Thus, similar outcomes should emerge this time around.
In conclusion, the PMs were mixed on Feb. 2, and the GDXJ ETF was the lone member in the red. And while the USD Index remains under pressure, it’s likely another rerun of 2021. As a result, while the PMs may win the short-term battle, the USD Index should win the medium-term war.
Overview of the Upcoming Part of the Decline
- It seems to me that the corrective upswing is over or close to being over, and that gold, silver, and mining stocks are now likely to continue their medium-term decline.
- It seems that the first (bigger) stop for gold will be close to its previous 2021 lows, slightly below $1,700. Then it will likely correct a bit, but it’s unclear if I want to exit or reverse the current short position based on that – it depends on the number and the nature of the bullish indications that we get at that time.
- After the above-mentioned correction, we’re likely to see a powerful slide, perhaps close to the 2020 low ($1,450 - $1,500).
- If we see a situation where miners slide in a meaningful and volatile way while silver doesn’t (it just declines moderately), I plan to – once again – switch from short positions in miners to short positions in silver. At this time, it’s too early to say at what price levels this could take place, and if we get this kind of opportunity at all – perhaps with gold close to $1,600.
- I plan to exit all remaining short positions once gold shows substantial strength relative to the USD Index while the latter is still rallying. This may be the case with gold close to $1,350 - $1,400. I expect silver to fall the hardest in the final part of the move. This moment (when gold performs very strongly against the rallying USD and miners are strong relative to gold after its substantial decline) is likely to be the best entry point for long-term investments, in my view. This can also happen with gold close to $1,375, but at the moment it’s too early to say with certainty.
- As a confirmation for the above, I will use the (upcoming or perhaps we have already seen it?) top in the general stock market as the starting point for the three-month countdown. The reason is that after the 1929 top, gold miners declined for about three months after the general stock market started to slide. We also saw some confirmations of this theory based on the analogy to 2008. All in all, the precious metals sector is likely to bottom about three months after the general stock market tops.
- The above is based on the information available today, and it might change in the following days/weeks.
You will find my general overview of the outlook for gold on the chart below:
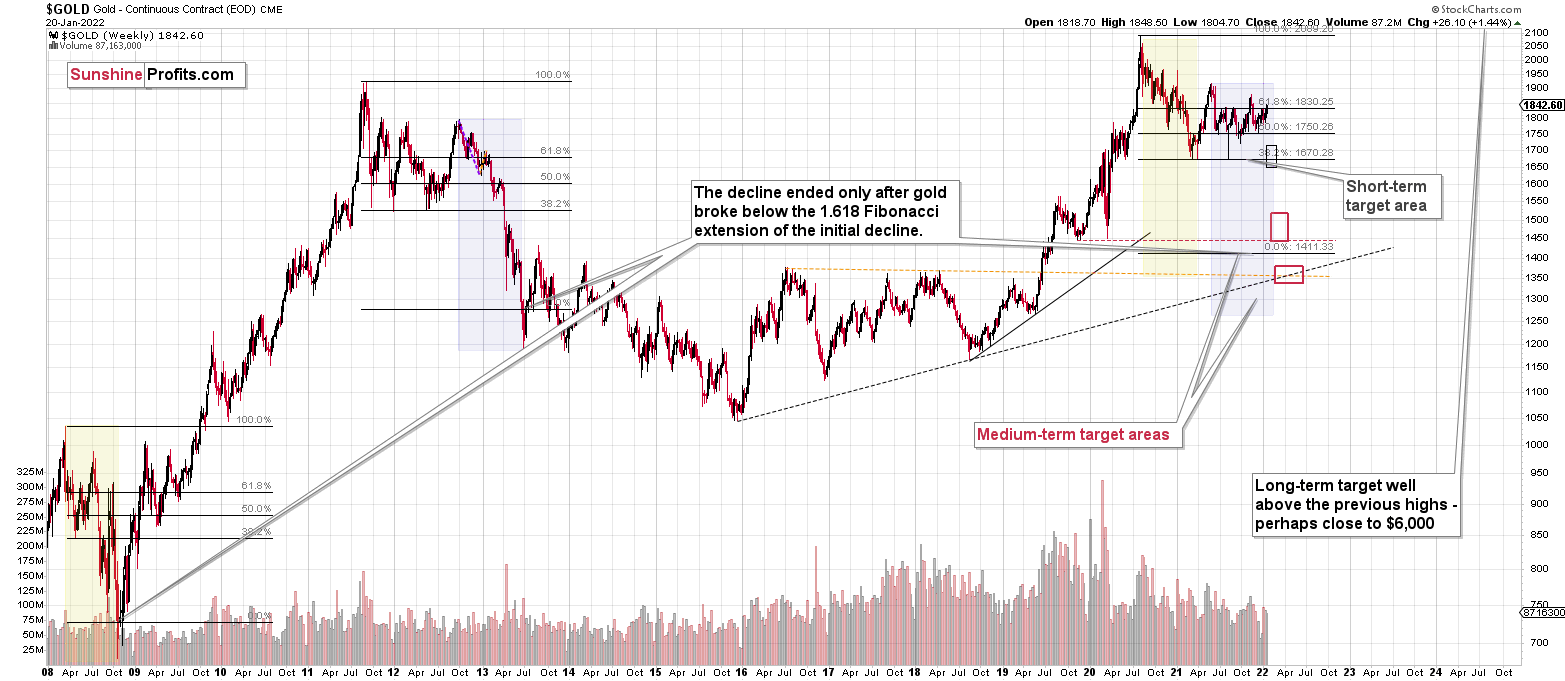
Please note that the above timing details are relatively broad and “for general overview only” – so that you know more or less what I think and how volatile I think the moves are likely to be – on an approximate basis. These time targets are not binding or clear enough for me to think that they should be used for purchasing options, warrants or similar instruments.
IMPORTANT REMINDER:
Administrative Info for This Week
I – PR – will be traveling this week, which means that the analyses will take a slightly different shape.
Regular analyses will include only the fundamental parts of the analyses, and while the technical details will not be posted regularly, I’ll still be monitoring the markets for most days, and I’ll send you intraday Alerts, if the situation requires it (in particular, if some extra changes are required in the trading or investment positions).
To be precise, the target levels presented in the “Trading capital” part below summary are “binding”, which means that if the price touches a given level, the trade should be executed (in my opinion, that is; it’s your capital, and you can do whatever you want with it) without waiting for my confirmation. I’m usually sending them for additional clarification, anyway, but this likely won’t be the case next week. In other words, if you haven’t placed an exit order on your trades, yet you’d like to apply the above suggestion, it might be a good idea to place those exit orders right away.
By “most days”, I mean that I know that there will be two days when I’ll have no access to any internet / electronics whatsoever, but I don’t know which days those will be. So, conservatively, I’ll provide you with a game-plan for the next week below. This way, my intraday comments are not that important as you’re up-to-date in advance, and if it’s necessary for me to provide you with an intraday update and I have the ability to do so, let’s treat it as an “extra value” that is not necessary (you’ll already be up-to-date because of the below details), but welcome. The gameplan is really an answer to the following question:
What to do next, if the exit levels are reached and the market then moves significantly?
Basically, there could be three scenarios in this case:
- If – after reaching the exit levels – the price moves back up significantly, then it would be a good idea to re-enter the short position in the GDXJ at $35.94 (at 300% of the size of the regular position, so the same size of the position that we have right now).
- If – after reaching the exit levels – the price moves lower significantly (in other words, it doesn’t bottom, but keeps falling), then I think it would be a good idea to re-enter the short position in the GDXJ at $31.47.
- If – after reaching the exit levels – the GDXJ price moves back-and-forth and/or doesn’t move to any of the prices in the previous points, then I think no additional action would be necessary.
The first scenario is positive (we gain more by re-entering short positions at higher prices), and the second scenario is negative (we gain less by re-entering short positions at lower prices). The third scenario is neutral.
The most likely outcome, in my view, is that the GDXJ ETF price will either not manage to get to the $34.63 target next week, or that it will manage to do so, and then it will rebound just a little or trade sideways (third scenario).
After all, let’s keep in mind that mining stocks tend to show strength before gold does, and things are not as volatile as they were in early 2020. This means that the short-term bottom is likely to be rather normal, meaning a situation where miners first show strength by declining just a little while gold declines more, then perhaps rally somewhat while gold doesn’t decline or declines just a little. It takes time for the above to take place.
Consequently, the most likely outcome, in my view, is that next week, the profits on the short position in the junior mining stocks will simply grow while we keep the positions intact.
All in all, you’re already equipped with the strategy for the next week, and the odds are that it won’t be necessary to take action, anyway.
Summary
Summing up, it seems to me that the corrective upswing is over, and that gold, silver, and mining stocks are now likely to continue their medium-term decline.
Please note that if mid-January rally was indeed based on supposedly increased tensions regarding Ukraine, then it’s likely that this rally is not going to be significant, and it might already be over. The “supposedly shocking” news already hit the market, and without any real follow-up (material) action, like Russian troops marching across the border with Ukraine, it seems that there’s nothing additional that markets could rally on. The market already “knows” that the tensions are very high and the chance for military conflict is high, regardless of whether that’s true or not. There’s not much more that can be said to increase that even further – only real action is likely to do it – and seeing such action is very unlikely in my view.
I continue to think that junior mining stocks are currently likely to decline the most out of all parts of the precious metals sector.
From the medium-term point of view, the key two long-term factors remain the analogy to 2013 in gold and the broad head and shoulders pattern in the HUI Index. They both suggest much lower prices ahead.
It seems that our profits from the short positions are going to become truly epic in the following months.
After the sell-off (that takes gold to about $1,350 - $1,500), I expect the precious metals to rally significantly. The final part of the decline might take as little as 1-5 weeks, so it's important to stay alert to any changes.
Most importantly, please stay healthy and safe. We made a lot of money last March and this March, and it seems that we’re about to make much more on the upcoming decline, but you have to be healthy to enjoy the results.
As always, we'll keep you - our subscribers - informed.
To summarize:
Trading capital (supplementary part of the portfolio; our opinion): Full speculative short positions (300% of the full position) in junior mining stocks are justified from the risk to reward point of view with the following binding exit profit-take price levels:
Mining stocks (price levels for the GDXJ ETF): binding profit-take exit price: $34.63; stop-loss: none (the volatility is too big to justify a stop-loss order in case of this particular trade)
Alternatively, if one seeks leverage, we’re providing the binding profit-take levels for the JDST (2x leveraged) and GDXD (3x leveraged – which is not suggested for most traders/investors due to the significant leverage). The binding profit-take level for the JDST: $14.98; stop-loss for the JDST: none (the volatility is too big to justify a SL order in case of this particular trade); binding profit-take level for the GDXD: $25.48; stop-loss for the GDXD: none (the volatility is too big to justify a SL order in case of this particular trade).
For-your-information targets (our opinion; we continue to think that mining stocks are the preferred way of taking advantage of the upcoming price move, but if for whatever reason one wants / has to use silver or gold for this trade, we are providing the details anyway.):
Silver futures downside profit-take exit price: $19.12
SLV profit-take exit price: $17.72
ZSL profit-take exit price: $38.28
Gold futures downside profit-take exit price: $1,683
HGD.TO – alternative (Canadian) inverse 2x leveraged gold stocks ETF – the upside profit-take exit price: $11.79
HZD.TO – alternative (Canadian) inverse 2x leveraged silver ETF – the upside profit-take exit price: $29.48
Long-term capital (core part of the portfolio; our opinion): No positions (in other words: cash
Insurance capital (core part of the portfolio; our opinion): Full position
Whether you already subscribed or not, we encourage you to find out how to make the most of our alerts and read our replies to the most common alert-and-gold-trading-related-questions.
Please note that we describe the situation for the day that the alert is posted in the trading section. In other words, if we are writing about a speculative position, it means that it is up-to-date on the day it was posted. We are also featuring the initial target prices to decide whether keeping a position on a given day is in tune with your approach (some moves are too small for medium-term traders, and some might appear too big for day-traders).
Additionally, you might want to read why our stop-loss orders are usually relatively far from the current price.
Please note that a full position doesn't mean using all of the capital for a given trade. You will find details on our thoughts on gold portfolio structuring in the Key Insights section on our website.
As a reminder - "initial target price" means exactly that - an "initial" one. It's not a price level at which we suggest closing positions. If this becomes the case (like it did in the previous trade), we will refer to these levels as levels of exit orders (exactly as we've done previously). Stop-loss levels, however, are naturally not "initial", but something that, in our opinion, might be entered as an order.
Since it is impossible to synchronize target prices and stop-loss levels for all the ETFs and ETNs with the main markets that we provide these levels for (gold, silver and mining stocks - the GDX ETF), the stop-loss levels and target prices for other ETNs and ETF (among other: UGL, GLL, AGQ, ZSL, NUGT, DUST, JNUG, JDST) are provided as supplementary, and not as "final". This means that if a stop-loss or a target level is reached for any of the "additional instruments" (GLL for instance), but not for the "main instrument" (gold in this case), we will view positions in both gold and GLL as still open and the stop-loss for GLL would have to be moved lower. On the other hand, if gold moves to a stop-loss level but GLL doesn't, then we will view both positions (in gold and GLL) as closed. In other words, since it's not possible to be 100% certain that each related instrument moves to a given level when the underlying instrument does, we can't provide levels that would be binding. The levels that we do provide are our best estimate of the levels that will correspond to the levels in the underlying assets, but it will be the underlying assets that one will need to focus on regarding the signs pointing to closing a given position or keeping it open. We might adjust the levels in the "additional instruments" without adjusting the levels in the "main instruments", which will simply mean that we have improved our estimation of these levels, not that we changed our outlook on the markets. We are already working on a tool that would update these levels daily for the most popular ETFs, ETNs and individual mining stocks.
Our preferred ways to invest in and to trade gold along with the reasoning can be found in the how to buy gold section. Furthermore, our preferred ETFs and ETNs can be found in our Gold & Silver ETF Ranking.
As a reminder, Gold & Silver Trading Alerts are posted before or on each trading day (we usually post them before the opening bell, but we don't promise doing that each day). If there's anything urgent, we will send you an additional small alert before posting the main one.
Thank you.
Przemyslaw Radomski, CFA
Founder, Editor-in-chief

