

Briefly: in our opinion, full speculative long positions in gold and silver are justified from the risk/reward point of view at the moment of publishing this Alert. We are entering a long position in gold, and we are increasing the size of the position to 150% of its regular size.
We summarized yesterday's analysis, by writing that it seemed that the USD Index had yet to decline and thus that the rally in the precious metals sector was not over yet. We emphasized that miners led the way yesterday, but silver was likely to take up the baton shortly.
In short, that's exactly what happened. The USD Index declined after its daily reversal and it seems to be just a start of the decline. It's not yet a sure bet that the USD is going to slide, though. Why?
USD Index Hanging in the Balance
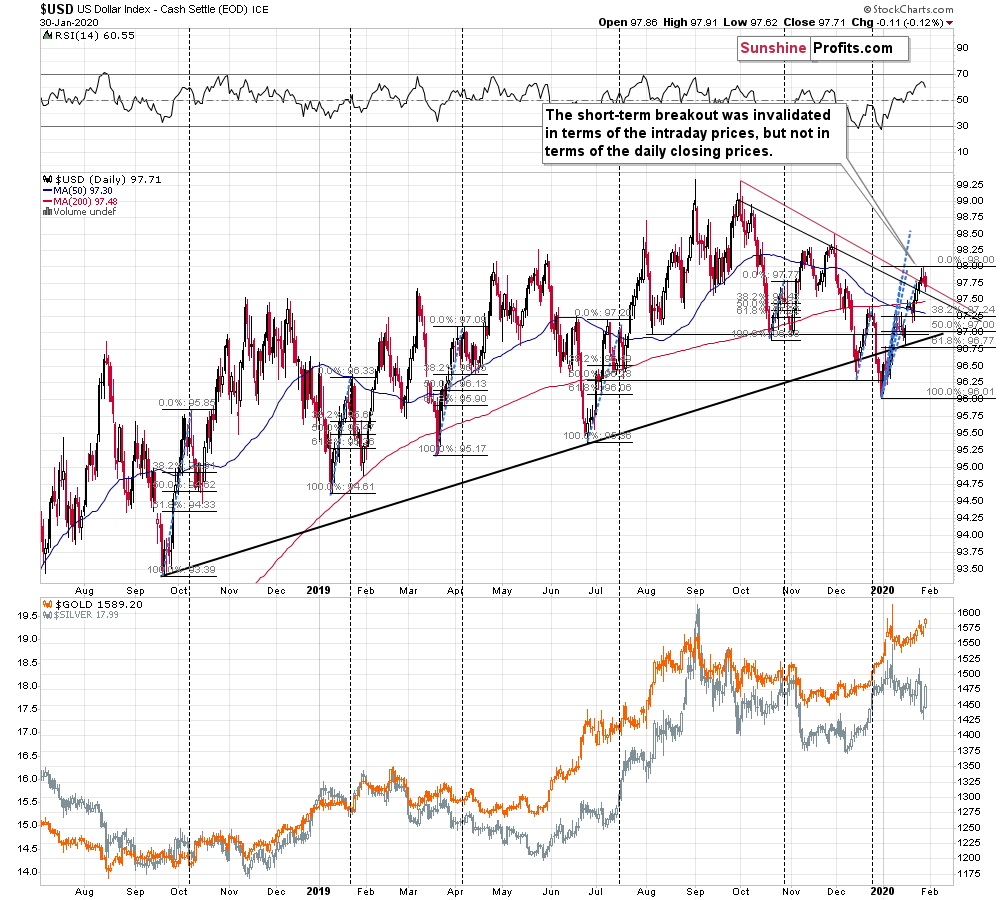
The breakout was vulnerable to invalidation as it was relatively small. Indeed, it was invalidated but only in terms of the intraday price moves. When we look at the resistance line that's based on the closing prices, we see no invalidation. This means that the outlook has just deteriorated, but that it could still get worse in the near term.
To be clear, we continue to think that the USD Index is headed much higher in the following months and perhaps years, but this doesn't mean that it will rally in a straight line.
The vertical dashed lines and the Fibonacci retracements on the above chart show what happened when the USDX entered such corrective downswings in the recent past. In one case, the USDX declined to new lows, in two cases (January 2019 and October 2019) it moved very close to its previous lows, in two other cases, it corrected about half of the preceding rally (October 2018 and July 2019), and in one case (April 2019), it moved to the 38.2% Fibonacci retracement before rallying once again.
If history is to rhyme, as it usually does, then the USD Index is likely to decline to at least 97.24. The 97 level seems to be a quite likely downside target as this support is additionally strengthened by the October low and the rising medium-term support line.
Gold's and silver's reaction to the USD movement has been quite specific before and during corrections in the latter.
In almost all above-mentioned cases, gold and silver declined (usually relatively sharply) prior to USD's declines. The July 2019 case may seem to be an exception, but it really isn't one. Back then, the USD formed two tops and the first top was indeed immediately preceded by a quick dip in both precious metals. The true exception is what happened in December 2019 - in this case, gold and silver paused a bit before rallying again. We saw that once again this week. Gold, silver, and mining stocks declined quickly, but then they came back up with vengeance as the USDX started to correct, just as we had indicated yesterday:
All in all, in most cases the quick decline in metals right at the USD top was normal. While in most cases, it is the USD Index that can tell us something about gold and silver, this time it might be the other way around first. The PMs might have declined indicating that this was indeed the final part of the USD's rally, which in turn could imply a quick comeback of the PMs along with a short-term correction in the USDX.
On a very short-term note, here's how the situation looks.
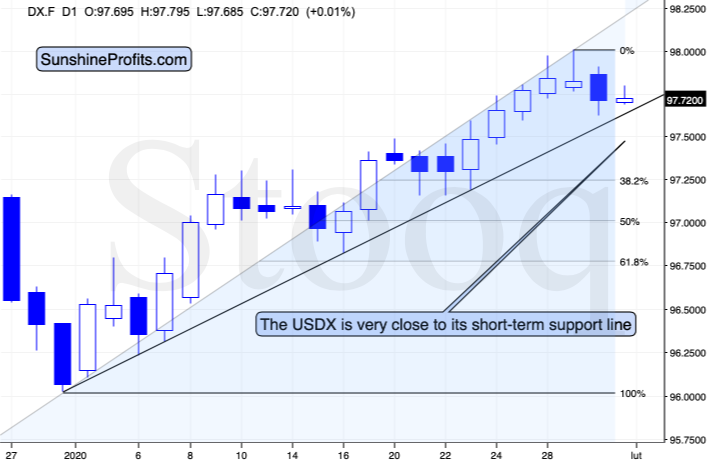
The USD Index is very close to its rising support line but hasn't broken below it just yet. This means that theoretically, the USD could (and should as the trend is unbroken) rally after touching the support line.
However, we also know that it's about time for the USD Index to correct more visibly (no market can move up or down in a straight line). Then, we saw two daily reversals, and as well how the USDX performed initially after this week's interest rate decision. Consequently, we think that a breakdown here is likely and that it would likely be followed by lower USD values and higher precious metals values. In fact, it seems that gold and silver might rally even more than we had previously thought and that our long positions will become more profitable before we close them - thus, we are adjusting them accordingly.
Meanwhile in Precious Metals

Mining stocks paused yesterday, while gold rallied and silver soared. For those who are new to the precious metals market, silver's volatility is probably surprising. But those who have been with us for long, know very well that the white metal tends to be both volatile and tricky. In particular, one should not trust silver's breakouts or breakdowns if they are not confirmed by either gold or miners (preferably both). Silver's move below the recent lows was indeed invalidated very quickly.
Looking at the above chart right now, it's difficult to say that silver is really outperforming gold, because... It's just starting to do so. As the rally in the USD Index got bigger, the time necessary for it to correct and form a bottom also grew. This means that the time for the precious metals market to rally got bigger.
Silver is likely to outperform most visibly in the final part of the rally. Due to USD's strength, the final part of the rally in the PMs - and silver's outperformance - got delayed.
Now, since the USDX seems to have started its pullback, silver should be starting to show strength - and it did exactly that yesterday.
The good news is that the way the precious metals market reacted to the first daily decline in the USDX could be the way it continues to react (approximately) during the entire USDX pullback.
The USDX declined by 0.12% yesterday, and before it reaches 97, it's likely to decline by additional 0.72% or so. This means that it's still likely to decline about 6 times more than it did yesterday. Silver rallied by 2.89% yesterday. So, does it mean that silver will soar 6 x 2.89% = 17.34% (equivalent to over $3)? Not necessarily. It does, however, indicate that silver is very likely to move to our upside target despite this week's decline.
Let's move to gold for a minute.
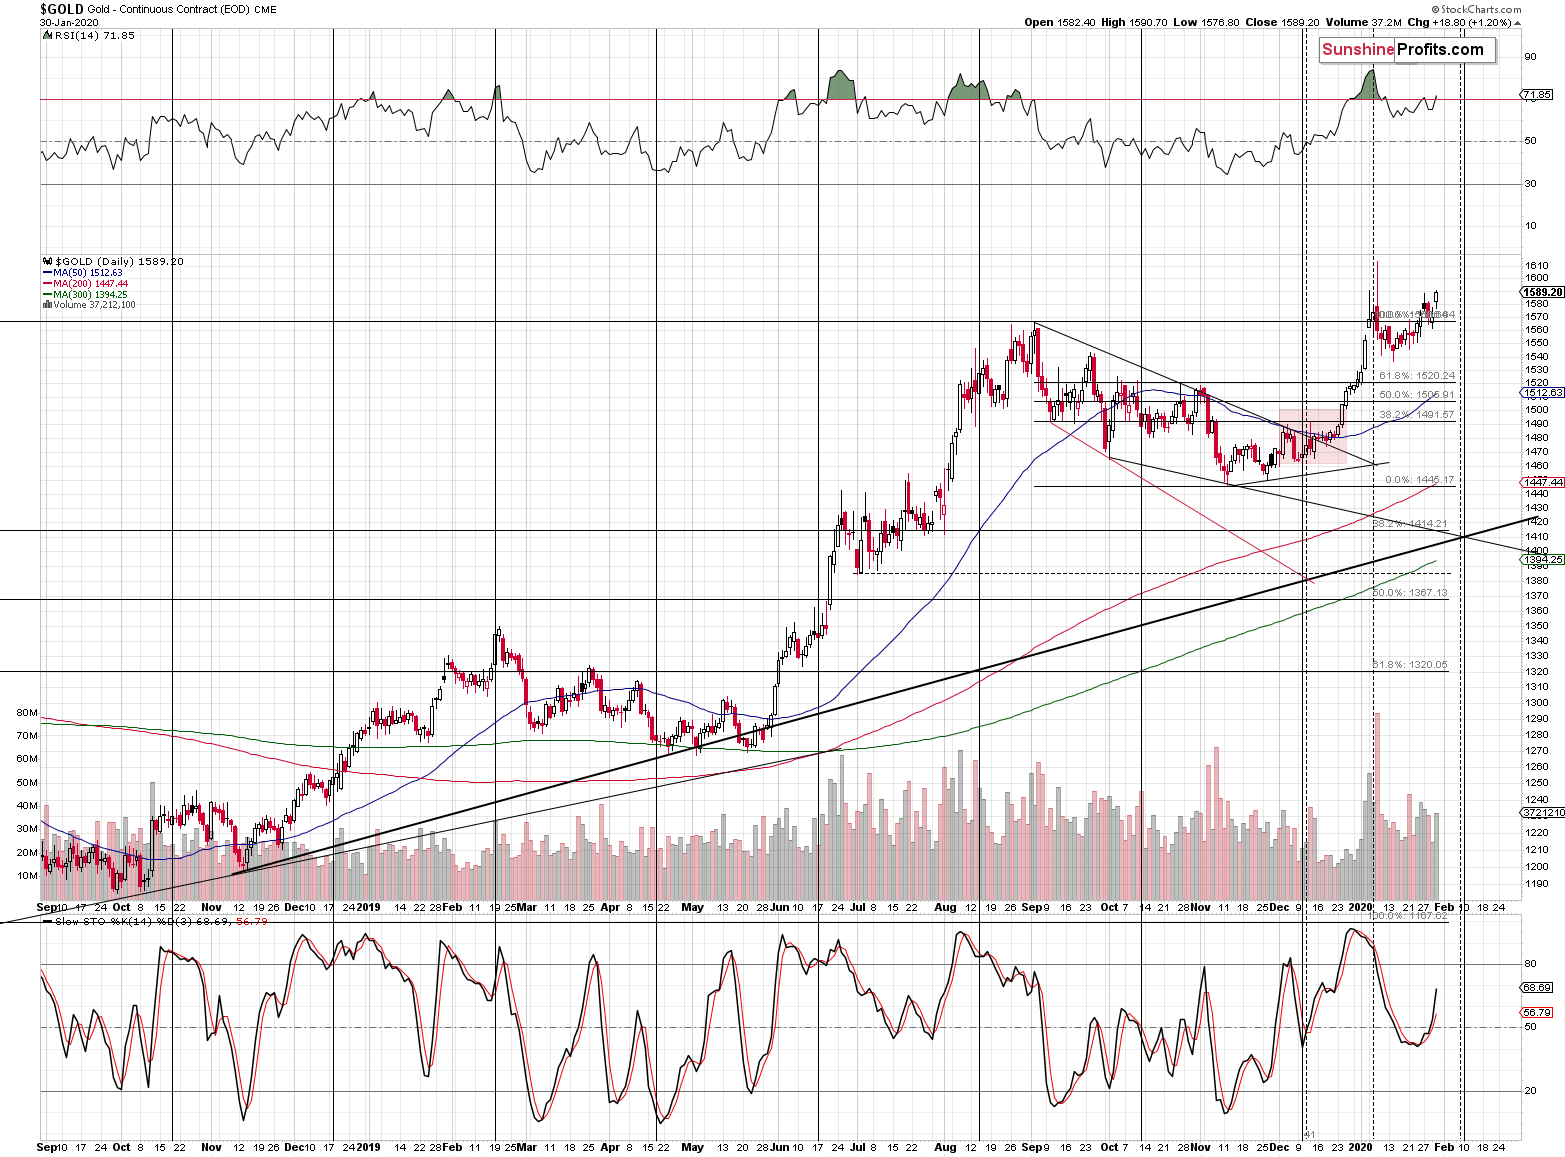
Gold closed at the highest level since the beginning of the year and it did so close to the initial upside target. Breakout in terms of the daily closing prices suggests that gold has further to run and the natural target is based on the nearest strong resistance. It's not hard to find one - it's the intraday 2020 high of $1,613. Gold might even move insignificantly and briefly above this level while it tops.
That would be in perfect tune with how gold behaved after previous tops that formed on huge volume.
Quoting from this week's flagship Gold & Silver Trading Alert:
The three very similar cases volume-wise and volatility-wise are the September 2008 top, the 2011 top, and the early 2018 top. How did gold perform immediately after the tops?
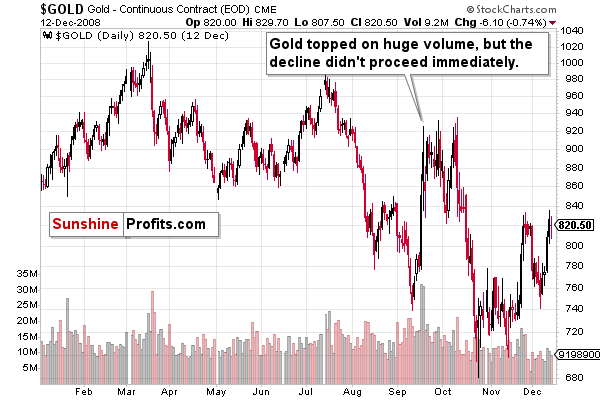
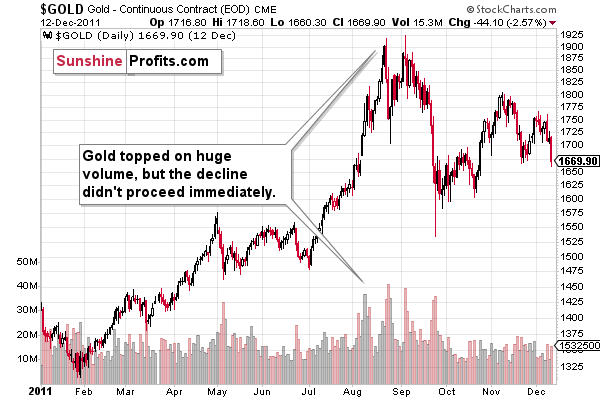
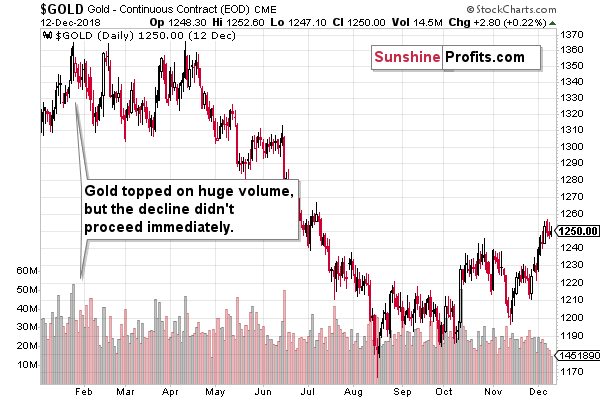
In all three cases, gold topped on huge volume, but the decline didn't proceed immediately. There was a delay in all cases and a re-test of the previous high. The delay took between several days and a few months.
Since a similar pattern followed the huge-volume tops, it seems that we might see a re-test of the recent high in the near future. Don't get us wrong - the true rally has most likely ended, but we might see a move close to the January high, a move to it, or even a move that gets gold very insignificantly above it. That's when people bought gold at the top in 2008, 2011, and 2018, and we don't want you to fall for this market trick. Knowing what happened then - huge declines in the price of gold - should prevent you from buying on hope for a breakout to new highs. Oh, and by huge declines, we mean the ones where gold declined by hundreds of dollars.
Ok, so gold is now likely to rally to its January high and top close to it. Fortunately, we have not only indications about the price, but also about the time when that top might take place.
The long-term triangle-vertex-based reversal worked very well in mid-January by detecting the short-term bottom and it seems that the next reversal might indicate the next top.
Timing the Reversals
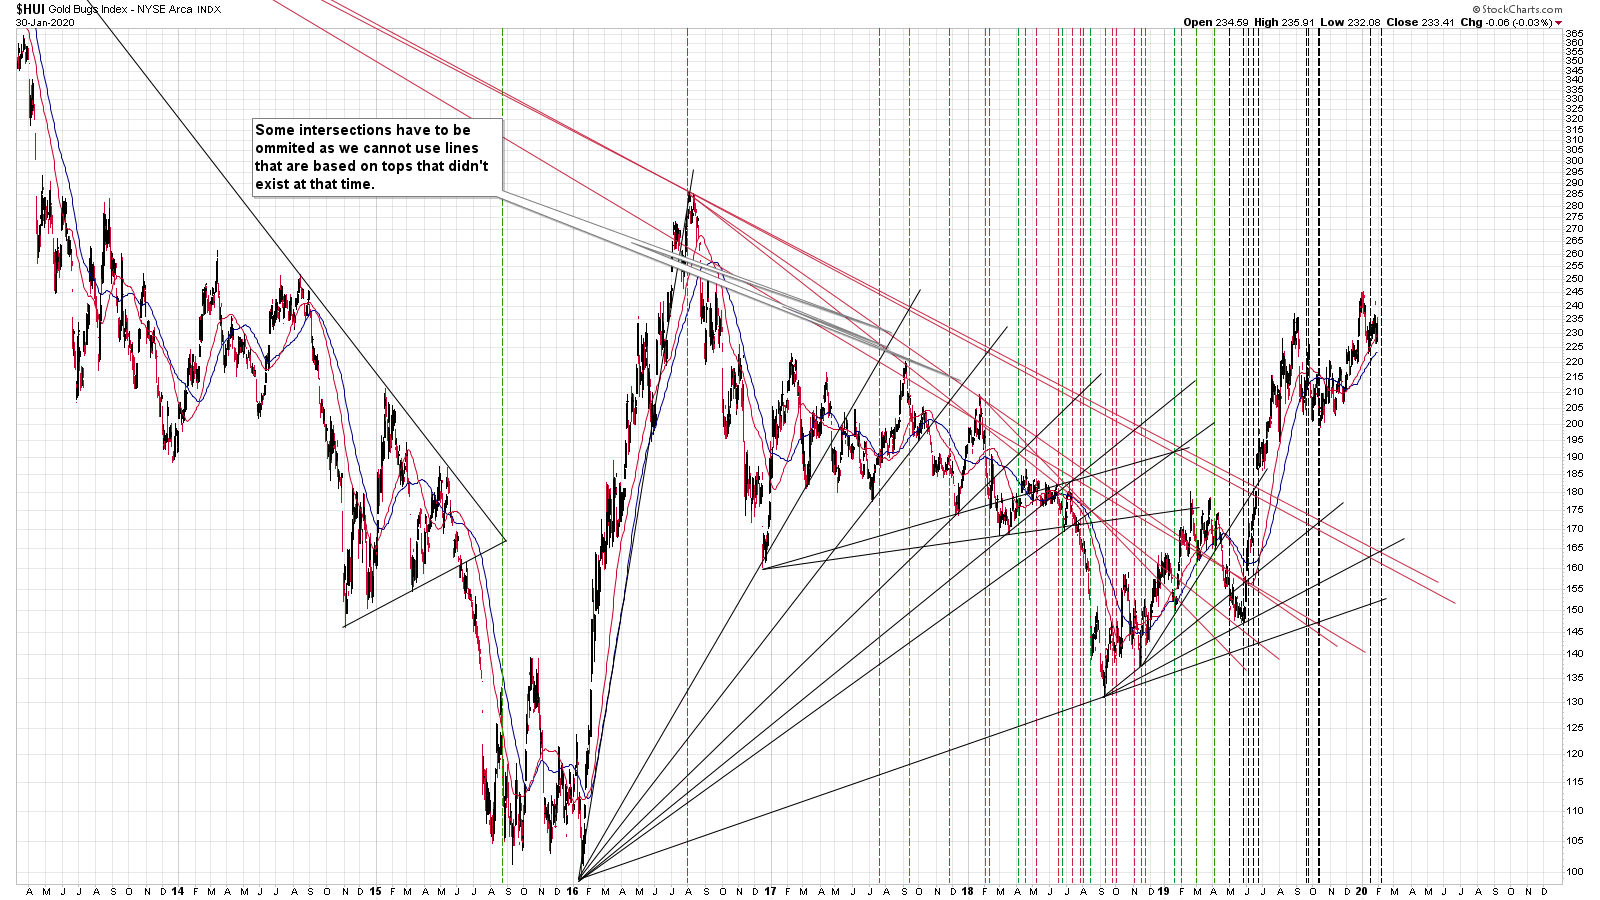
It's in early February, which is very close to the current day on the above chart. However, this is partially the case due to the long-term nature of this chart. Zooming in shows that the top might still be a week (or so) away.
The gold chart provides additional - more short-term-oriented - confirmations. For your convenience, we are posting it once again below.
The triangle-vertex-based reversal that's based on the rising medium-term support line and the declining support line cross in about a week, which could mean that the top is going to be formed either on Friday, February 7th, or on Monday, February 10th. These time targets are also confirmed by yet another tool - gold's cyclical turning point.
Summary
Summing up, it seems that the USD Index has yet to decline and thus that the rally in the precious metals sector is not over yet. It appears likely that the precious metals sector is going to rally for about a week and top with gold close to its intraday 2020 high. Silver seems to have taken up the baton from miners and we expect it to shine particularly brightly in the final part of this short-term upswing.
Based on the increased clarity with regard to the upside target in gold, we think that a long position in it is justified from the risk to reward point of view. We are not opening a long position in the mining stocks, though, as they tend to underperform in the final part of the PM rallies. We are also increasing the size of the long position in general.
Naturally, the medium-term outlook for the precious metals market remains very bearish and once the short-term correction is over, the declines are likely to resume.
As always, we'll keep you - our subscribers - informed.
To summarize:
Trading capital (supplementary part of the portfolio; our opinion): Full speculative long position (150% of the full position) in gold and silver is justified from the risk/reward perspective with the following stop-loss orders and binding exit profit-take price levels:
- Gold futures: profit-take exit price: $1,608; stop-loss: $1,558; initial price target for the UGLD ETN: $161.84 ; stop-loss for the UGLD ETN: $146.98
- Silver futures: profit-take exit price: $18.49; stop-loss: $17.24; initial target price for the USLV ETN: $99.97; stop-loss for the USLV ETN: $82.95
Long-term capital (core part of the portfolio; our opinion): No positions (in other words: cash)
Insurance capital (core part of the portfolio; our opinion): Full position
Whether you already subscribed or not, we encourage you to find out how to make the most of our alerts and read our replies to the most common alert-and-gold-trading-related-questions.
Please note that the in the trading section we describe the situation for the day that the alert is posted. In other words, it we are writing about a speculative position, it means that it is up-to-date on the day it was posted. We are also featuring the initial target prices, so that you can decide whether keeping a position on a given day is something that is in tune with your approach (some moves are too small for medium-term traders and some might appear too big for day-traders).
Plus, you might want to read why our stop-loss orders are usually relatively far from the current price.
Please note that a full position doesn't mean using all of the capital for a given trade. You will find details on our thoughts on gold portfolio structuring in the Key Insights section on our website.
As a reminder - "initial target price" means exactly that - an "initial" one, it's not a price level at which we suggest closing positions. If this becomes the case (like it did in the previous trade) we will refer to these levels as levels of exit orders (exactly as we've done previously). Stop-loss levels, however, are naturally not "initial", but something that, in our opinion, might be entered as an order.
Since it is impossible to synchronize target prices and stop-loss levels for all the ETFs and ETNs with the main markets that we provide these levels for (gold, silver and mining stocks - the GDX ETF), the stop-loss levels and target prices for other ETNs and ETF (among other: UGLD, DGLD, USLV, DSLV, NUGT, DUST, JNUG, JDST) are provided as supplementary, and not as "final". This means that if a stop-loss or a target level is reached for any of the "additional instruments" (DGLD for instance), but not for the "main instrument" (gold in this case), we will view positions in both gold and DGLD as still open and the stop-loss for DGLD would have to be moved lower. On the other hand, if gold moves to a stop-loss level but DGLD doesn't, then we will view both positions (in gold and DGLD) as closed. In other words, since it's not possible to be 100% certain that each related instrument moves to a given level when the underlying instrument does, we can't provide levels that would be binding. The levels that we do provide are our best estimate of the levels that will correspond to the levels in the underlying assets, but it will be the underlying assets that one will need to focus on regarding the signs pointing to closing a given position or keeping it open. We might adjust the levels in the "additional instruments" without adjusting the levels in the "main instruments", which will simply mean that we have improved our estimation of these levels, not that we changed our outlook on the markets. We are already working on a tool that would update these levels on a daily basis for the most popular ETFs, ETNs and individual mining stocks.
Our preferred ways to invest in and to trade gold along with the reasoning can be found in the how to buy gold section. Additionally, our preferred ETFs and ETNs can be found in our Gold & Silver ETF Ranking.
As a reminder, Gold & Silver Trading Alerts are posted before or on each trading day (we usually post them before the opening bell, but we don't promise doing that each day). If there's anything urgent, we will send you an additional small alert before posting the main one.
Thank you.
Sincerely,
Przemyslaw Radomski, CFA
Editor-in-chief, Gold & Silver Fund Manager

