

Briefly: in our opinion, full (200% of the regular size of the position) speculative long positions in gold, silver and mining stocks are justified from the risk/reward perspective at the moment of publishing this alert. In other words, we are once again increasing the size of our current long position.
Gold moved higher and silver did more or less the same and some may say that nothing really exceptional happened on the precious metals market. And they would be terribly wrong. Gold stocks soared! The implications are too clear for anyone to ignore. Our initial upside targets were already reached, but this doesn’t automatically mean that the outlook changed. What changed?
The upside potential.
Being bearish for the medium term is one thing, but ignoring an extra clear buying opportunity is a something entirely different. We don’t think that the final bottom for the precious metals market is yet in, but at the same time it seems that PMs got ahead of themselves during the decline and need to correct first before they will be ready to decline once again. Friday’s exceptional rally in gold stocks very strongly suggests that the precious metals sector will move higher than we previously assumed.
Let’s take a closer look at the charts for details, starting with gold(charts courtesy of http://stockcharts.com/).
Gold’s Upside Target
Before featuring the upside target, let’s take a look at what happened recently.
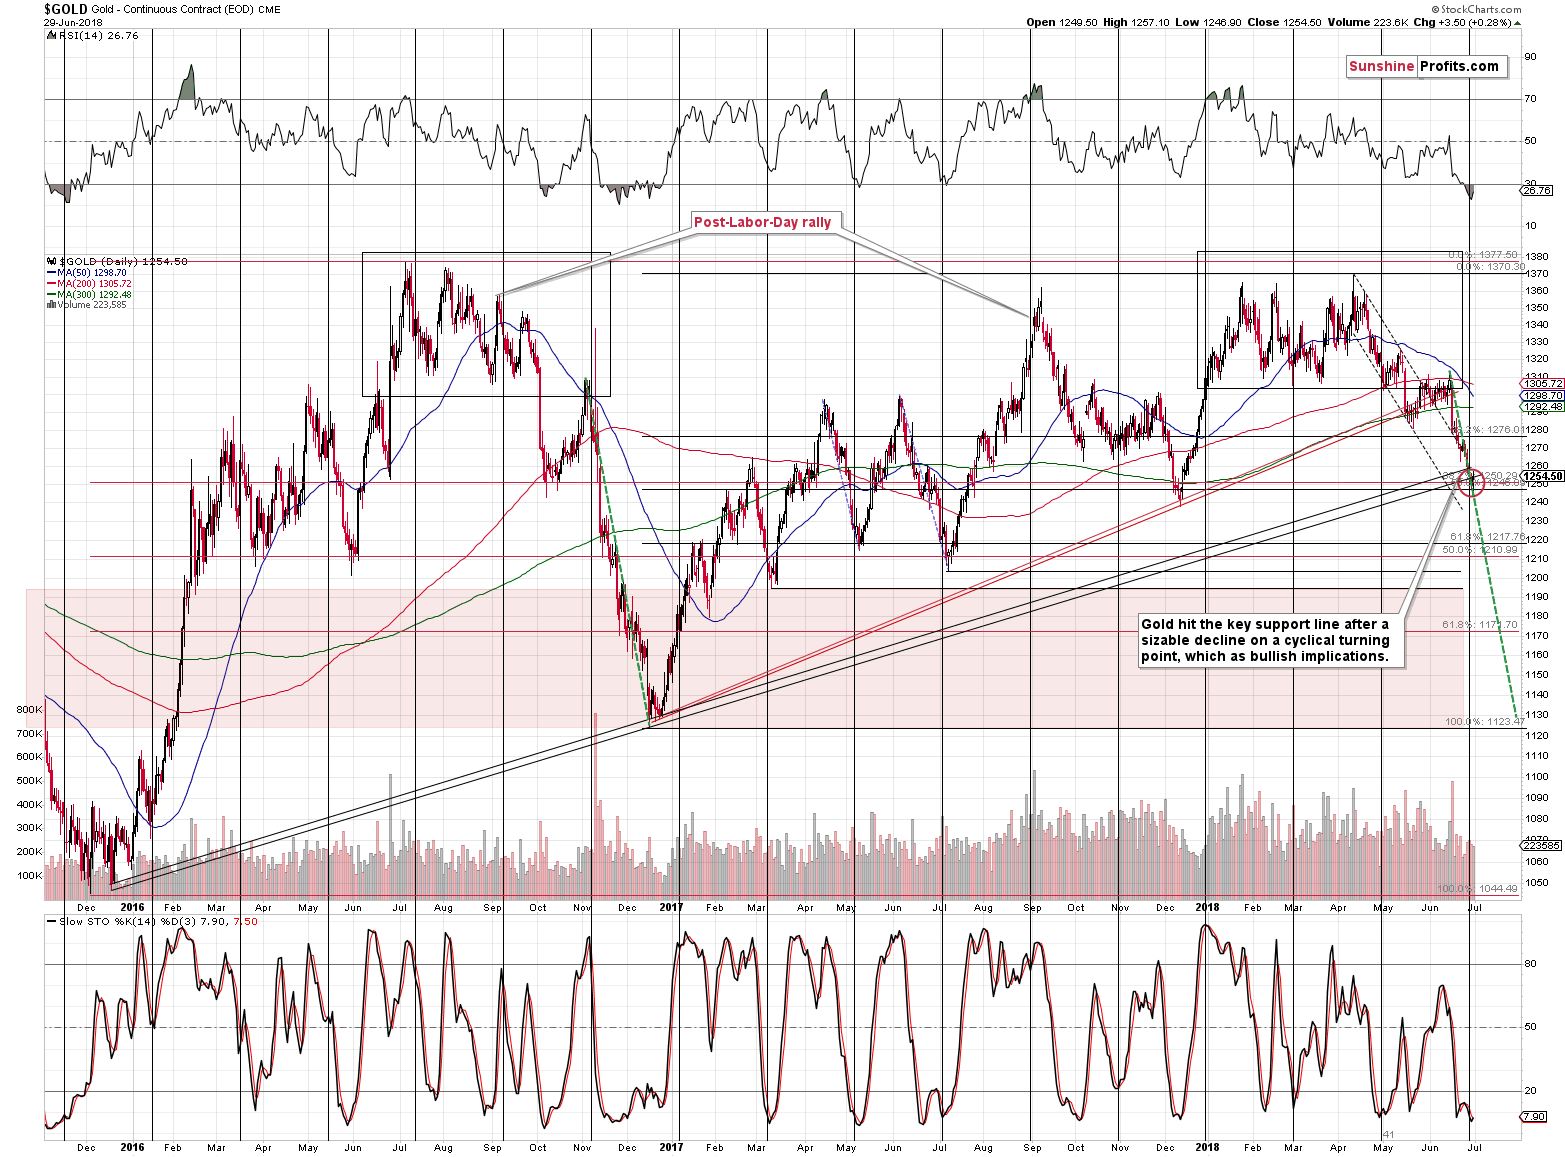
Gold reversed right inside our target area, very close to the cyclical turning point and a combination of support levels, which was confirmed by a small buy signal from the Stochastic indicator. But, it’s not very clear on the above chart as all the factors are at present so close to each other. Let’s zoom in.
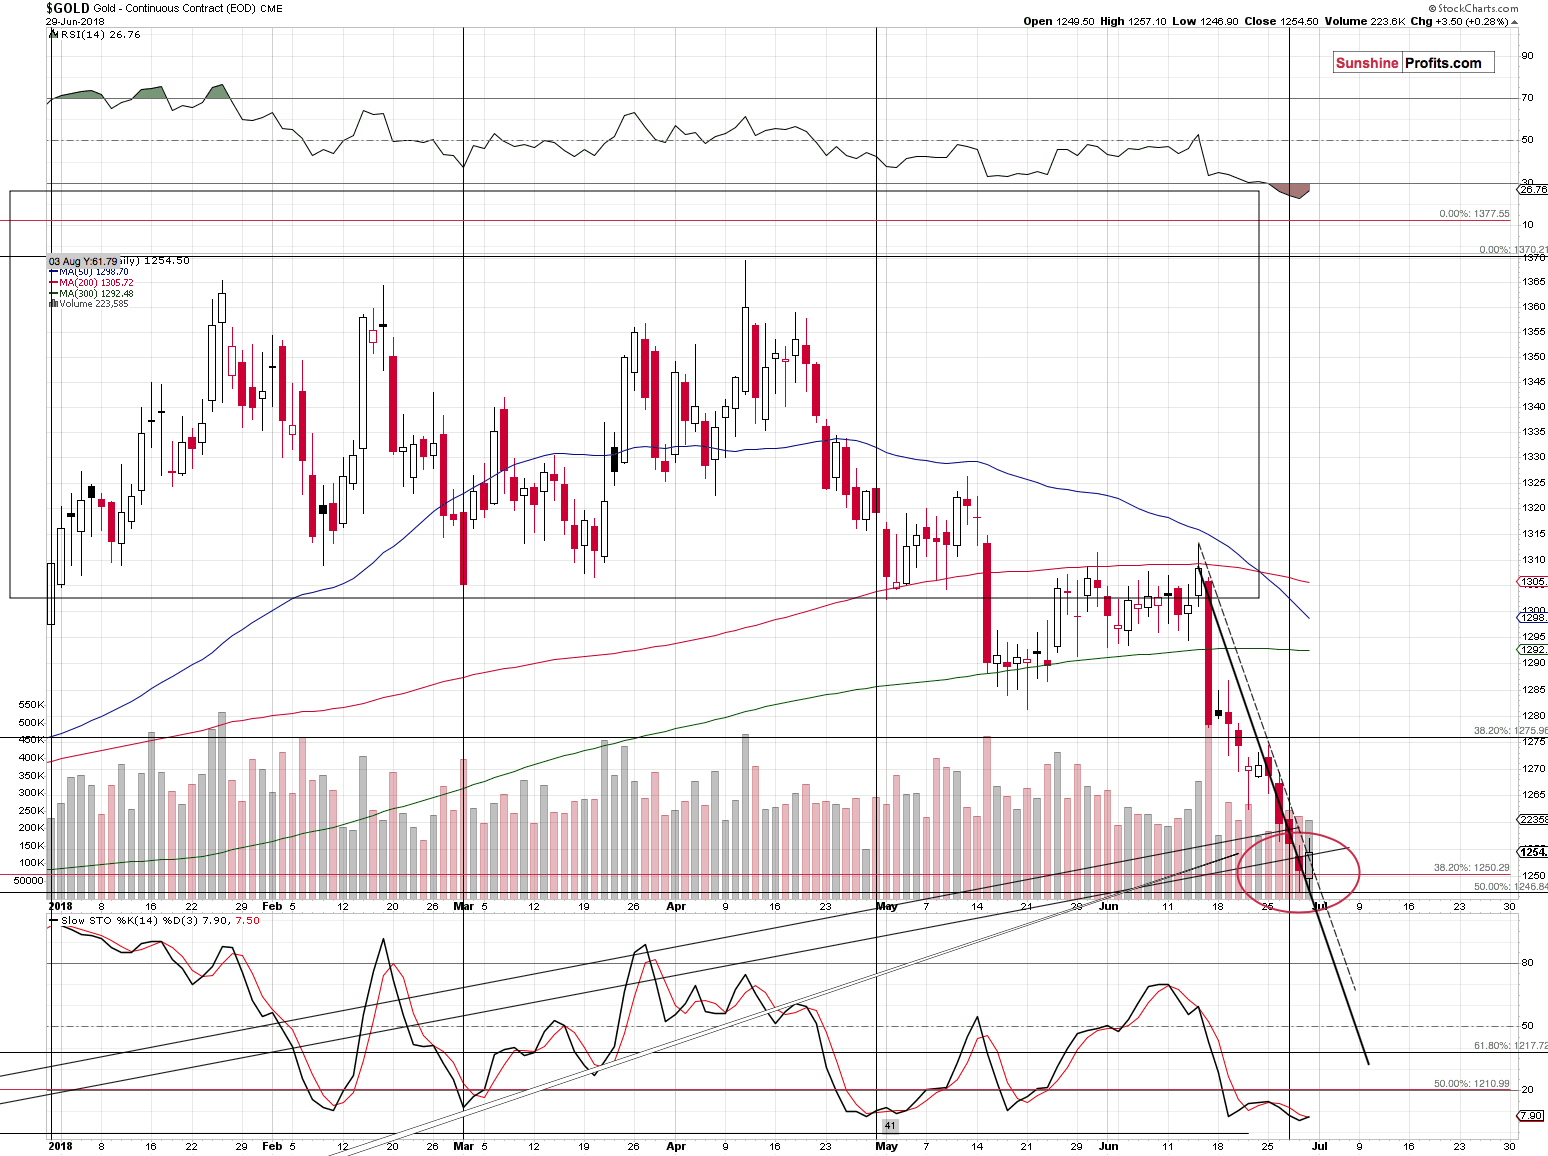
Although small, Friday’s daily upswing was the first that we saw in many days. Technically, there was a daily upswing on June 22nd, but that was just a $0.20 “rally”, so it doesn’t really count.
Friday’s $3.50 upswing was enough for gold to break above the lower of the declining resistance lines. The thick black line above which gold broke was based on the previous closing prices. Gold closed the session right at the line based on the intraday highs, so the above short-term picture is not clearly bullish, but definitely more bullish than it was previously.
The above doesn’t seem enough to justify a long position, but please keep in mind that the details that do are visible on the previous chart.
So, if the outlook is bullish, then how high can gold rally?
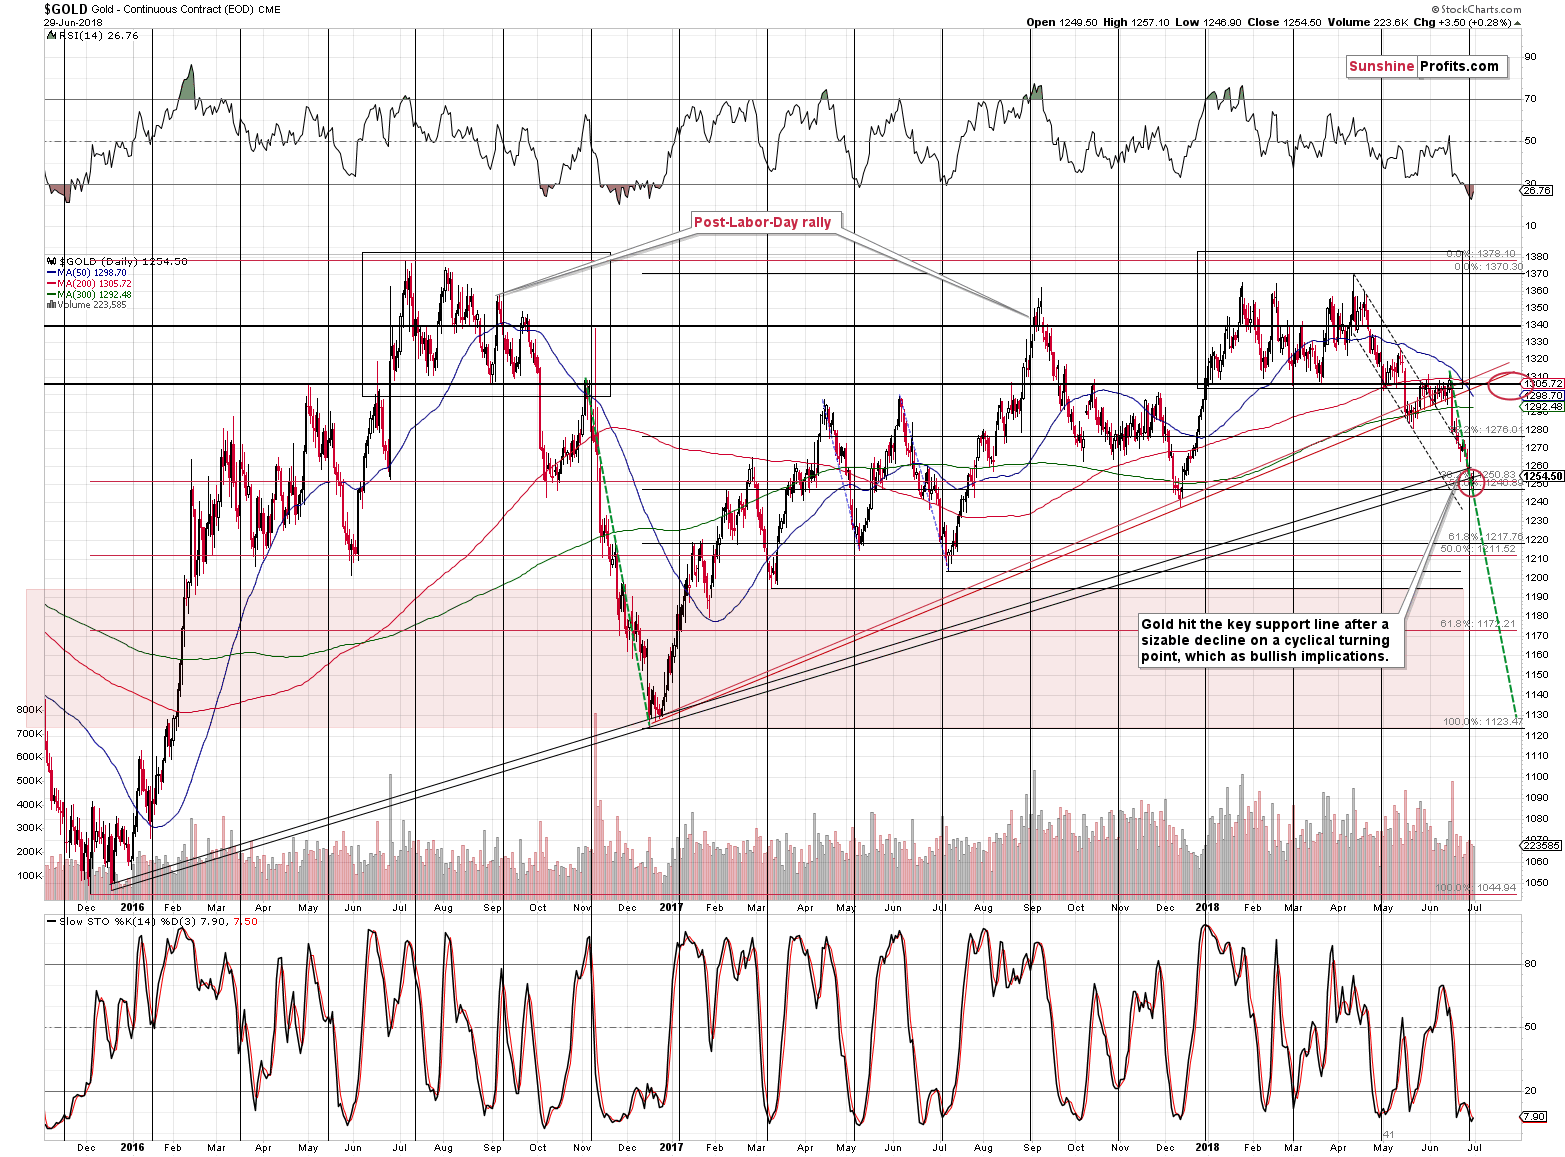
We previously assumed that gold would move to about $1,270 - $1,280, but the $1,300 - $1,310 range seems more likely at this time. The main reason is the strength in the gold stocks and the fact that we saw bullish signs for several days, not just during one session. Signals that take longer usually precede longer and/or bigger moves. While this doesn’t mean that the medium-term decline is over, it does mean that we are likely to get a rally that’s bigger than just $20 and that takes more than just a few days.
Ok, but why $1,300?
The first reason is that this is the first strong resistance above the $1,270 - $1,280 range, and the second reason is that this would be in tune with the analogy to what happened in late 2016. Back then gold moved from below $1,250 to above $1,305 in a decisive, but still normal way. We are not counting on the repeat of the crazy intraday action that we saw in early November 2016 as it was practically purely emotion-driven response to Trump’s victory.
Mining Stocks Soar
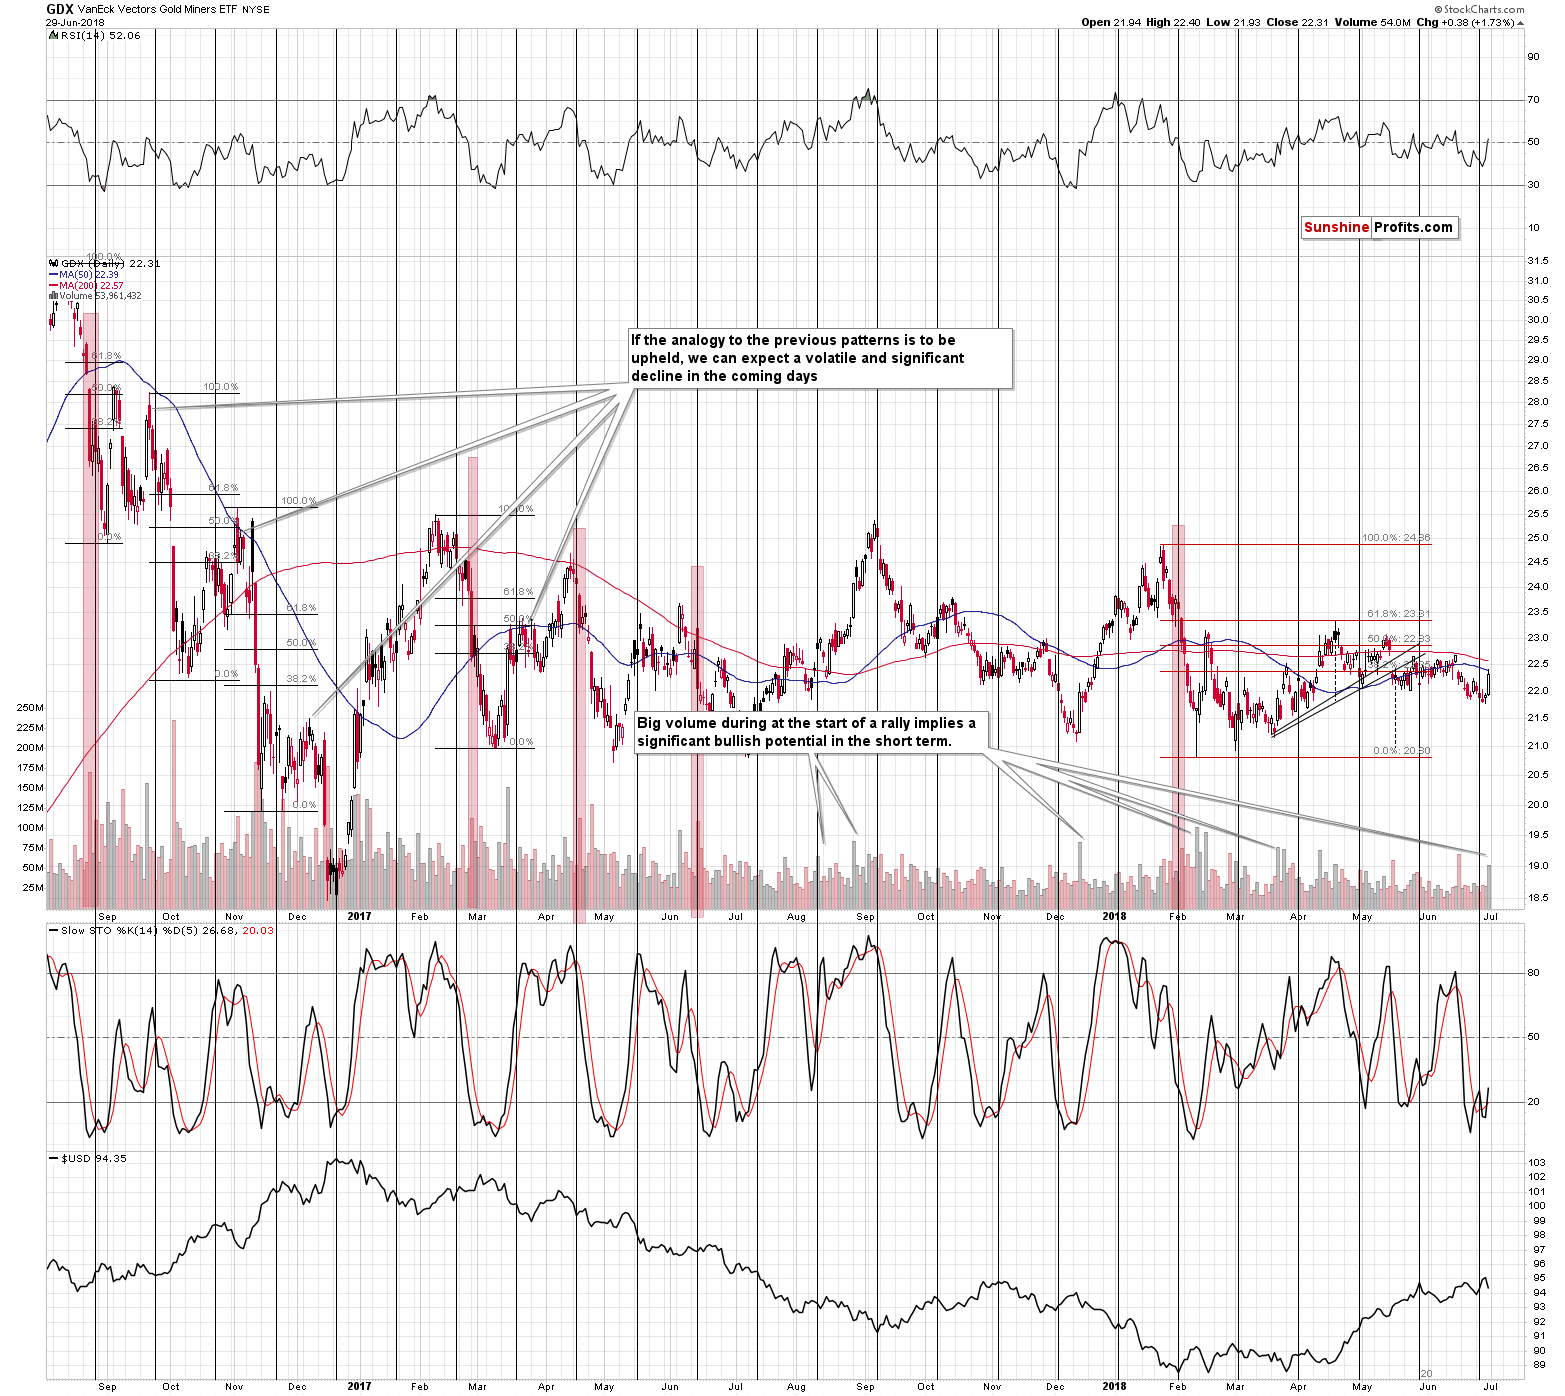
Miners soared on huge volume, which confirms the strength of the move. In the previous cases, similar sessions at the beginning of a move higher meant that the move will be at least considerable – not very small.
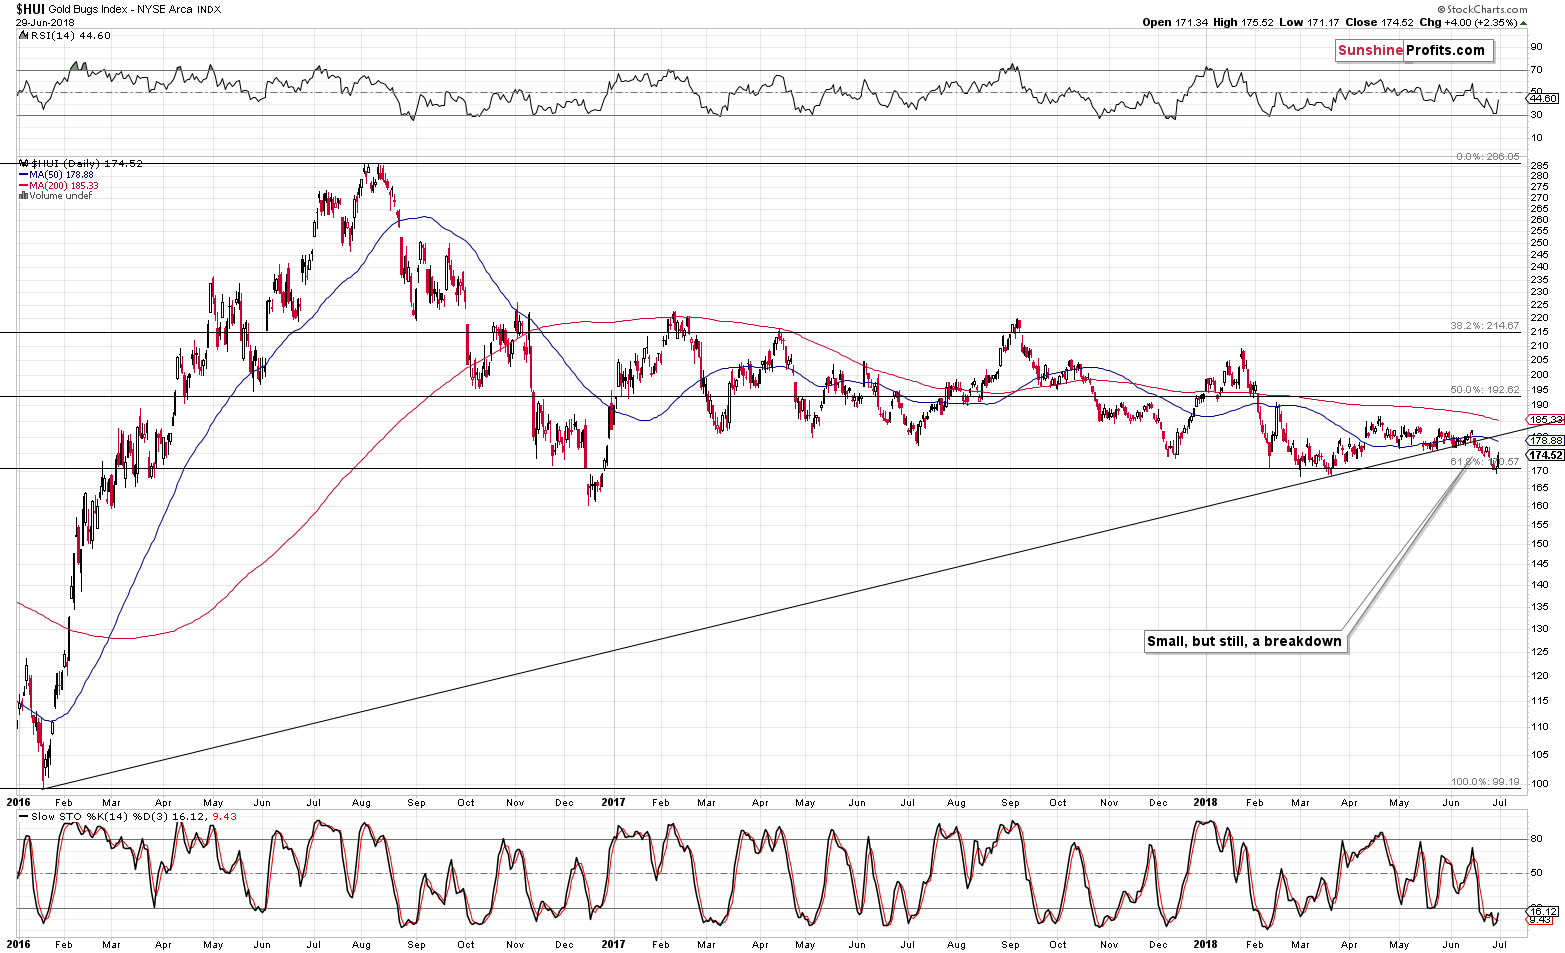
One June 28th, we wrote the following on the above HUI Index chart:
(…) the HUI Index moved even lower – to 170.45, which is a bit below the above-mentioned 61.8% Fibonacci retracement. Does this small breakdown have bearish implications? Not really.
There were only 4 attempts to move below this retracement. In one case (February 2018), the retracement was touched and triggered a powerful short-term rally. On the remaining 3 cases (once in December 2016, twice in March 2018), the time when HUI moved below the retracement was an excellent time to go long as it was followed by an invalidation and a rally. The one in late 2016 and early 2017 was quite sizable, but we don’t think we’ll see anything like that this time. Still, the short-term implications are bullish.
The small breakdown was invalidated just like it was likely to be and the implications are clearly bullish. The nearest resistance level that we have on this chart that seems strong enough to stop this rally is the previously broken rising resistance line. It provides resistance at about 182. Still, we wouldn’t rule out a situation in which, we see a very temporary move above it – to 186 or so (the April highs). Which of these levels will finally stop the decline will depend on what gold, silver, and USDX do at that time and what kind of confirmations we get.
Speaking of silver, let’s take a look at its recent price movement.
Silver’s Bottom and Low-volume Rally
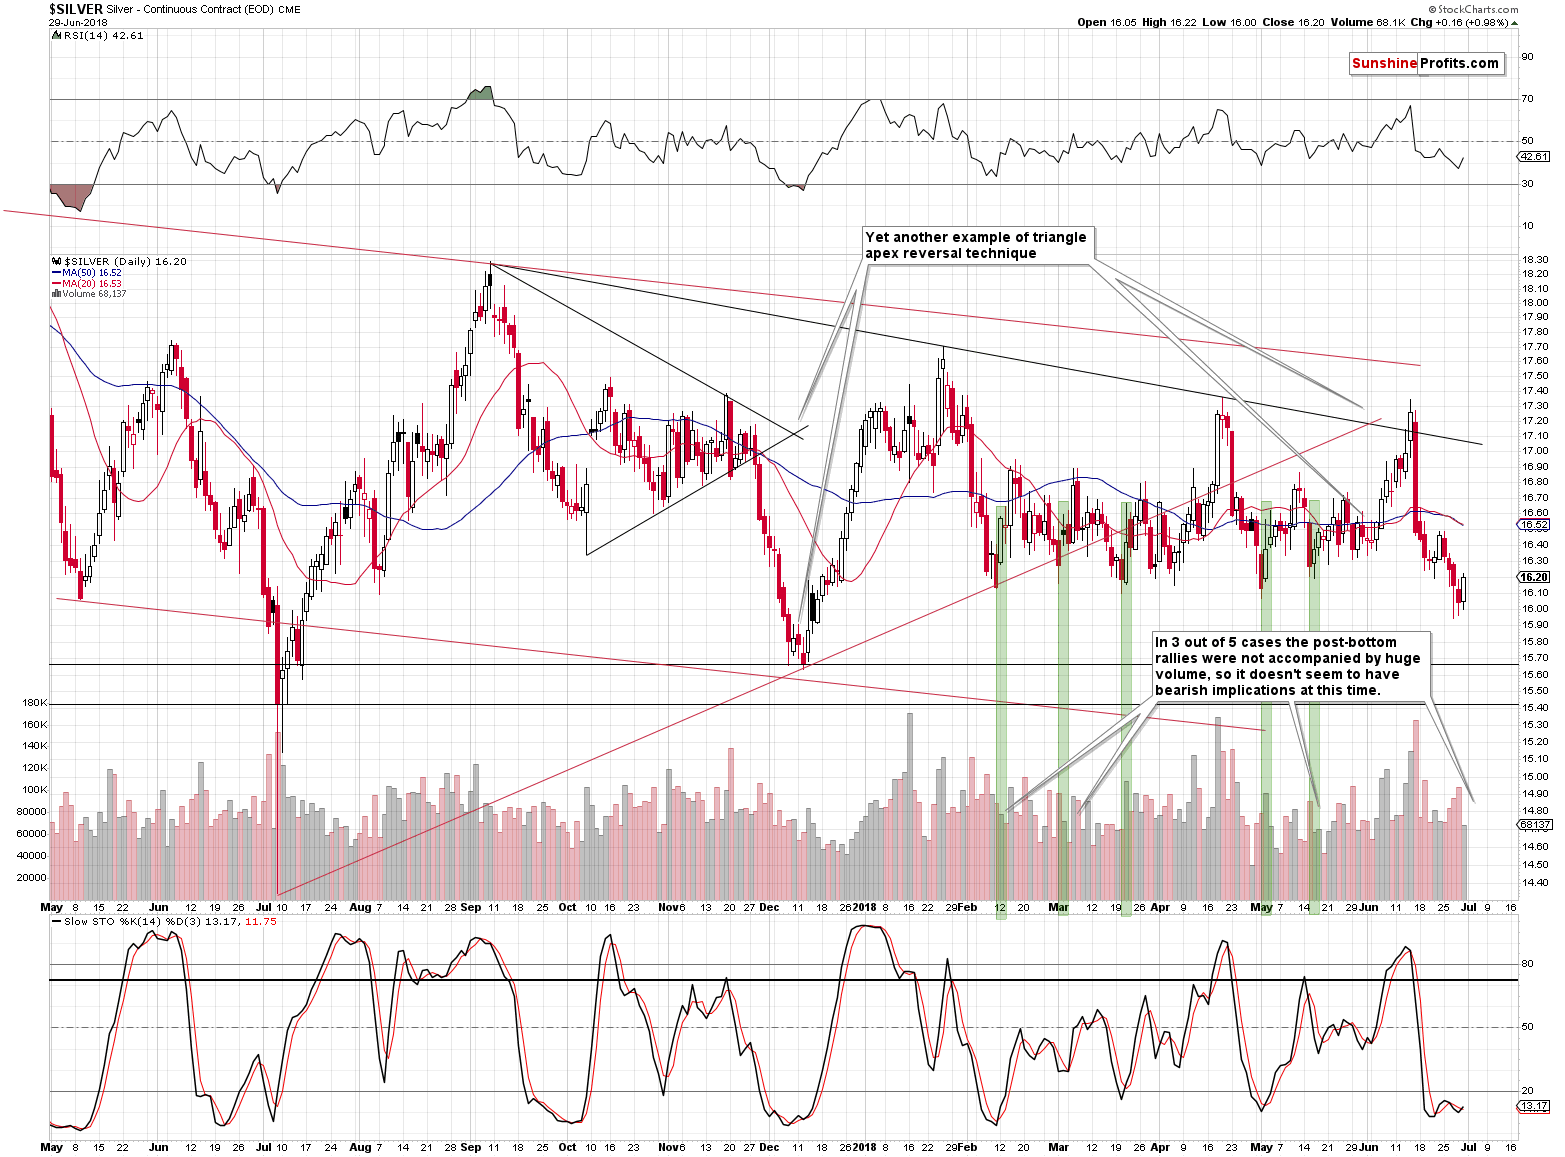
It took silver 3 days to form a full reversal, but we finally have it. Silver closed the week higher than it closed on Thursday and on Wednesday, which is clearly bullish. The bullish implications are further strengthened by The fact that silver closed Friday’s session (and the week) above the previous 2018 lows in terms of daily closing prices. Therefore, we just saw an invalidation of the breakdown, which is particularly bullish for the short term.
Some may say that silver moved higher on average volume that was low on a relative basis and thus this rally is not reliable. This is a real general rule that applies to the vast majority of markets. But silver is a rather odd market from the technical point of view and everything needs to be tested for it before it can be reliably applied. For instance, silver’s big rallies on huge volume are usually a bearish sign (especially if silver outperforms gold), while in most markets that would be a strong bullish indication.
In case of the previous bottoms, the initial rallies took place on both: high and average volume that was low on a relative basis. We had 5 cases total and in only 2 of them, the initial part of the rally was confirmed by strong volume. In the remaining 3 cases, the volume was nothing to call home about. Overall, unless the volume is very low (and it wasn’t the case on Friday), it seems that it doesn’t matter what kind of volume follows a bottom. Therefore, the size of volume that accompanied Friday’s move higher is not bearish – it’s neutral.
So, how high is silver likely to go?
Many of the previous short-term 2018 rallies ended between $16.70 and $16.90, so this target range is our conservative target. The more aggressive one is another test of the June high at the $17.30 - $17.40 range. Depending on where silver is when gold moves to $1,300, one of these targets will become more probable – for now, it’s impossible to tell.
But wasn’t silver supposed to decline based on the long-term similarity to 2000?
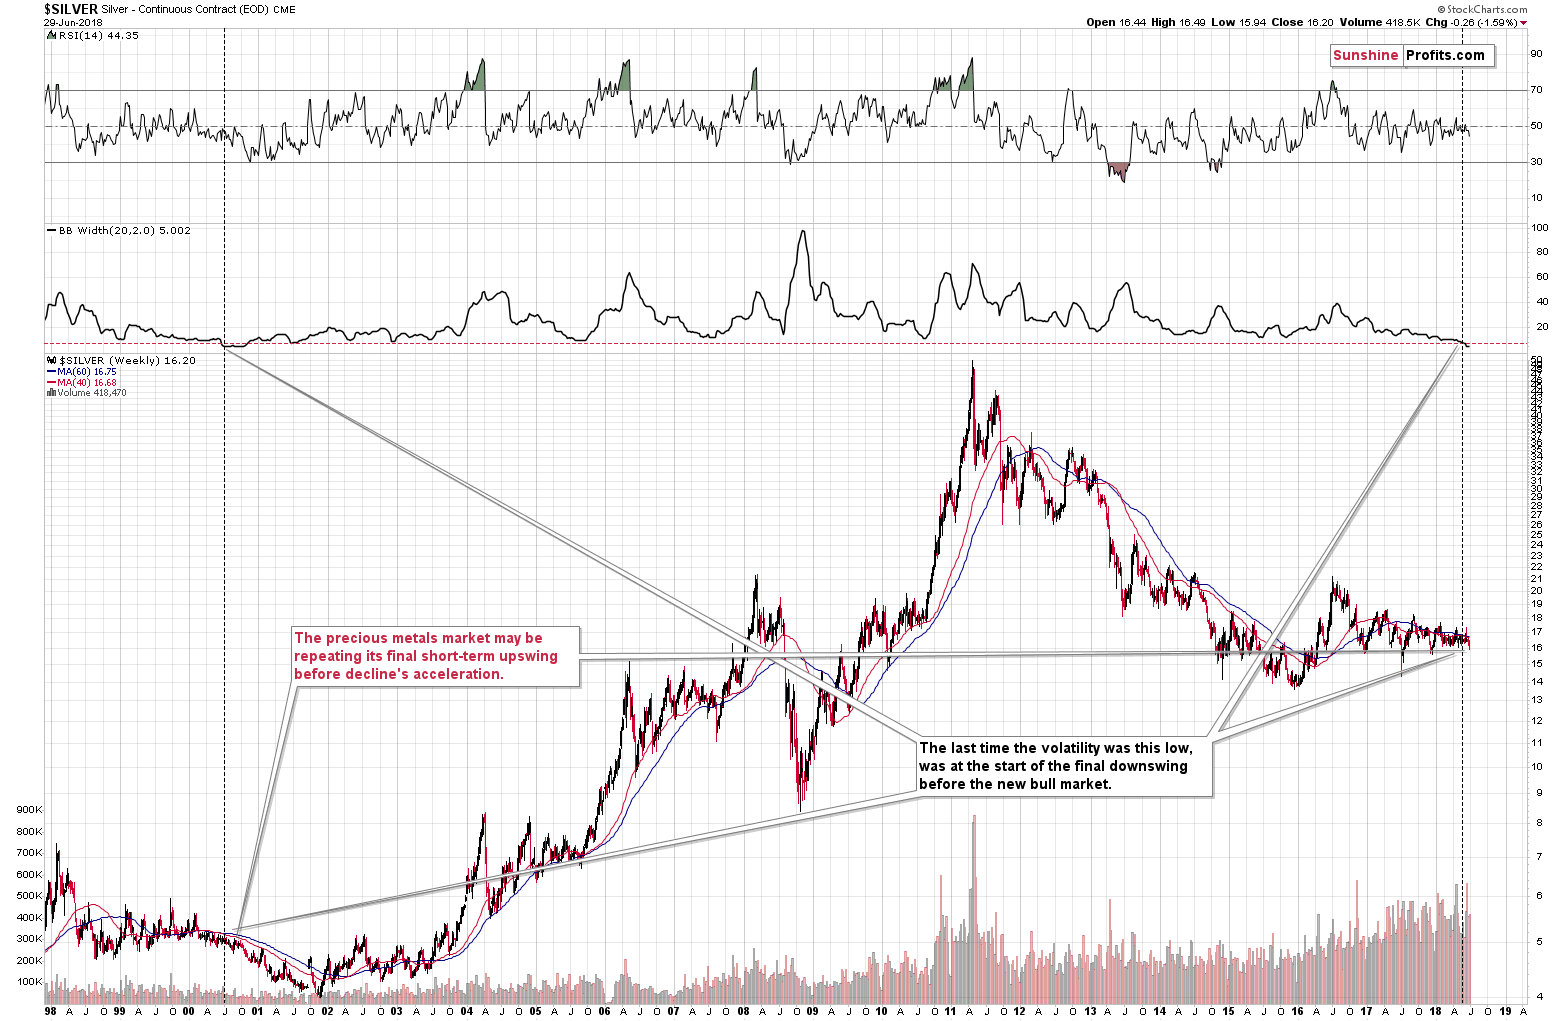
Yes, that was and still remains to be the case. The implications, however, are of medium-term nature, not of short-term one. In other words, silver is still likely to move much lower in the coming months, but this factor doesn’t say anything about the next several days – that’s not that the analogy is supposed to detect.
But maybe it can do so after all. If you take a closer look at what happened in the second half of 2000, you’ll notice that there was a corrective upswing right after the very initial part of the decline that was then followed by the steeper downswing. This is exactly what we expect to happen based on other factors, and thus it serves as a confirmation them.
So, not only the long-term analogy doesn’t invalidate the scenario in which silver moves temporarily higher before sliding much lower – it actually confirms it.
While we’re discussing long-term analogies, let’s take a look at the one in gold.
Gold’s Monthly Candlestick and their Implications
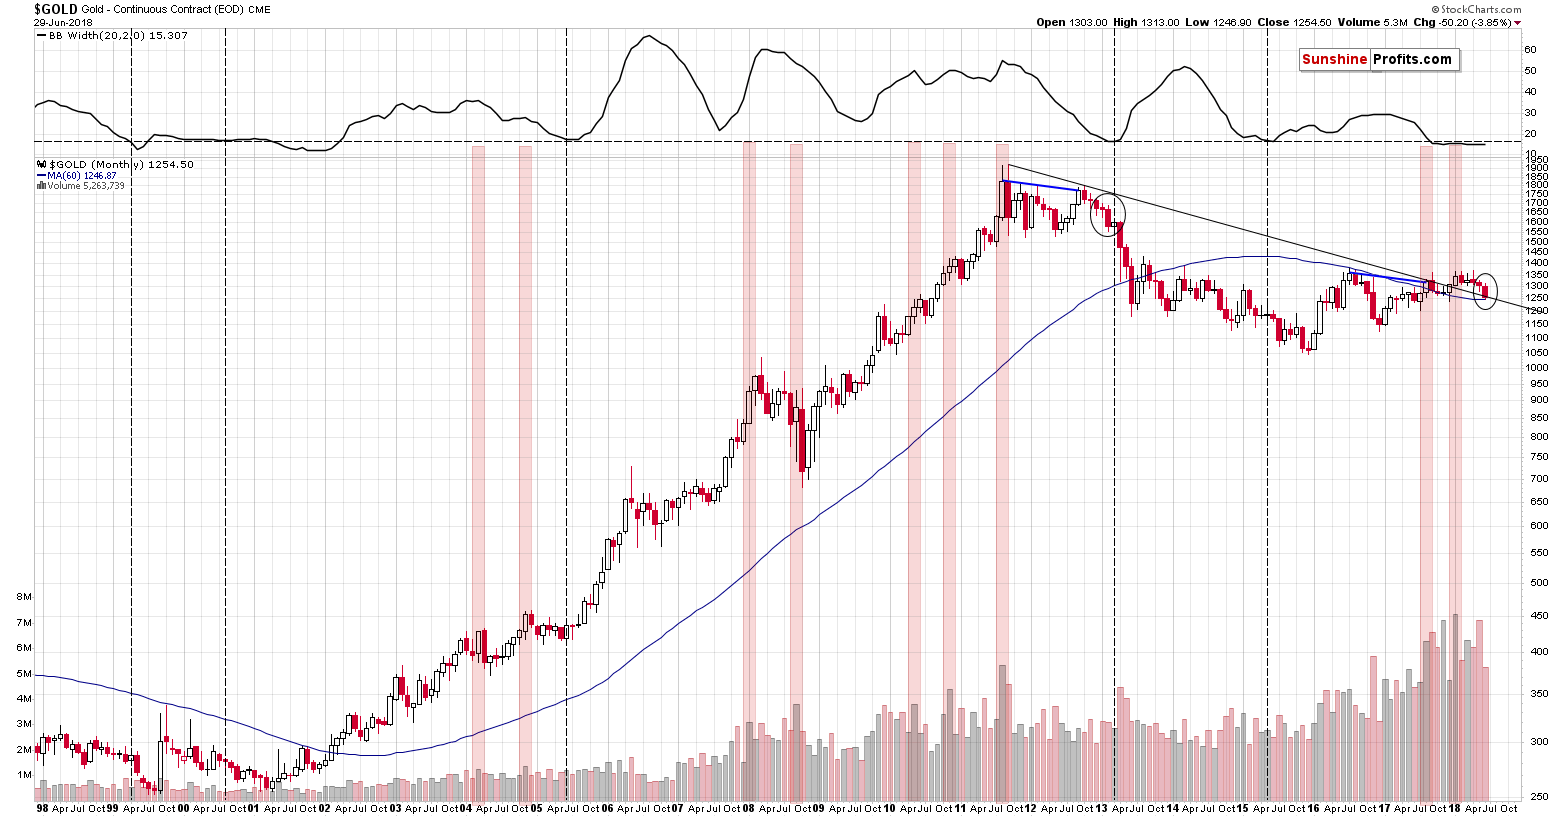
The similarity between the 2012-2013 decline and the current situation remains in place even though the current decline got delayed by exceptional decline in the USD Index in late 2017 and early 2018. In the last few weeks the decline gained momentum and it was the first month after the initial reversal when it declined in a visible manner (over $50).
This makes June analogous to February 2013. You know what happened next? We saw a corrective upswing and the mother of all declines started in April. The 1:1 interpretation would be that we’ll see a corrective upswing in July and a powerful decline in August.
So, is gold likely to rally in July?
It’s likely to rally in the first half of July and the outlook for the second part is more bearish than bullish. While we can’t see it on the above chart, the March 2013 upswing consisted of only 2 weekly upswings. If the first of them is beginning today, then the direct analogy to the past makes only a short-term rally likely – nothing more. It also suggests that we should be prepared for seeing bearish signs and confirmations in about two weeks. Naturally, the situation doesn’t have to repeat itself to the latter and we’ll be looking for bearish signs at all times, but based on the above it does seem to makes sense to give more value to signs that will emerge on or after 10th of July or so.
But, can gold move considerably higher despite a move higher in the USDX? Yes, but it’s not something that is likely or expected to happen often. So, perhaps the USD is about to take a breather as well?
Pause in USD’s Rally
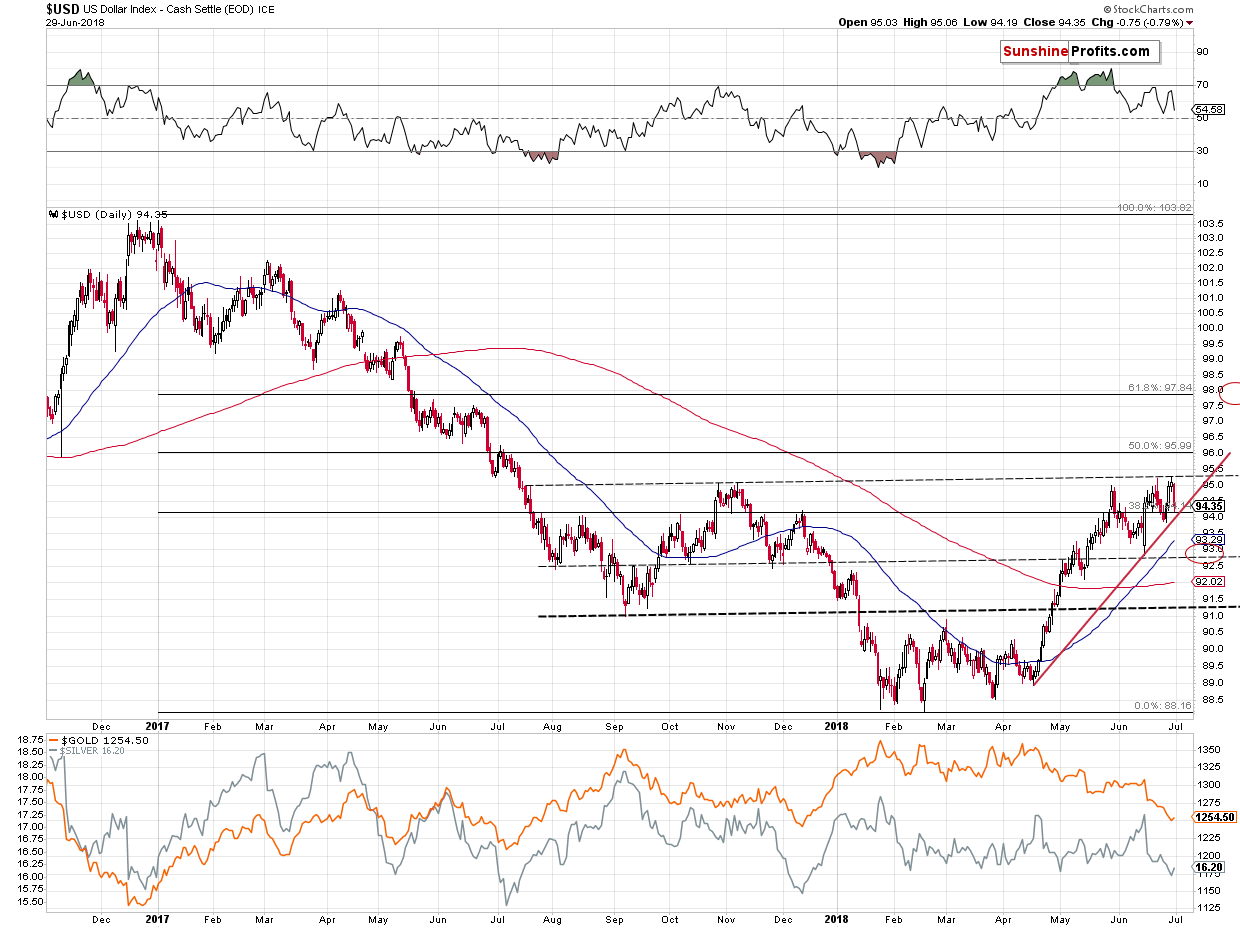
So far the April – June rally is symmetrical to the November 2017 – January 2018 decline in terms of the overall pace at which the moves took place and – more or less – the price levels that were reached.
If this symmetry continues to a big extent, then we may see a move to or a bit below 91.5, or – if the symmetry continues to a limited extent – a move to about 92.75 (approximately the June bottom).
The latter scenario seems more likely because of two factors:
- Gold was a bit above $1,300, when USD bottomed in June
- The analogy to 2014-2015 rally remains in place and a bigger decline seems unlikely in its light.
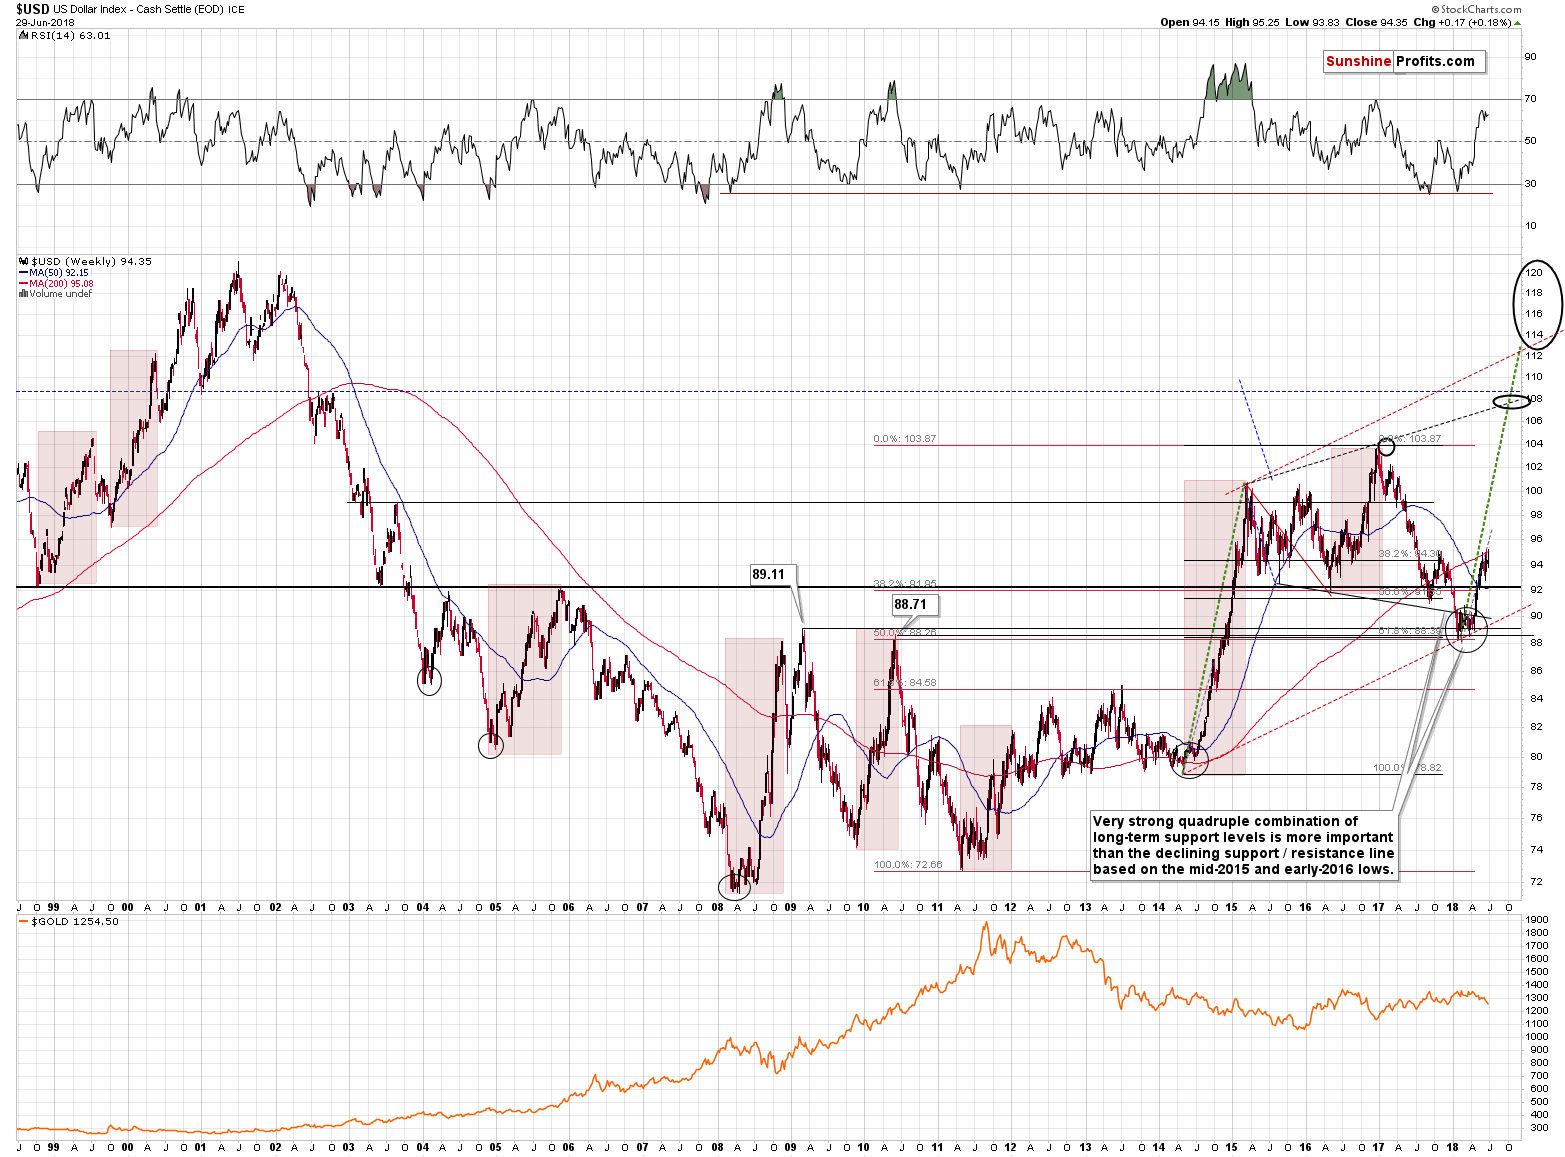
Seeing a move to the previous low would not change the long-term picture much, but a move to the September 2017 low would. Naturally, it’s not guaranteed that both rallies will be almost identical, but since there were very similar so far, it seems likely that the similarity will continue to a considerable extent.
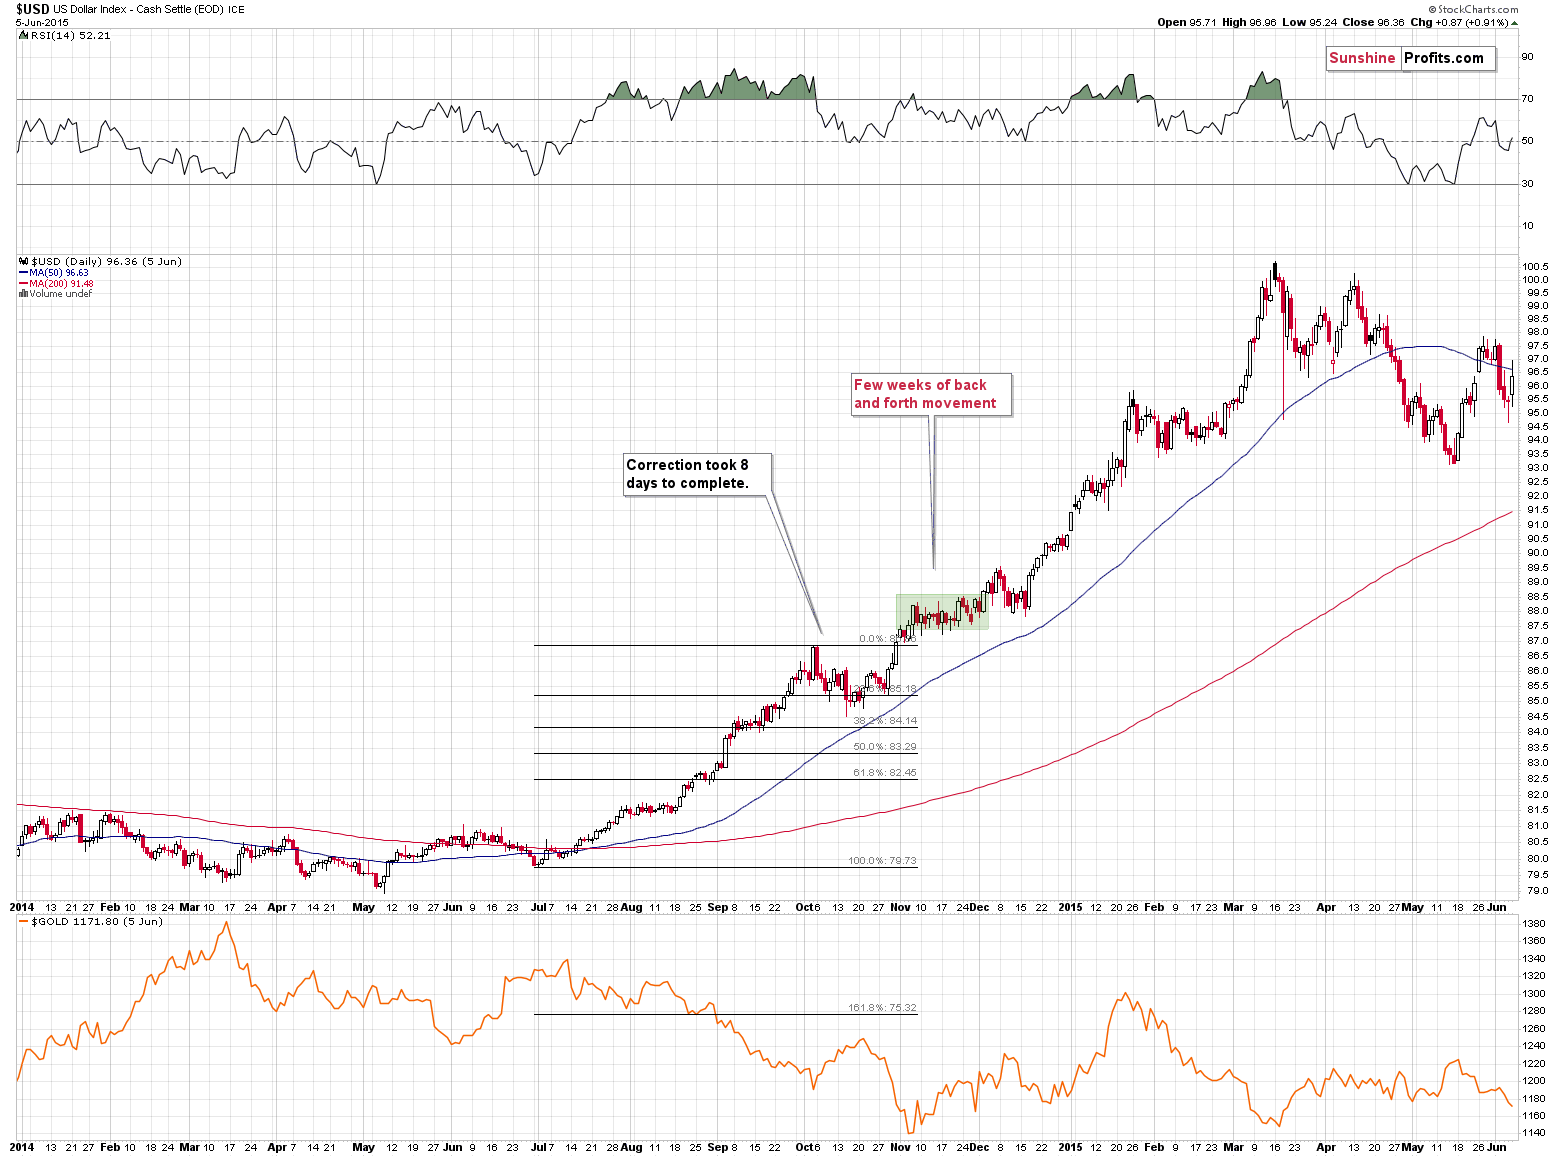
Plus, if you take a closer look at what happened in 2014, you’ll see that after USD broke above the initial top (analogous to the late May 2018 top) it corrected and then broke above it about one month later. Then it moved back and forth for a few weeks before the rally continued.
Now, if the analogy remains in place, it seems that we are at the time when the USD Index is about to trade back and forth. While in 2014 it didn’t mean a move back below the initial top, the current consolidation doesn’t have to be 100% identical. We could see a different kind thereof and as long as it doesn’t deviate too much from the 2014 analogy, the very bullish implications of the latter will remain in place.
In other words, a move to 95.75 or so would likely not invalidate the similarity to what happened in 2014 as it seems to be within the “normal range” or what might be different during such a long-term analogy.
Summary
Summing up, gold and silver reached our downside targets very close to several reversal dates and it was accompanied by numerous bullish confirmations, which makes the current short-term outlook very bullish. The medium-term outlook remains bearish, but there are so many bullish signs for the short term that we think that a big temporary long position is justified anyway. In fact, based on Friday’s strength in the mining stocks, we decided to increase the size of our speculative trading position to 200% of the regular size of the position. We are also moving our initial target levels higher.
As always, we’ll keep you – our subscribers – informed.
To summarize:
Trading capital (supplementary part of the portfolio; our opinion): Full long positions (200% of the full position) in gold, silver and mining stocks are justified from the risk/reward perspective with the following stop-loss orders and initial target price levels:
- Gold: initial target price: $1,298; stop-loss: $1,239; initial target price for the UGLD ETN: $10.37; stop-loss for the UGLD ETN $8.97
- Silver: initial target price: $16.72; stop-loss: $15.88; initial target price for the USLV ETN: $10.47; stop-loss for the USLV ETN $8.78
- Mining stocks (price levels for the GDX ETF): initial target price: $22.97; stop-loss: $21.47; initial target price for the NUGT ETF: $26.17; stop-loss for the NUGT ETF $21.84
In case one wants to bet on junior mining stocks' prices (we do not suggest doing so – we think senior mining stocks are more predictable in the case of short-term trades – but if one wants to do it anyway, we provide the details), here are the stop-loss details and initial target prices:
- GDXJ ETF: initial target price: $33.57; stop-loss: $31.58
- JNUG ETF: initial target price: $14.58 stop-loss: $12.38
Long-term capital (core part of the portfolio; our opinion): No positions (in other words: cash)
Insurance capital (core part of the portfolio; our opinion): Full position
Important Details for New Subscribers
Whether you already subscribed or not, we encourage you to find out how to make the most of our alerts and read our replies to the most common alert-and-gold-trading-related-questions.
Please note that the in the trading section we describe the situation for the day that the alert is posted. In other words, it we are writing about a speculative position, it means that it is up-to-date on the day it was posted. We are also featuring the initial target prices, so that you can decide whether keeping a position on a given day is something that is in tune with your approach (some moves are too small for medium-term traders and some might appear too big for day-traders).
Plus, you might want to read why our stop-loss orders are usually relatively far from the current price.
Please note that a full position doesn’t mean using all of the capital for a given trade. You will find details on our thoughts on gold portfolio structuring in the Key Insights section on our website.
As a reminder – “initial target price” means exactly that – an “initial” one, it’s not a price level at which we suggest closing positions. If this becomes the case (like it did in the previous trade) we will refer to these levels as levels of exit orders (exactly as we’ve done previously). Stop-loss levels, however, are naturally not “initial”, but something that, in our opinion, might be entered as an order.
Since it is impossible to synchronize target prices and stop-loss levels for all the ETFs and ETNs with the main markets that we provide these levels for (gold, silver and mining stocks – the GDX ETF), the stop-loss levels and target prices for other ETNs and ETF (among other: UGLD, DGLD, USLV, DSLV, NUGT, DUST, JNUG, JDST) are provided as supplementary, and not as “final”. This means that if a stop-loss or a target level is reached for any of the “additional instruments” (DGLD for instance), but not for the “main instrument” (gold in this case), we will view positions in both gold and DGLD as still open and the stop-loss for DGLD would have to be moved lower. On the other hand, if gold moves to a stop-loss level but DGLD doesn’t, then we will view both positions (in gold and DGLD) as closed. In other words, since it’s not possible to be 100% certain that each related instrument moves to a given level when the underlying instrument does, we can’t provide levels that would be binding. The levels that we do provide are our best estimate of the levels that will correspond to the levels in the underlying assets, but it will be the underlying assets that one will need to focus on regarding the signs pointing to closing a given position or keeping it open. We might adjust the levels in the “additional instruments” without adjusting the levels in the “main instruments”, which will simply mean that we have improved our estimation of these levels, not that we changed our outlook on the markets. We are already working on a tool that would update these levels on a daily basis for the most popular ETFs, ETNs and individual mining stocks.
Our preferred ways to invest in and to trade gold along with the reasoning can be found in the how to buy gold section. Additionally, our preferred ETFs and ETNs can be found in our Gold & Silver ETF Ranking.
As a reminder, Gold & Silver Trading Alerts are posted before or on each trading day (we usually post them before the opening bell, but we don't promise doing that each day). If there's anything urgent, we will send you an additional small alert before posting the main one.
=====
Latest Free Trading Alerts:
Stocks failed to continue their short-term rebound on Friday and they closed virtually flat. The S&P 500 index extended its short-term consolidation, as it remained above the level of 2,700 on the last trading day of the month and the quarter. But was it a bottoming pattern or just some flat correction before another leg lower? There are still two possible medium-term scenarios.
=====
Hand-picked precious-metals-related links:
PRECIOUS-Gold prices edge lower as dollar firms
Millennials Loosen Gold’s Grip As Premier Store Of Indian Wealth
Gold Repatriation Could Be Sign of Things to Come
Perth Mint's June gold sales rise, silver sales plunge
Gold, Silver Plunge in First Half of 2018; US Mint Bullion Sales Drop
=====
In other news:
Investors seek cover as trade battles rattle world markets
World shares slide on trade war, German coalition concerns
Beating expectations, euro zone unemployment stable in May
U.S. Backs Off Trump Tweet on Saudis Helping Lower Oil Price
Draft admin proposal would allow Trump to ignore key WTO principles
The EU Is Preparing Enormous New Tariffs on U.S. Goods if Trump Follows Through on His Cars Threat
Mexican populist López Obrador triumphs in presidential race
=====
Thank you.
Sincerely,
Przemyslaw Radomski, CFA
Founder, Editor-in-chief, Gold & Silver Fund Manager
Gold & Silver Trading Alerts
Forex Trading Alerts
Oil Investment Updates
Oil Trading Alerts

