

Briefly: in our opinion, full (300% of the regular position size) speculative short positions in mining stocks are justified from the risk/reward point of view at the moment of publishing this Alert.
Another day, another bearish indication from gold stocks – that’s how yesterday’s session could be summarized.
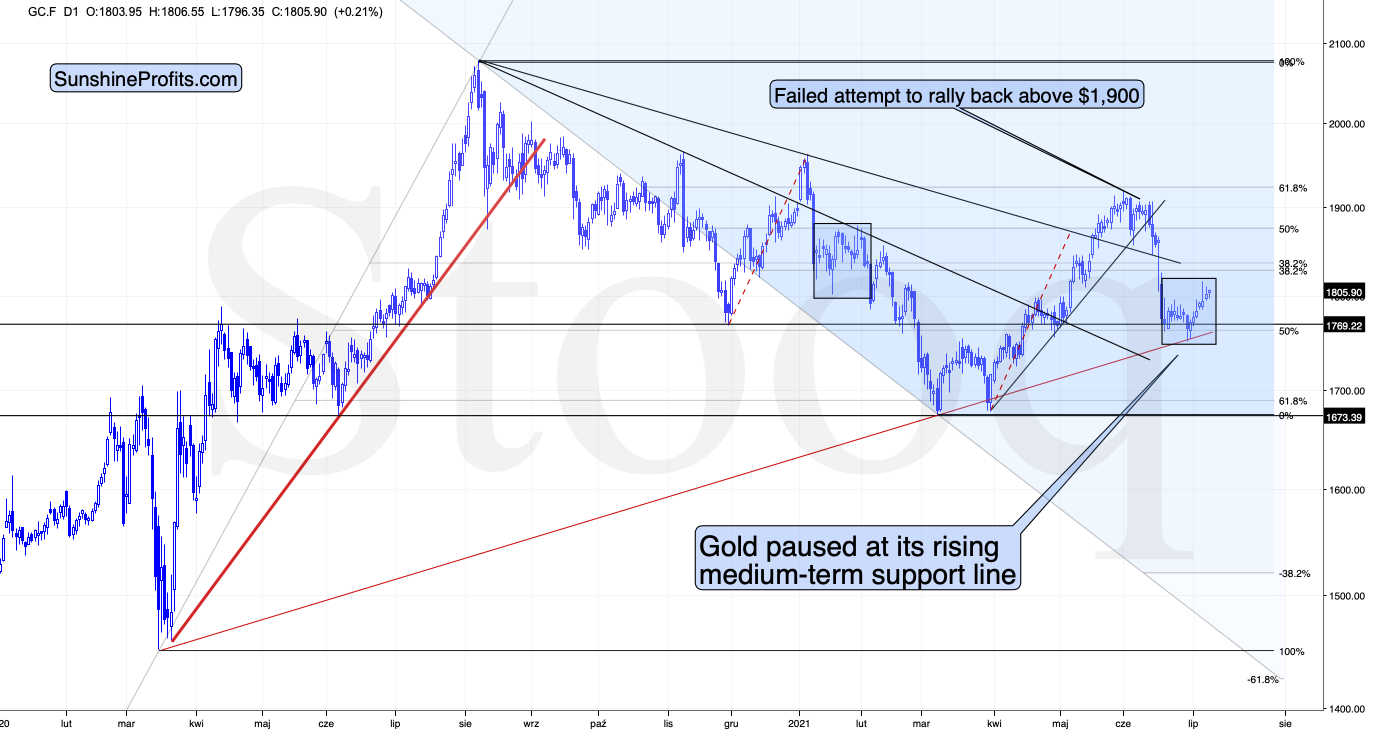
Gold futures didn’t move to new intraday highs, but it did end the session $7.90 higher. Because of the intraday reversal, yesterday’s session could once again (just as the one on Tuesday) be described as a bearish shooting star reversal.
Consequently, the implications of what I wrote yesterday remain up-to-date:
In fact, the rally ended even before the closing bell, as gold futures reversed their course and ended the session only $10.90 higher (after being even ~$20 higher intraday). This price action created a bearish reversal candlestick called the shooting star. Such candlesticks tend to be important if they form on relatively big volume. And indeed, yesterday’s volume was relatively big, which means that the implications are bearish.
Well, they were bearish even before yesterday’s session, but seeing the bearish confirmations adds credibility to the bearish narrative.
Another detail that serves as a bearish confirmation is the performance of mining stocks.
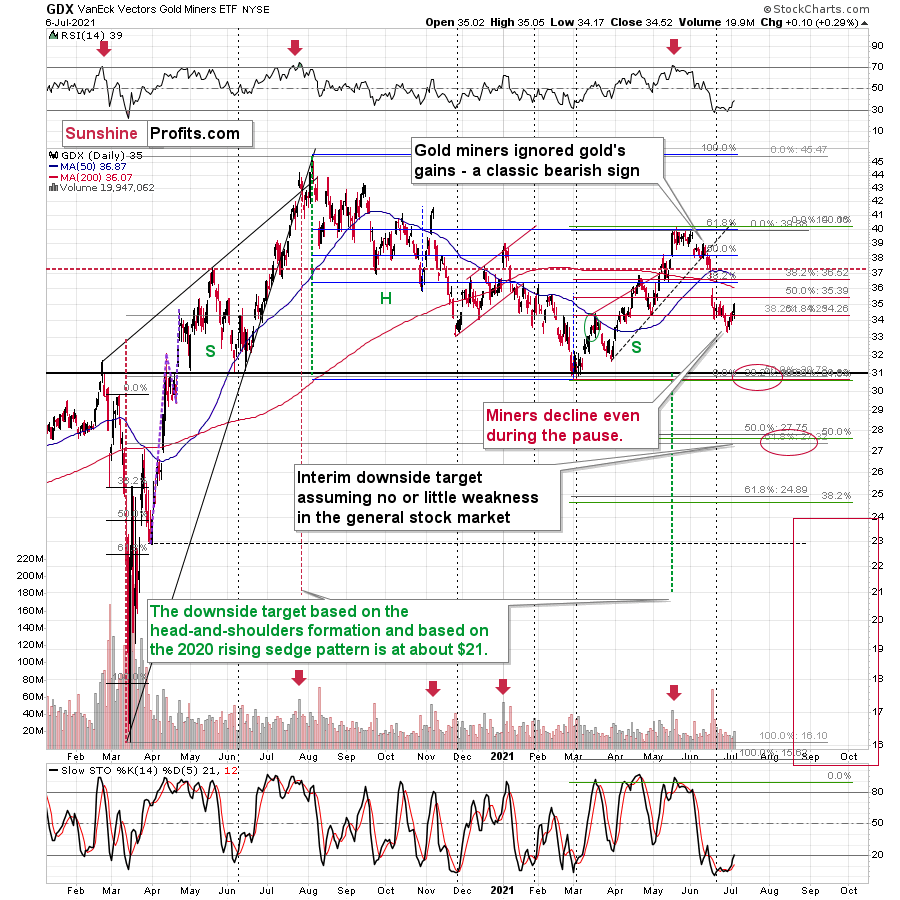
The senior gold stocks were – once again – barely up yesterday. While the senior miners moved slightly higher, the junior miners – also once again – declined. It’s visible most clearly on the 4-hour chart.
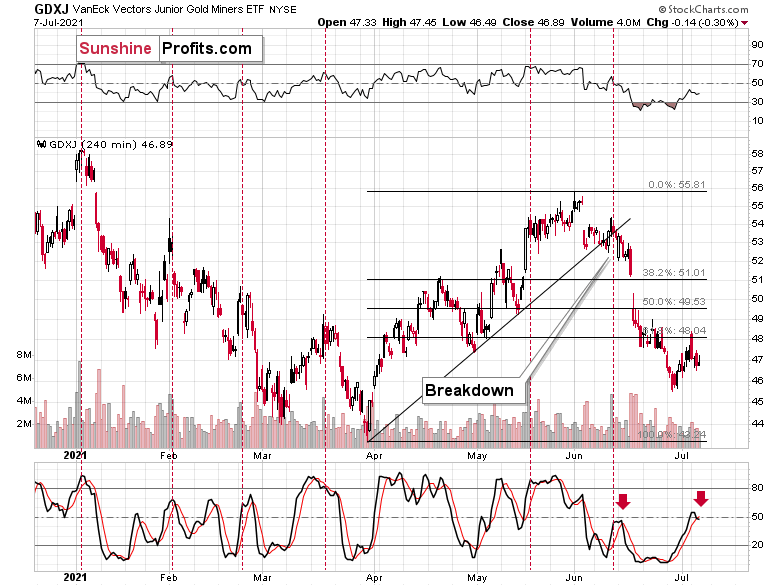
After an intraday attempt to rally back above its recent low, the GDXJ turned south once again and ended the session lower.
Moreover, please note that the indicators now support another short-term downswing. The RSI (upper part of the above chart) is no longer oversold, and we just saw a fresh sell signal from the Stochastic indicator (based on the 4-hour candlestick chart, that is).
I’ve already written why the junior mining stocks’ bearish potential is bigger than the one of the senior miners, and yesterday’s session provides yet another confirmation.
The situation in the USD Index is quite specific as well.
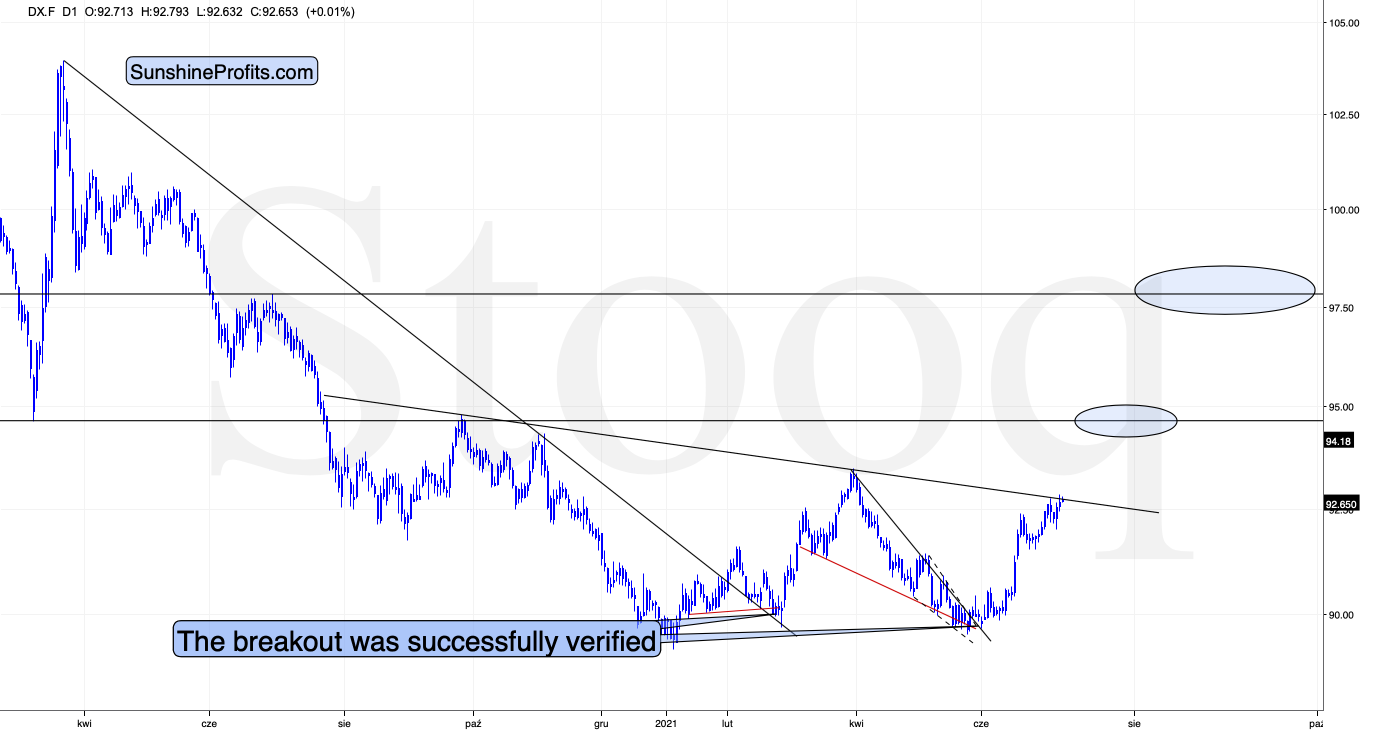
On one hand, we have the situation in which the USDX is just below medium-term resistance line, so it suggests some difficulty in moving higher from here. On the other hand, we see that the USDX has already corrected and rallied back up immediately. This could be a sign that it’s ready to break above the neck level of the pattern. This would be a major development as the target based on the head and shoulders pattern is equal to the size of the head (I marked it with green, dashed lines). The breakout here would, therefore, imply a move to about 98 – to approximately the late-June 2020 highs.
Naturally, the above would be very bearish for gold and the rest of the precious metals sector.
It seems quite likely that the USD Index will break higher, if not soon, then shortly. And when that happens gold would be likely to slide to its previous 2021 lows. That’s where we might see another short-term rebound – before the huge price plunge to $1,500 or lower.
Gold stocks’ performance suggests that the precious metals sector is ready for another huge slide, regardless of whether gold moves $10 or $20 higher on a very temporary basis.
Having said that, let’s take a look at the market from the fundamental angle.
Flatten Away
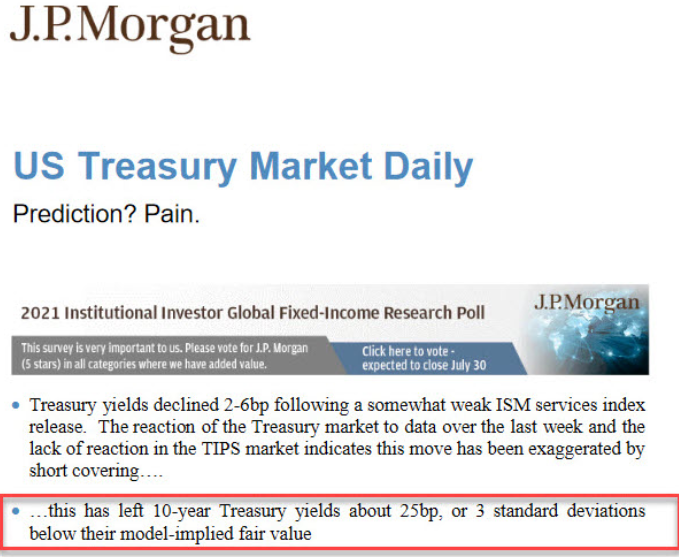
With the reflation trade getting cut off at the knees, the only asset class not feeling the pain is U.S. equities. However, while shorts capitulate and send the U.S. 10-Year Treasury higher (and the yield lower), the flattening of the U.S. yield curve screams of a potential recession. However, while the development is bullish for the USD Index and bearish for the PMs, investors are putting the cart before the horse.
To explain, while the U.S. 10-Year Treasury yield languishes in its depressed state, J.P. Morgan told clients on Jul. 6 that the Treasury benchmark is roughly three standard deviations below its model-implied fair value. For context, J.P. Morgan believes that the U.S. 10-Year Treasury yield should trade at roughly 1.60%, and, given the three-sigma underperformance, standard normal probabilities imply a roughly 99.9% chance that the Treasury benchmark will move higher over the medium term.
Please see below:
However, while the bond market ‘wants what it wants’, it’s important to remember that a flattening of the U.S. yield curve has the same effect on the PMs. For example, while I’ve been warning for months that the U.S. Federal Reserve (FED) will likely taper its asset purchases much sooner than investors expect, the minority view is now the consensus. And with that, the hawkish shift reduces inflation expectations, reduces growth expectations and often results in lower long-term interest rates. However, while the U.S. 10-Year Treasury yield still remains significantly undervalued in our view, ‘the ghost of tapering past’ has investors aiming to front-run a September reveal.
As evidence, the FED released the minutes from its Jun. 15/16 policy meeting on Jul. 7. An excerpt from the report read:
“Various participants mentioned that they expected the conditions for beginning to reduce the pace of asset purchases to be met somewhat earlier than they had anticipated at previous meetings in light of in-coming data.”
And surprise, surprise, while I’ve been warning for some time that surging inflation will likely force the FED’s hand, the report revealed:
 Source: U.S. FED
The Container War
But with long-term yields signaling the death of inflation, is a regime shift already underway? Well, I warned previously that inflationary pressures are unlikely to abate anytime soon:
I wrote:
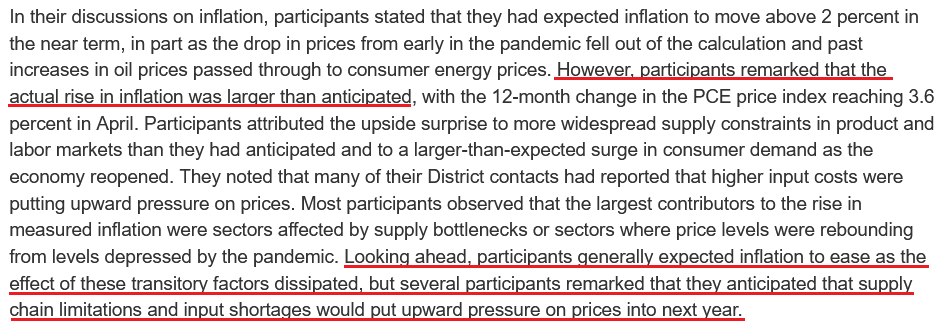
With the U.S. Census Bureau revealing on Jun. 8 that U.S. imports from China (goods) totaled nearly $38 billion in April, more and more data signals that the U.S. economy will continue to feel the inflationary burn. Shipping costs are also exploding at an unprecedented rate.
Please see below:
To explain, the lines above track the shipping costs to-and-from various regions. If you analyze the dark blue line sandwiched in the middle ($6.5K), average shipping costs continue to skyrocket. Moreover, if you’re shipping from Shanghai to Rotterdam, New York or Genca, global businesses are nowhere near solving these “transitory” issues.
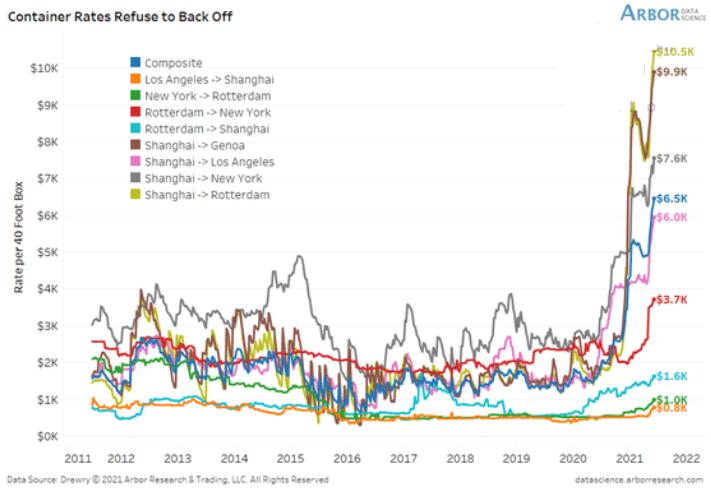
And providing another update on Jun. 28, the situation has only worsened.
To explain, if you compare the first chart to the one directly above, you can see that the composite container rate (the dark blue line) has increased from $6.5K to $8.1K in only two weeks. What’s more, shipping from Shanghai to Rotterdam (the gold line) has increased from $10.5K to $12.0k, while Shanghai to New York (the gray line) has risen from $7.6K to $11.2K. As a result, does it seem like inflationary pressures are a thing of the past?
To that point, with the old adage implying that ‘the third time’s the charm,’ the surge lives on.
Please see below:
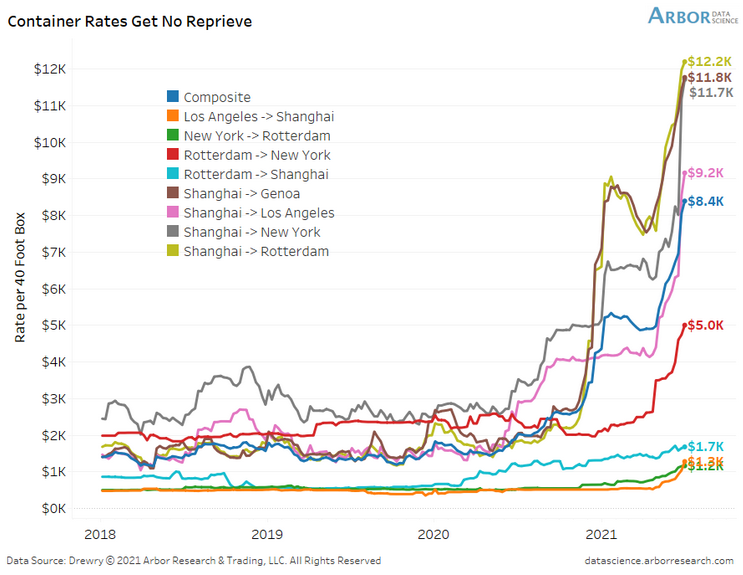
To explain, the composite container rate has now gone from $6.5K through $8.1K to $8.4K in less than a month. And with shipping costs from China (Shanghai) leading the charge, the FED’s “transitory” narrative still lacks empirical credibility.
To that point, can you guess which trading partner accounts for 17.3% of U.S. imports?
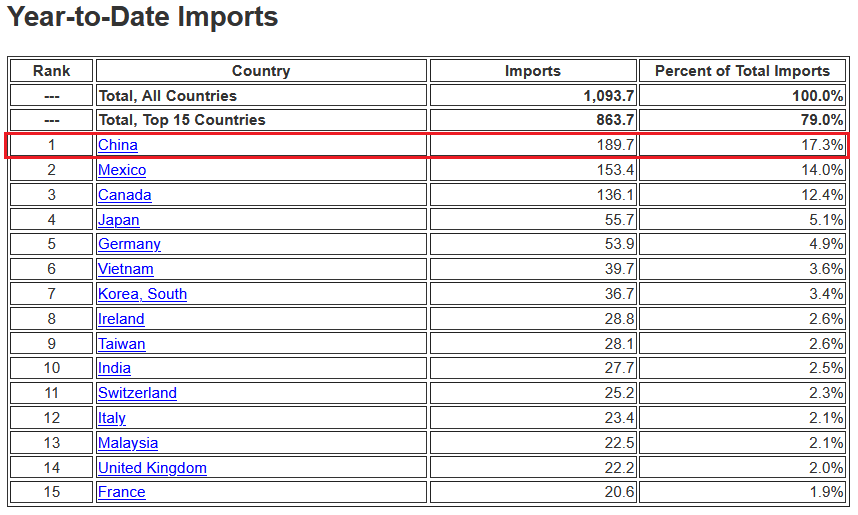 Source: U.S. Census Bureau
The bottom line? While the bond market may ‘wish upon a star,’ inflationary pressures are unlikely to subside until the FED tapers its asset purchases (and/or raises interest rates).
What Can the Services PMI Tell Us?
As further evidence, the Institute for Supply Management (ISM) released its services PMI on Jul. 6. And while the headline index declined from 64 in May (an all-time high) to 60.1 in June, inflation remained abundant:
“Prices paid by service organizations for materials and services increased in June, with the index registering 79.5 percent, 1.1 percentage points lower than May’s reading of 80.6 percent. 17 services industries reported an increase in prices paid during the month of June … [with] only [one] industry reporting a decrease.”
In addition, ISM Chair Anthony Nieves added:
“According to the Services PMI, 16 services industries [out of 18] reported growth. The composite index indicated growth for the 13th consecutive month after a two-month contraction in April and May 2020. The rate of expansion in the services sector remains strong, despite the slight pullback in the rate of growth from the previous month’s all-time high. Challenges with materials shortages, inflation, logistics and employment resources continue to be an impediment to business conditions.”
For context, the ISM requires written permission before redistributing any of its content, and that’s why I quoted the findings rather than including a screenshot of the report. However, if you want to review the source material, you can find it here.
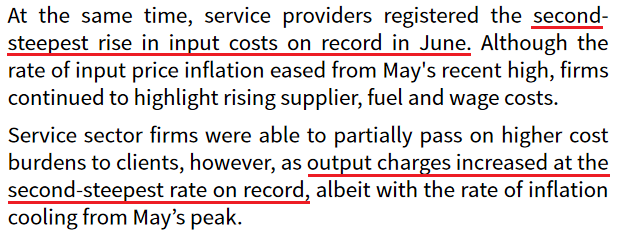
Likewise, IHS Markit also released its U.S. services PMI on Jul. 6. An excerpt from the report read:
“Contributing to the robust rise in activity across the service sector was a further marked increase in new business at the end of the second quarter. Alongside strong customer demand, firms attributed the upturn in new sales to the acquisition of new clients. Although the rate of new business growth slipped to a three-month low, it was still the third-fastest on record.”
And following right along:
 Source: IHS Markit
Furthermore, while oil prices have surged in 2021 so far, major companies haven’t increased their capital investments. As a result, not only are U.S. crude oil inventories still ~6% below their historical average (as of Jun. 30), but dormant supply could put upward pressure on prices in the coming months.
Please see below:
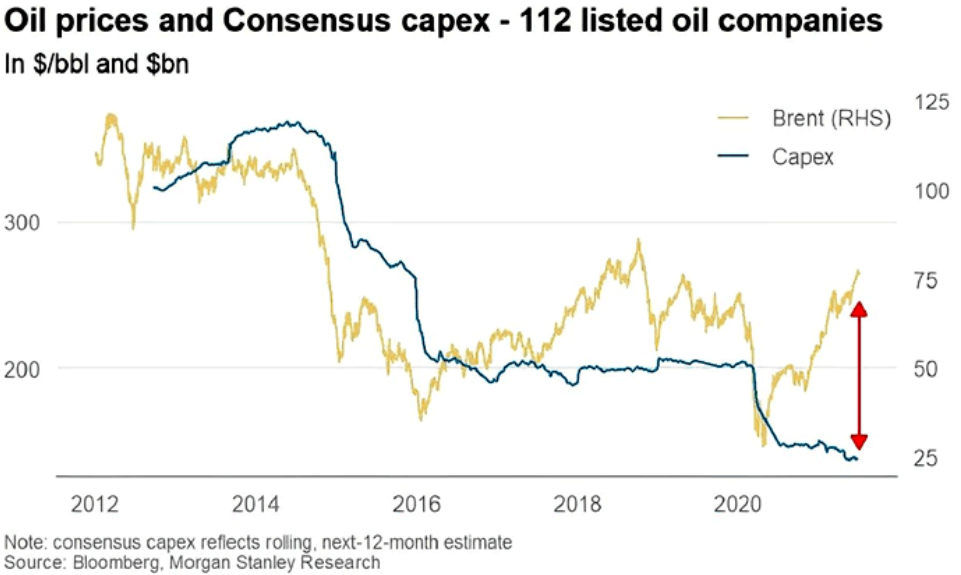
To explain, the gold line above tracks the Brent price, while the blue line above tracks major oil companies’ capital expenditures. If you analyze the right side of the chart, you can see that investments in drilling infrastructure have fallen off a cliff. And with demand likely to remain abundant as economies reopen, fuel, gasoline and heating oil prices will likely remain elevated.
The Swagger of the USDX
Finally, with the USD Index regaining its swagger and the EUR/USD falling from grace, the cocktail of a hawkish FED and fundamental underperformance is weighing heavily on the euro. Moreover, with growth differentials poised to widen in the coming months, U.S. dollar strength could cast a dark shadow over the PMs.
Please see below:
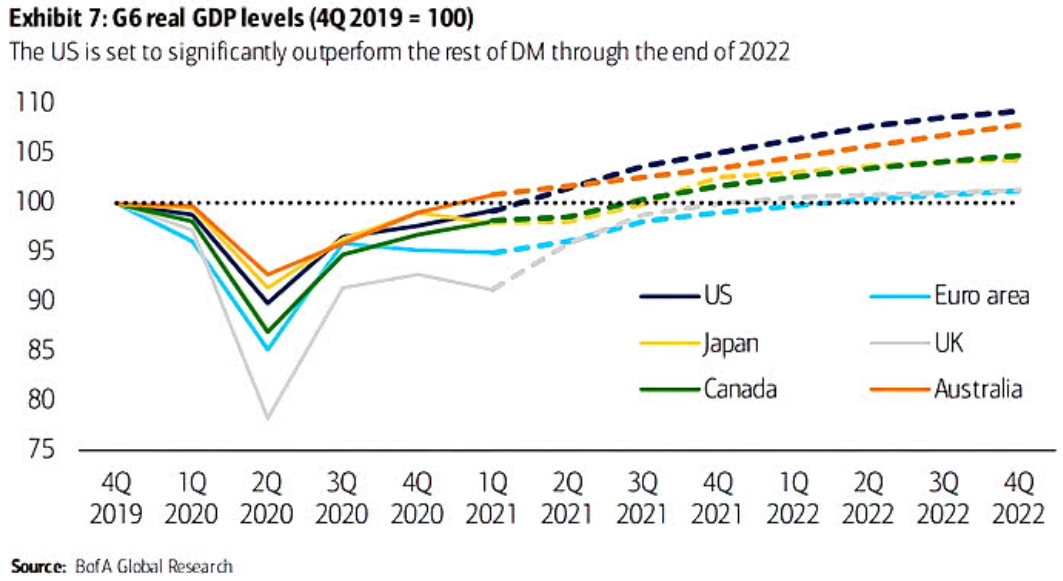
To explain, the various lines above track Bank of America’s quarterly projections for G6 real GDP levels. If you focus your attention on the dark blue (U.S.) and light blue (Eurozone) lines, you can see that the former is leading the pack, while the latter is vying for the last place. On top of that, the U.S.’s projected outperformance of Japan, Canada, and the U.K. is bullish for the USD/JPY and the USD/CAD but bearish for the GBP/USD.
In conclusion, while the PMs remain upbeat, it’s likely another case of ‘been there, done that.’ For example, it was roughly four months ago that falling real yields helped uplift gold before it eventually collapsed. And with a similar event unfolding once again, gold has demonstrated rational (though, superficial) strength. However, with the clock ticking toward a taper announcement and the USD Index rising from the ashes, the corrective upswing is likely another head fake within gold’s medium-term downtrend.
Overview of the Upcoming Part of the Decline
- The barely visible corrective upswing in gold might already be over, and another huge decline is likely just around the corner.
- After miners slide in a meaningful and volatile way, but silver doesn’t (and it just declines moderately), I plan to switch from short positions in miners to short positions in silver. At this time, it’s too early to say at what price levels this would take place – perhaps with gold close to $1,600. I plan to exit those short positions when gold shows substantial strength relative to the USD Index, while the latter is still rallying. This might take place with gold close to $1,350 - $1,500 and the entire decline (from above $1,900 to about $1,475) would be likely to take place within 6-20 weeks, and I would expect silver to fall the hardest in the final part of the move. This moment (when gold performs very strongly against the rallying USD and miners are strong relative to gold – after gold has already declined substantially) is likely to be the best entry point for long-term investments, in my view. This might also happen with gold close to $1,475, but it’s too early to say with certainty at this time.
- As a confirmation for the above, I will use the (upcoming or perhaps we have already seen it?) top in the general stock market as the starting point for the three-month countdown. The reason is that after the 1929 top, gold miners declined for about three months after the general stock market started to slide. We also saw some confirmations of this theory based on the analogy to 2008. All in all, the precious metals sector would be likely to bottom about three months after the general stock market tops.
- The above is based on the information available today, and it might change in the following days/weeks.
Please note that the above timing details are relatively broad and “for general overview only” – so that you know more or less what I think and how volatile I think the moves are likely to be – on an approximate basis. These time targets are not binding or clear enough for me to think that they should be used for purchasing options, warrants or similar instruments.
Summary
To summarize, even though gold could still move somewhat higher in the near term, it seems that having a short position in the junior mining stocks is much more justified from the risk-to-reward point of view than having a long one in any part of the precious metals market. Gold miners’ underperformance along with a self-similar pattern in the USD Index (pointing to the breather being over) and the length of the “bottoming” process in gold that no longer resembles a bottom (but rather a pause within a slide) all make the bearish outlook justified from the risk-to-reward point of view.
After the sell-off (that takes gold to about $1,350 - $1,500), I expect the precious metals to rally significantly. The final part of the decline might take as little as 1-5 weeks, so it's important to stay alert to any changes.
Most importantly, please stay healthy and safe. We made a lot of money last March and this March, and it seems that we’re about to make much more on the upcoming decline, but you have to be healthy to enjoy the results.
As always, we'll keep you - our subscribers - informed.
By the way, we’re currently providing you with a possibility to extend your subscription by a year, two years or even three years with a special 20% discount. This discount can be applied right away, without the need to wait for your next renewal – if you choose to secure your premium access and complete the payment upfront. The boring time in the PMs is definitely over and the time to pay close attention to the market is here. Naturally, it’s your capital, and the choice is up to you, but it seems that it might be a good idea to secure more premium access now, while saving 20% at the same time. Our support team will be happy to assist you in the above-described upgrade at preferential terms – if you’d like to proceed, please contact us.
To summarize:
Trading capital (supplementary part of the portfolio; our opinion): Full speculative short positions (300% of the full position) in mining stocks are justified from the risk to reward point of view with the following binding exit profit-take price levels:
Mining stocks (price levels for the GDXJ ETF): binding profit-take exit price: $24.12; stop-loss: none (the volatility is too big to justify a stop-loss order in case of this particular trade)
Alternatively, if one seeks leverage, we’re providing the binding profit-take levels for the JDST (2x leveraged) and GDXD (3x leveraged – which is not suggested for most traders/investors due to the significant leverage). The binding profit-take level for the JDST: $39.87; stop-loss for the JDST: none (the volatility is too big to justify a SL order in case of this particular trade); binding profit-take level for the GDXD: $94.87; stop-loss for the GDXD: none (the volatility is too big to justify a SL order in case of this particular trade).
For-your-information targets (our opinion; we continue to think that mining stocks are the preferred way of taking advantage of the upcoming price move, but if for whatever reason one wants / has to use silver or gold for this trade, we are providing the details anyway.):
Silver futures upside profit-take exit price: unclear at this time - initially, it might be a good idea to exit, when gold moves to $1,512.
Gold futures upside profit-take exit price: $1,512.
Long-term capital (core part of the portfolio; our opinion): No positions (in other words: cash
Insurance capital (core part of the portfolio; our opinion): Full position
Whether you already subscribed or not, we encourage you to find out how to make the most of our alerts and read our replies to the most common alert-and-gold-trading-related-questions.
Please note that we describe the situation for the day that the alert is posted in the trading section. In other words, if we are writing about a speculative position, it means that it is up-to-date on the day it was posted. We are also featuring the initial target prices to decide whether keeping a position on a given day is in tune with your approach (some moves are too small for medium-term traders, and some might appear too big for day-traders).
Additionally, you might want to read why our stop-loss orders are usually relatively far from the current price.
Please note that a full position doesn't mean using all of the capital for a given trade. You will find details on our thoughts on gold portfolio structuring in the Key Insights section on our website.
As a reminder - "initial target price" means exactly that - an "initial" one. It's not a price level at which we suggest closing positions. If this becomes the case (like it did in the previous trade), we will refer to these levels as levels of exit orders (exactly as we've done previously). Stop-loss levels, however, are naturally not "initial", but something that, in our opinion, might be entered as an order.
Since it is impossible to synchronize target prices and stop-loss levels for all the ETFs and ETNs with the main markets that we provide these levels for (gold, silver and mining stocks - the GDX ETF), the stop-loss levels and target prices for other ETNs and ETF (among other: UGL, GLL, AGQ, ZSL, NUGT, DUST, JNUG, JDST) are provided as supplementary, and not as "final". This means that if a stop-loss or a target level is reached for any of the "additional instruments" (GLL for instance), but not for the "main instrument" (gold in this case), we will view positions in both gold and GLL as still open and the stop-loss for GLL would have to be moved lower. On the other hand, if gold moves to a stop-loss level but GLL doesn't, then we will view both positions (in gold and GLL) as closed. In other words, since it's not possible to be 100% certain that each related instrument moves to a given level when the underlying instrument does, we can't provide levels that would be binding. The levels that we do provide are our best estimate of the levels that will correspond to the levels in the underlying assets, but it will be the underlying assets that one will need to focus on regarding the signs pointing to closing a given position or keeping it open. We might adjust the levels in the "additional instruments" without adjusting the levels in the "main instruments", which will simply mean that we have improved our estimation of these levels, not that we changed our outlook on the markets. We are already working on a tool that would update these levels daily for the most popular ETFs, ETNs and individual mining stocks.
Our preferred ways to invest in and to trade gold along with the reasoning can be found in the how to buy gold section. Furthermore, our preferred ETFs and ETNs can be found in our Gold & Silver ETF Ranking.
As a reminder, Gold & Silver Trading Alerts are posted before or on each trading day (we usually post them before the opening bell, but we don't promise doing that each day). If there's anything urgent, we will send you an additional small alert before posting the main one.
Thank you.
Przemyslaw Radomski, CFA
Founder, Editor-in-chief

