

Briefly: in our opinion, full (300% of the regular position size) speculative short positions in mining stocks are justified from the risk/reward point of view at the moment of publishing this Alert.
I started yesterday’s analysis by writing that while we might see a small pop-up higher in gold, it’s unlikely to last.
That’s exactly what happened, and the bearish outlook remains intact.
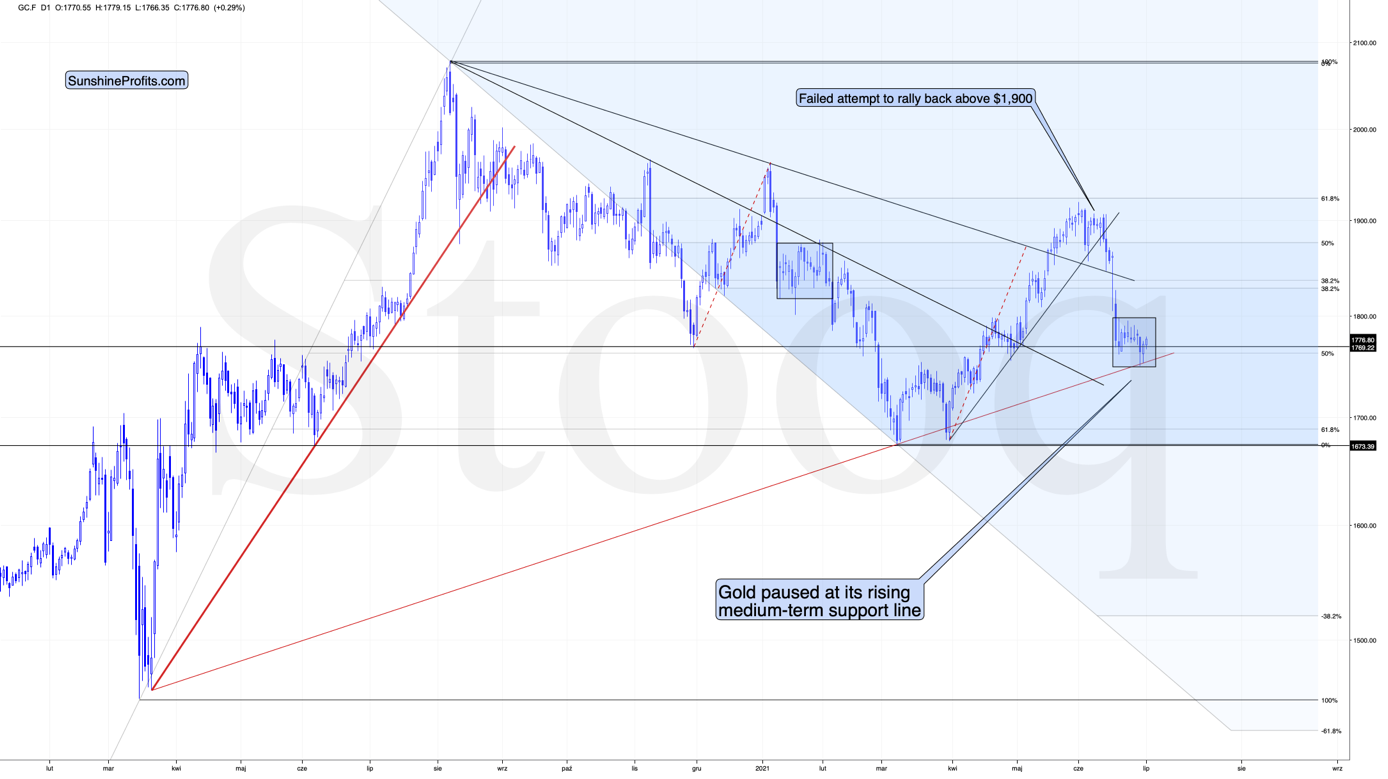
Gold moved a little higher when it reached the rising support line based on its previous important lows. The possible rebound was likely to take place based on this single development, and we’re seeing it right now. What does this change? Well, nothing. The technical bounce is a normal phenomenon and – by itself – doesn’t tell us that the decline is over.
In fact, if you look at what happened in January, you will see that the price of gold is developing in the same way now. And what happened then? Gold declined substantially. This time, it’s likely to fall even more in the following months.
Let’s keep in mind that while gold moved higher after reaching this support line, it already broke below a more important line, and it’s currently verifying this breakdown.
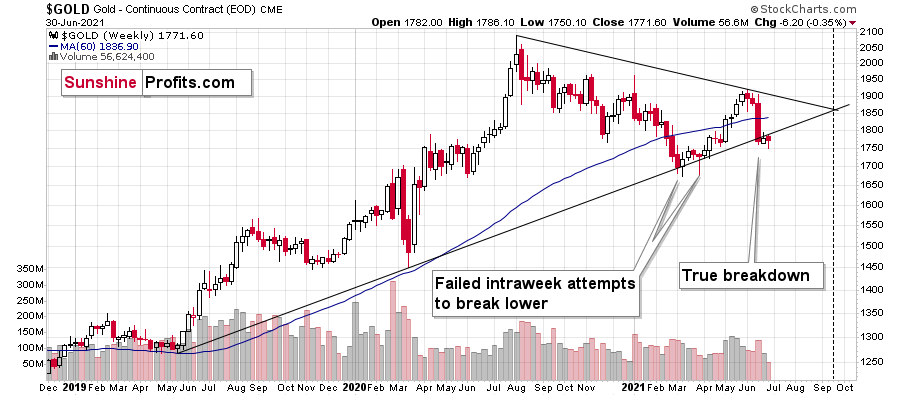
As I emphasized yesterday, this is the first time when gold managed to break below this line and not rally back up. This time is already different. And as the previously broken line now provides resistance, it seems that one shouldn’t expect gold to rally particularly high in the near term. Moving above the recent highs seems relatively unlikely.
The situation in the USD Index supports this outlook:
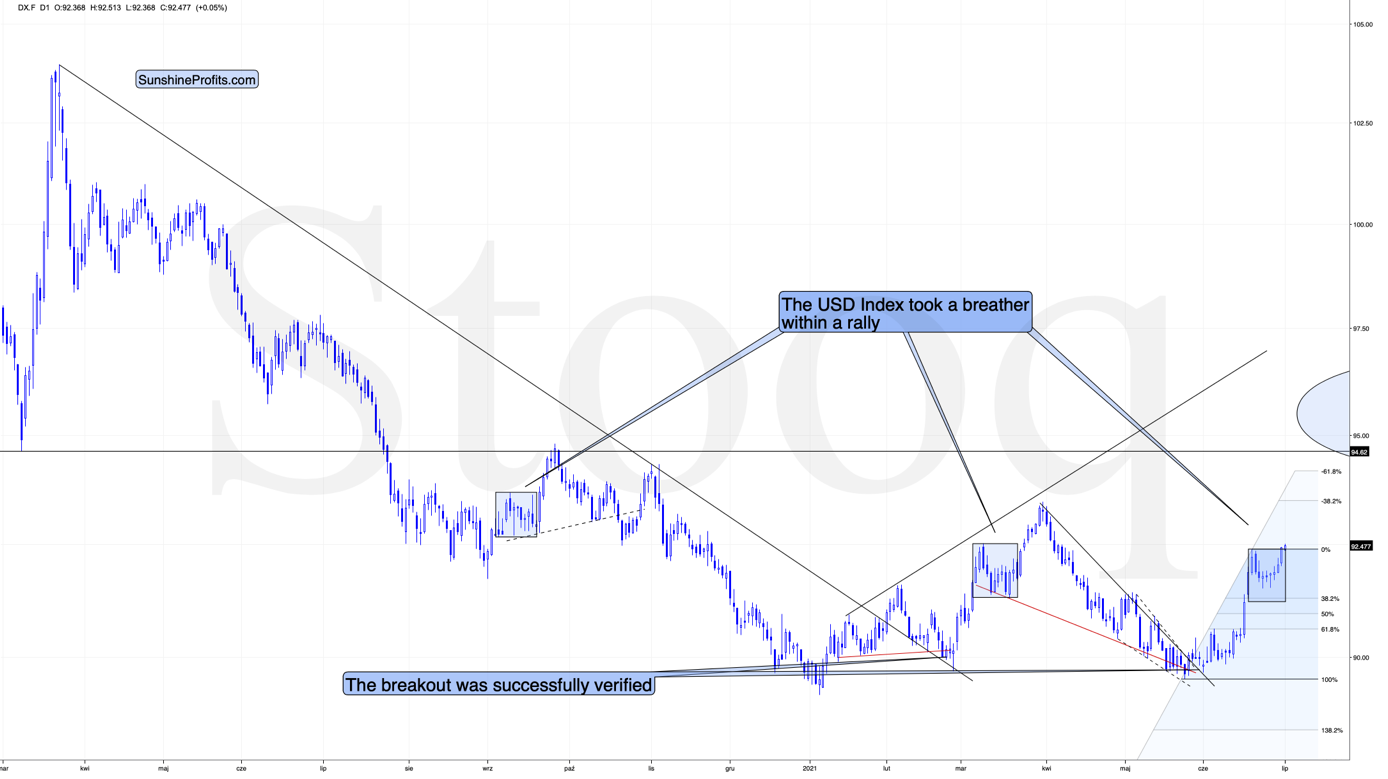
We recently saw a breather that was similar in terms of time and price to the previous patterns which happened after quick short-term rallies. And now, the USDX is moving higher once again. Yesterday, I wrote that as soon as the USD Index exceeds the previous June highs, it’s likely to rally more substantially – perhaps stopping temporarily at the late-March high or rallying even higher, to 95 or so. Well, the USDX has just broke above the June highs, but gold is not yet responding with a decline.
Still, gold’s rally here seems to be of technical and temporary nature. If it doesn’t decline soon while the USDX continues to rally, it will be suspiciously bullish, but for now, it doesn’t seem that it should raise anyone’s eyebrow.
Sooner or later, gold is likely to get the bearish push off the cliff that will likely take it below the above-mentioned rising red line. Gold’s next support is at the previous 2021 lows – close to $1,670.
Moreover, let’s keep in mind that gold stocks’ relative performance hasn’t stopped indicating the bearish outlook recently.
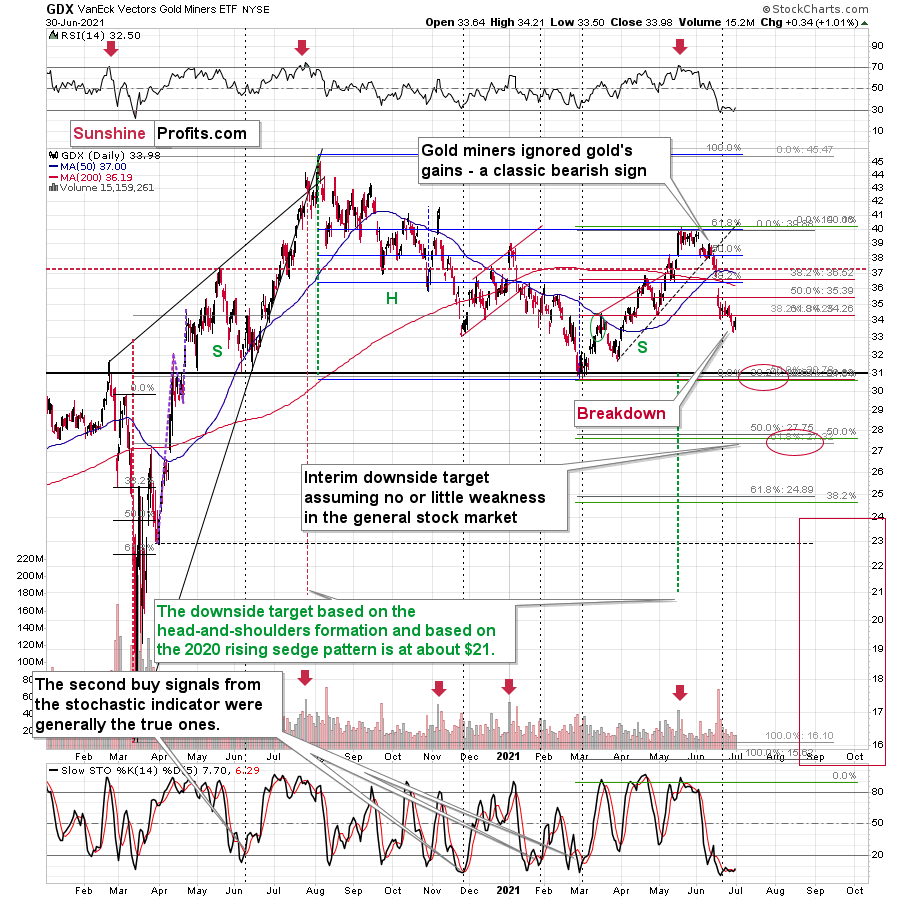
Yesterday, gold stocks continued to underperform gold. While the 1.01% upswing might seem like something important from a day-to-day basis, in reality, the GDX ETF hasn’t even managed to get back above the mid-June lows. Consequently, the breakdown below those lows seems to be verified right now.
It’s even clearer in the case of the 4-hour candlestick GDXJ ETF chart.
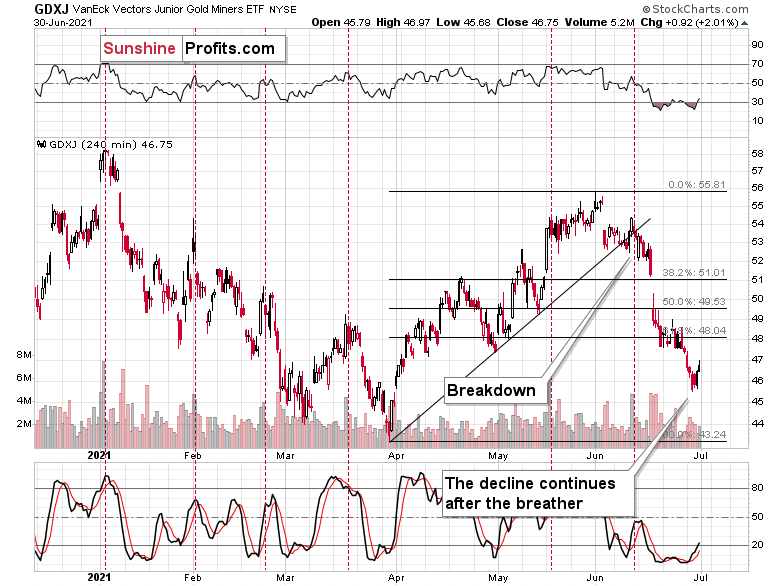
In this case, the junior miners weren’t even close to the mid-June lows.
All in all, it seems that the outlook for the precious metals market – especially for the junior gold miners – is very bearish for the following weeks and months, and it seems that the profits on our current short position will grow much more quite soon.
Having said that, let’s take a look at the markets from a more fundamental angle.
Dry as a Bone
With the U.S. Federal Reserve’s (FED) daily reverse repurchase agreements surging to a new all-time high on Jun. 30, the former wetland is undergoing a severe drought. Case in point: with 90 counterparties draining nearly $992 billion of liquidity from the U.S. financial system, QE is suffering a slow and painful death. And while investors focus all of their attention on what FED officials say, in reality, the taper has already begun.
Please see below:
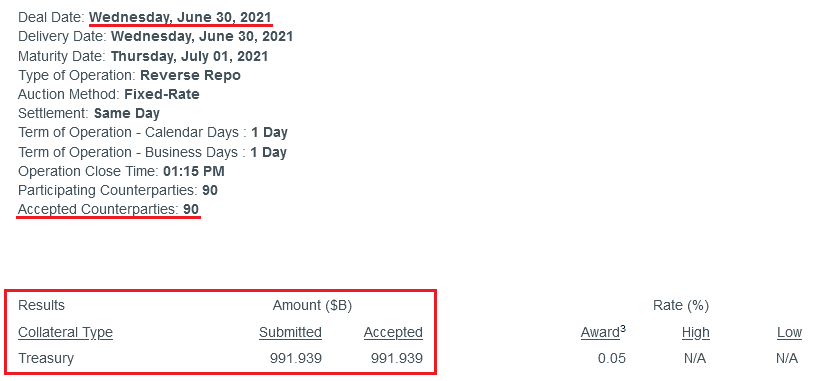 Source: New York FED
To explain, a reverse repurchase agreement (repo) occurs when an institution offloads cash to the FED in exchange for a Treasury security (on an overnight or short-term basis). And with U.S. financial institutions currently flooded with excess liquidity, they’re shipping cash to the FED at an alarming rate.
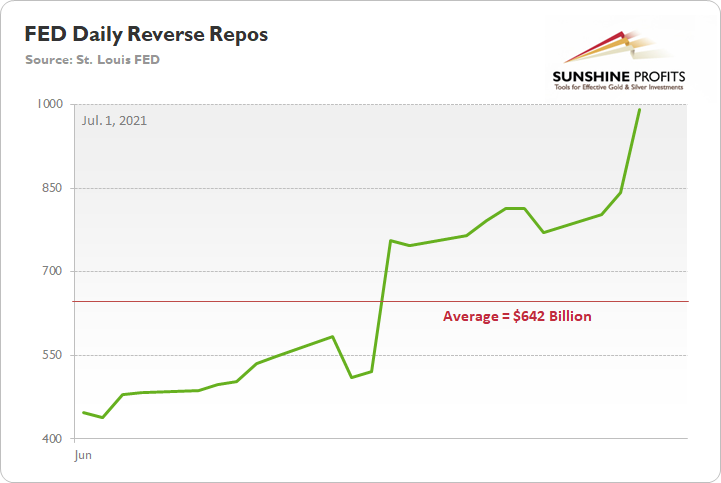
More importantly, though, the FED aims to purchase a combined $120 billion worth of Treasuries and mortgage-backed securities per month. However, with daily reverse repos averaging $642 billion in June, the FED has essentially negated 5.35 months’ worth of QE in the last month alone.
Please see below:
On top of that, while rising U.S. nonfarm payrolls remain the missing link for an official announcement, Dallas FED President Robert Kaplan told Bloomberg on Jun. 30 that “these [QE] purchases are very adept at stimulating demand, but we’ve got plenty of demand … and these purchases are not very effective when you’ve got a supply issue.”
And regarding a potential taper, he added:
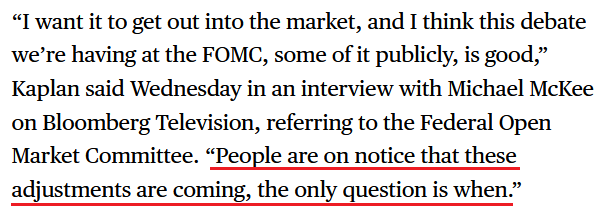 Source: Bloomberg
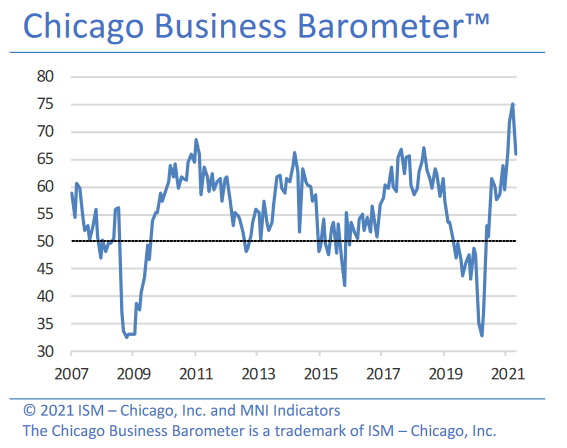
Headlining the anxiety, the inflation story has gained further momentum. For example, the Institute for Supply Management (ISM) released its Chicago Business Barometer on Jun. 30. And while the index fell to a four-month low and “New Orders languished markedly,” activity remains at the high-end of its historical range.
Please see below:
More importantly, though, the report revealed another inflationary surge:
“Prices paid at the factory gate surged to the highest level since December 1979. Companies noted higher prices due to material shortages. Across Q2, prices rose to 90.6, also a near 41-year high.”
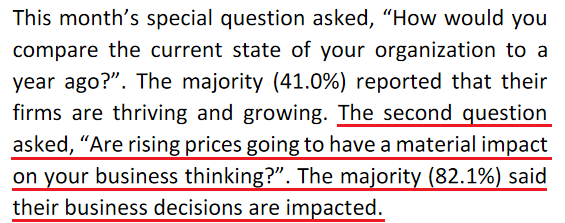
Furthermore, even amid the up-and-down performance, manufacturing and non-manufacturing firms in the Chicago area remain concerned about the impacts of inflation.
Please see below:
 Source: ISM
The Danger of Rent Inflation
Adding more fuel to the fire, I warned on Jun. 3 that rent inflation could put major upward pressure on the headline Consumer Price Index (CPI) in the coming months. For context, the Shelter CPI accounts for more than 30% of the movement of the headline CPI.
I wrote:
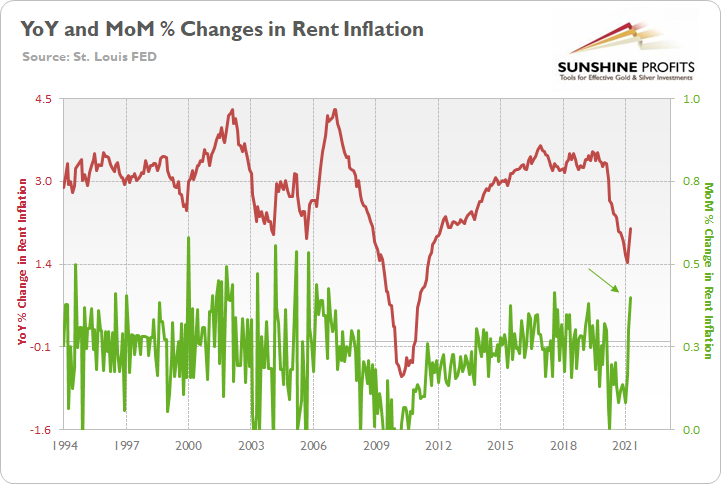
The red line above tracks the year-over-year (YoY) percentage change in the Shelter CPI, while the green line above tracks the MoM percentage change in the Shelter CPI. If you analyze their behavior, you can see that the YoY figure has only moved slightly higher. However, with MoM rents rising at a torrent pace (follow the green arrow), the COVID-19 grace period is officially over. And with rising rents likely to put upward pressure on the CPI in the coming months, taper-talk should grow even louder over the summer.
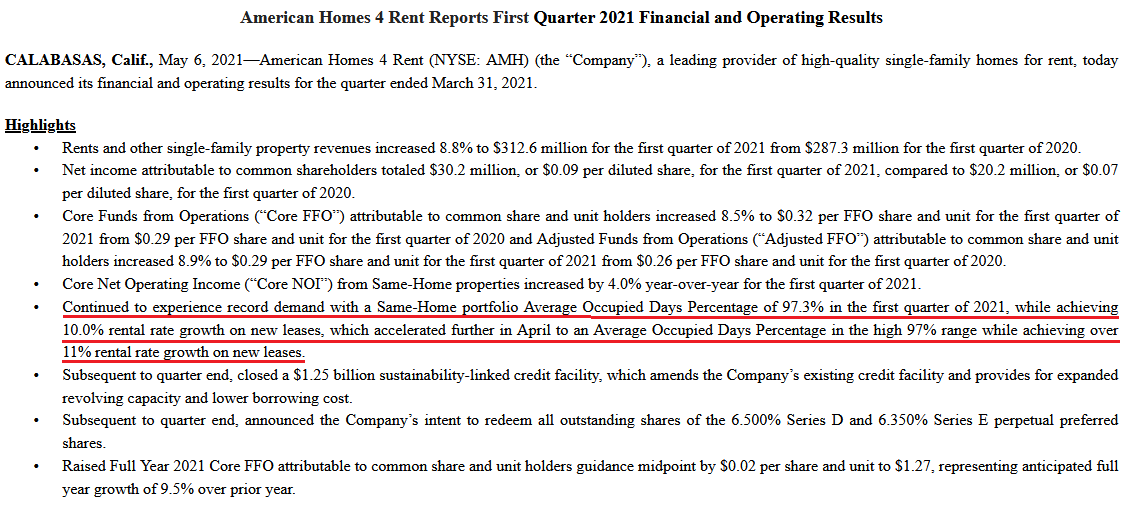
To that point, American Homes 4 Rent – a publicly-traded real estate investment trust (REIT) that owns 53,984 properties across 22 states (as of Mar. 31) – revealed in its first-quarter regulatory filing that the firm achieved “10.0% rental rate growth on new leases” in Q1 and “11% rental rate growth on new leases” in the month of April.
Please see below:
 Source: American Homes 4 Rent 8-K
If that wasn’t enough, the U.S. cities that were hurt the most during the pandemic now have rents rising at a much faster pace MoM than the Shelter CPI.
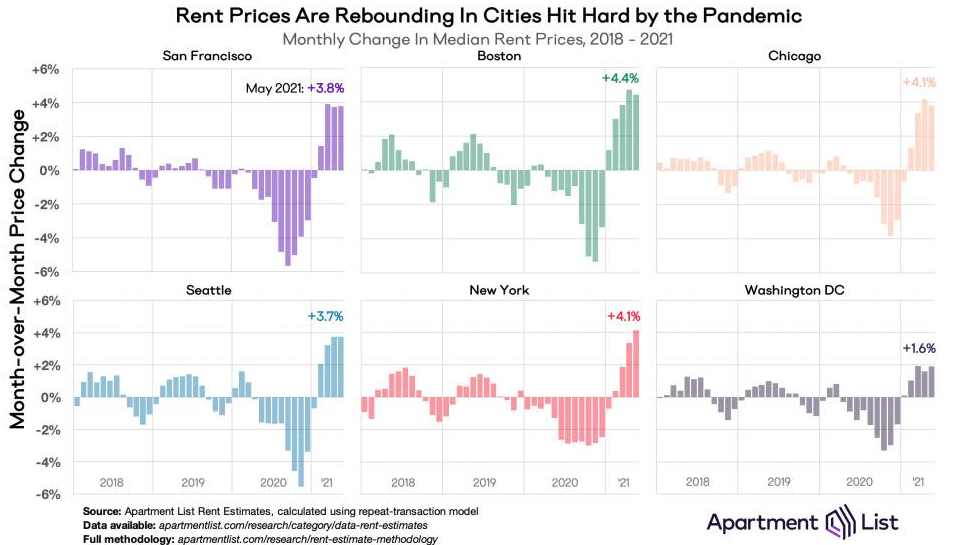
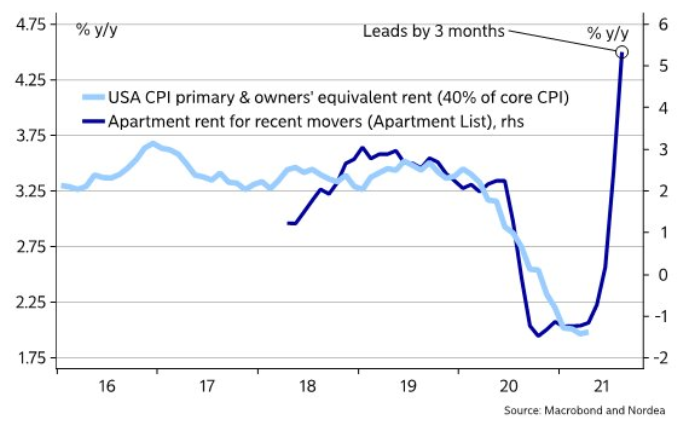
Furthermore, providing an appetizing update, Nordea found that Apartment List data (the chart above) often leads the Shelter CPI by three months.
Please see below:
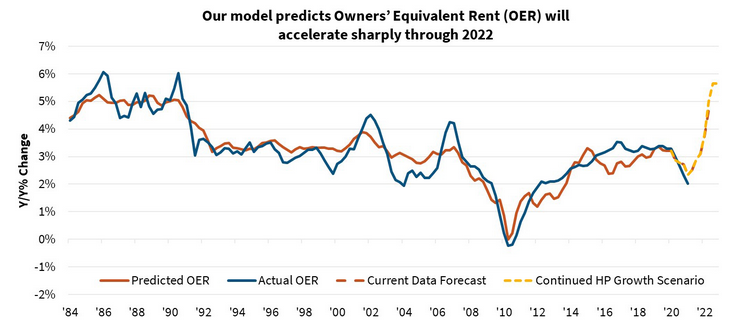
Piecing it all together, The Federal National Mortgage Association (Fannie Mae) forecasted the following:
“Lagged effects from the past year's house price appreciation and more recent rent recovery could begin to flow into inflation measures as soon as the May readings. House price gains to date suggest an eventual acceleration in shelter inflation from the current rate of 2.0%annualized to about 4.5%. If house price growth continues at the current pace, shelter inflation would likely move even higher.
Timing lags suggest [that] increasing shelter inflation will last through at least 2022, meaning ‘transitory’ increases to the rate of overall inflation may be more prolonged than many are expecting. Due to the heavy weight given to shelter, housing could contribute more than 2 percentage points to core CPI inflation by the end of 2022 and about 1 percentage point to the core PCE. Both would be the strongest contributions since 1990.”
Please see below:
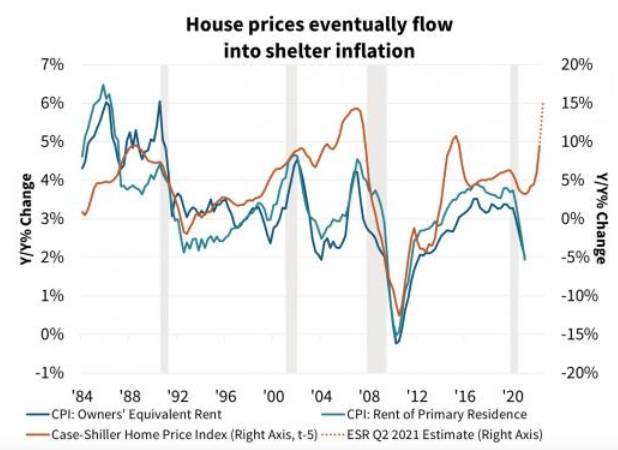 Source: Fannie Mae
To explain, the blue and teal bars above track the YoY percentage change in the rent components of the headline CPI, while the brown line above tracks the YoY percentage change in the S&P/Case-Shiller U.S. National Home Price Index (NHPI). If you analyze the right side of the chart, you can see that the NHPI has completely decoupled from its shelter CPI counterparts. Moreover, I wrote on Jun. 30 that the NHPI hit a new all-time high on Jun. 29, with Craig J. Lazzara, Managing Director and Global Head of Index Investment Strategy at S&P DJI, providing the following context:
“April’s performance was truly extraordinary. The 14.6% gain in the National Composite is literally the highest reading in more than 30 years of S&P CoreLogic Case-Shiller data.”
The bottom line? With Fannie Mae’s forecast supporting our projection, there could be plenty of fireworks in September.
 Source: Fannie Mae
What Can the S&P500 Tell Us?
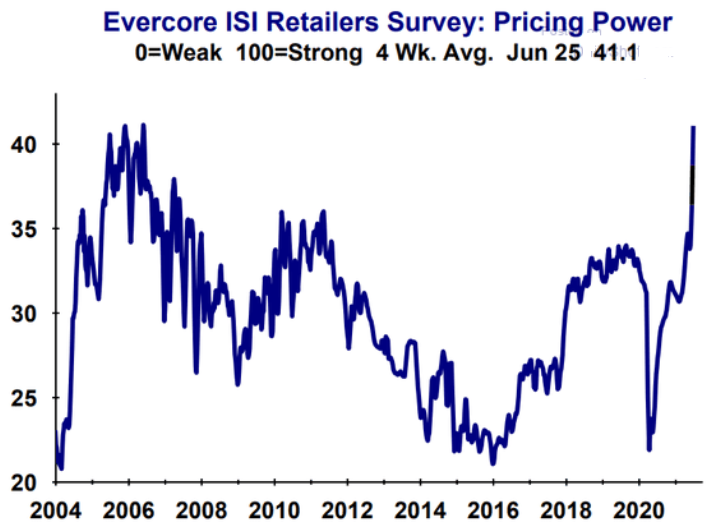
As another source of inflationary evidence, Evercore ISI’s gauge of retailers’ pricing power has risen once again. For context, from Jun. 8 to Jun. 25, the metric has increased from 37.9 to 41.1.
Please see below:
If that wasn’t enough, while commodities speculation has driven the inflationary surge, the FED’s recent ‘dot plot’ helped calm some of the fervor. However, with investors now shrugging off the hawkish shift (speculation is more fun than prudence), the S&P Goldman Sachs Commodity Index (S&P GSCI) closed at a new 2021 high on Jun. 30. For context, the S&P GSCI contains 24 commodities from all sectors: six energy products, five industrial metals, eight agricultural products, three livestock products and two precious metals.
Please see below:
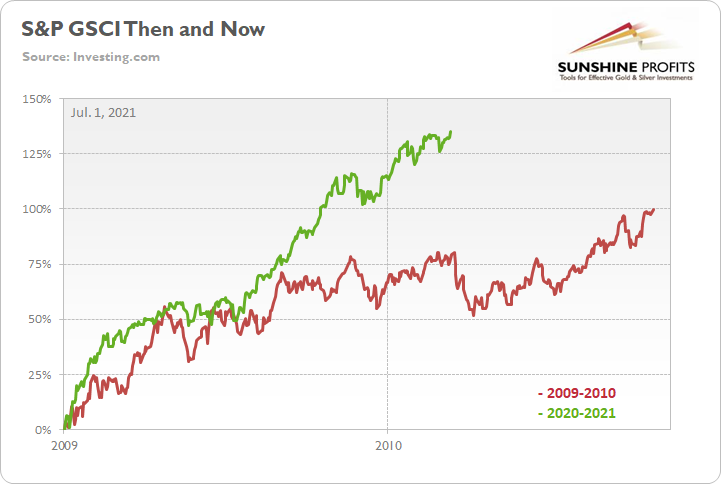
To explain, the green line above tracks the S&P GSCI’s current rally off the bottom, while the red line above tracks the S&P GSCI’s rally off the bottom in 2009-2010 (following the Global Financial Crisis). If you analyze the middle of the chart, you can see that the S&P GSCI has completely run away from the 2009-2010 analogue. For example, at this point in 2009-2010, the S&P GSCI rallied by 77% off the bottom. However, as of the Jun. 30 close, the S&P GSCI rallied by 135% off the April 2020 bottom.
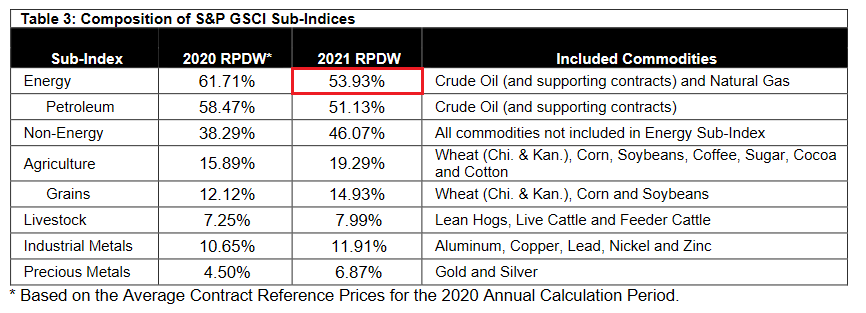
In addition, the weighting of the S&P GSCI is of immense importance. With energy accounting for roughly 54% of the index’s movement (the red box below), oil prices could be make-or-break for the cost-push inflation future impact.
Please see below:
 Source: S&P Global
Covid-19 Impact on the Oil Market
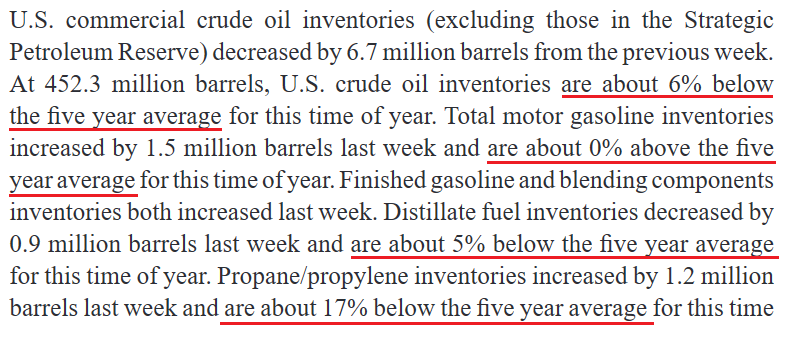
To that point, the U.S. Energy Information Administration (EIA) revealed on Jun. 30 that COVID-19 has depleted oil inventories. As a result, lagging supply could put further upward pressure on prices.
 Source: EIA
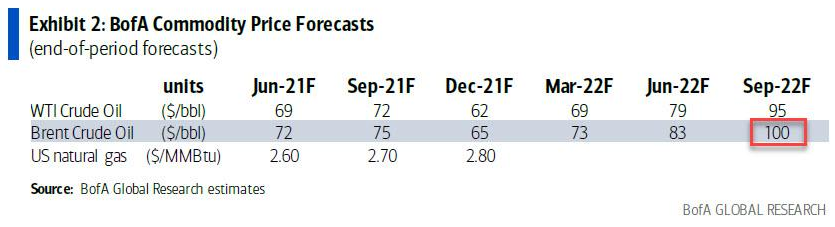
If that wasn’t enough, Francisco Blanch, head of global commodities and derivatives at Bank of America, told clients on Jun. 21 that “We believe that the robust global oil demand recovery will outpace supply growth over the next 18 months, further draining inventories and setting the stage for higher oil prices.” As such, "a combo of factors could push oil to $100/bbl.” For context, Brent is projected to hit $100 and WTI is projected to hit $95.
Please see below:
 Conversely, while Blanch’s projection is more of a long-term issue and the FED has the power to dampen commodities’ mood, it’s important to remember that the frenzy won’t ease on its own. However, with market-implied futures rates turning hawkish, investors’ perception of a dovish FED is quickly evaporating.
Please see below:
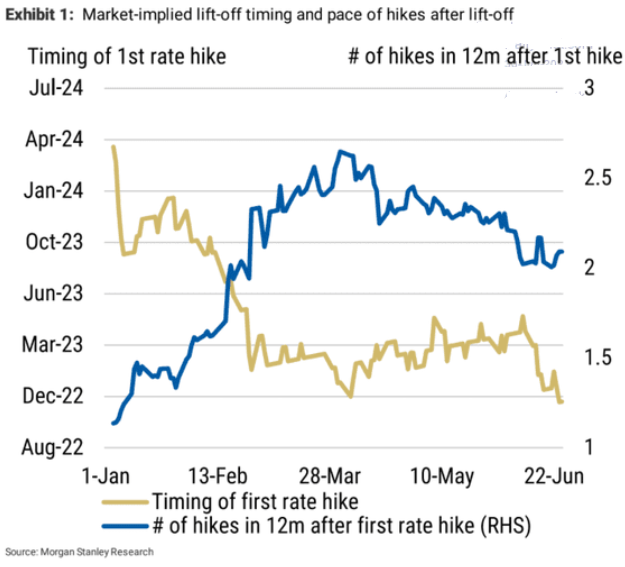
To explain, the gold line above tracks the expected timing of the FED’s first rate hike, while the blue line above tracks the number of rate hikes expected in the 12 months thereafter. Currently, investors expect a liftoff in November 2022, with roughly two rate hikes in the 12 months thereafter. However, on Jan. 1, investors weren’t expecting a liftoff until roughly March 2024. Thus, not only is the FED’s timeline moving closer and closer, but the inaccuracy of investors’ projections implies even more volatility should the inflationary pressures persist.
What About the Employment Issue?
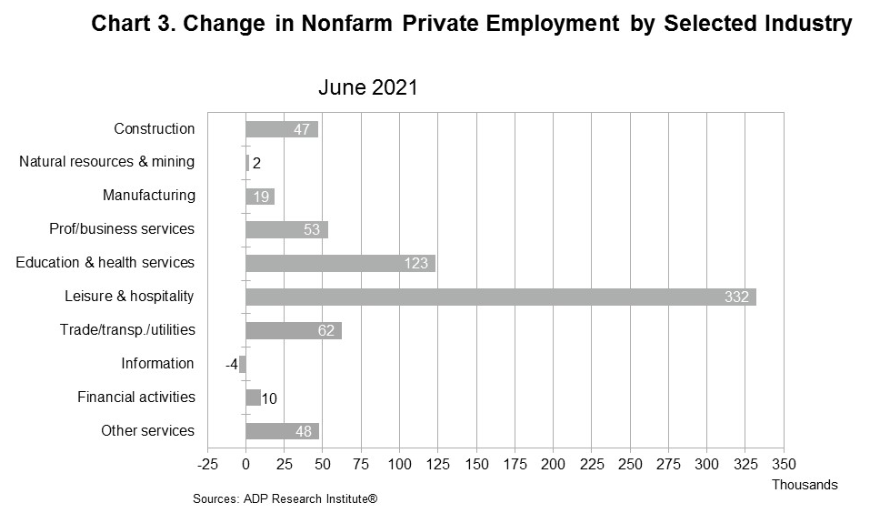
As for the U.S. labor market, I warned previously that U.S. nonfarm payrolls may not capture the momentum until August or September. And while ADP’s private payrolls came in above consensus on Jun. 30 – rising by 692,000 vs. 600,000 expected – it’s often a poor predictor of U.S. nonfarm payrolls (as we witnessed last month).
However, Nela Richardson, chief economist at ADP, had this to say:
“The labor market recovery remains robust, with June closing out a strong second quarter of jobs growth. While payrolls are still nearly 7 million short of pre-COVID-19 levels, job gains have totaled about 3 million since the beginning of 2021. Service providers, the hardest hit sector, continue to do the heavy lifting, with leisure and hospitality posting the strongest gain as businesses begin to reopen to full capacity across the country.”
Please see below:
On the flip side, Indeed’s latest Job Seeker Survey (released on Jun. 29) found that “many job seekers don’t express a sense of urgency about finding a new job, but say they are likely to pick up the search for work in the months ahead.” And surprise, surprise, “UI payments also appear to reduce urgency more among those without degrees.”
Please see below:
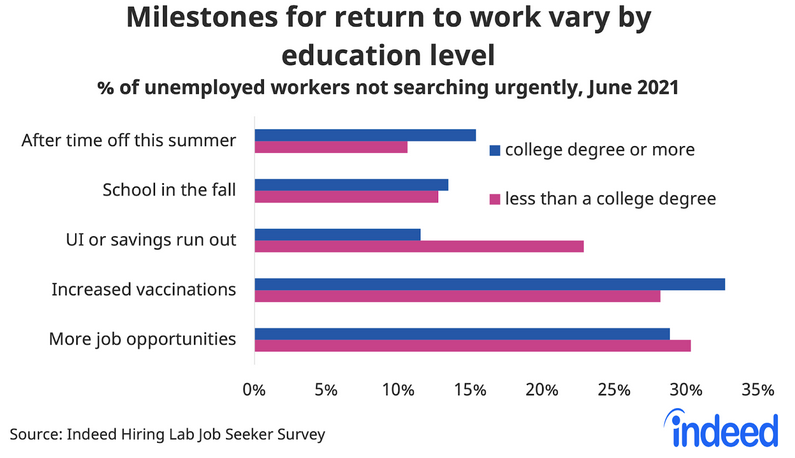
To explain, the blue (“college degree or more”) and purple (“less than a college degree”) bars above depict the necessary milestones to encourage unemployed respondents to reenter the workforce. If you analyze the third row (“UI or savings run out”), you can see that nearly 25% of non-college-educated U.S. citizens are waiting for enhanced unemployment benefits to end. In addition, while “Increased vaccinations” are also cited as an important factor, “More job opportunities” contradict the fact that U.S. job openings are at an all-time high.
More importantly, though, with Indeed also updating individuals’ job search activity on Jun. 29, states that have eliminated enhanced unemployment benefits (or will) are showing further progress.
Please see below:
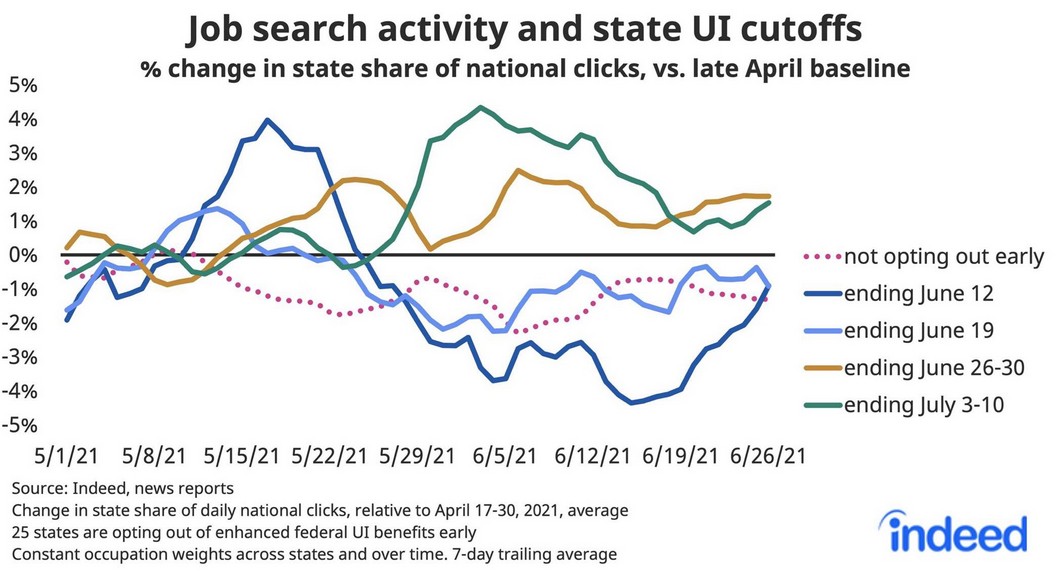
To explain, the solid lines above track job search activity across states where enhanced unemployment benefits have or will expire. If you analyze the right side of the chart, you can see that the dark blue line (Jun. 12), the gold line (Jun. 26-30) and the green line (Jul. 3-10) are showing signs of life. Moreover, while the light blue line (Jun. 19) remains surprisingly stagnant, it has still demonstrated some recent strength. The bottom line? With momentum likely to accelerate in August and September, rising U.S. employment will likely put the final nail in QE’s coffin.
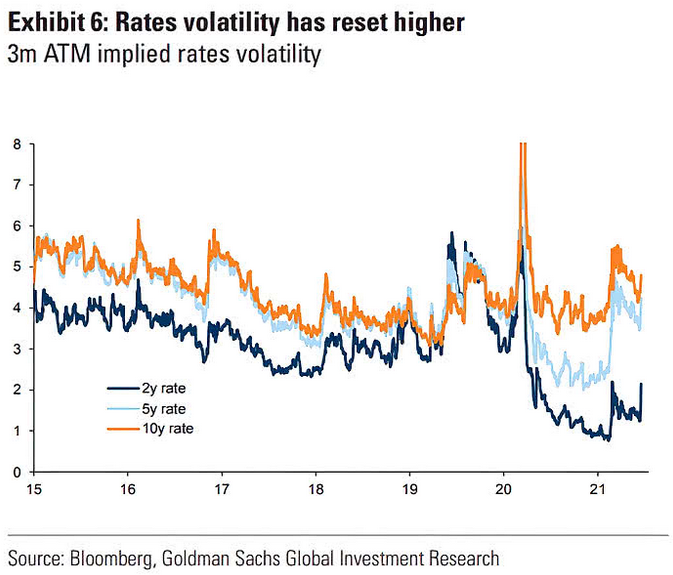
Finally, while the U.S. 10-Year Treasury yield has been rather subdued in recent weeks, the FED’s June surprise reignited volatility across the U.S. yield curve. If you analyze the chart below, you can see that U.S. 2-year, 5-year and 10-year (to a lesser extent) three-month at-the-money (ATM) interest rate options expect more volatility ahead. And with prior spikes upending the PMs, they could suffer more selling pressure in the coming months.
In conclusion, the PMs are stuck in no man’s land, as the strong U.S. recovery threatens to uplift the USD Index and U.S. Treasury yields. Moreover, even if a weak U.S. nonfarm payrolls print hits the wire on Jul. 2, it will likely be a speed bump in the latter’s inevitable uprising. Likewise, with the U.S. labor force poised to accelerate in the coming months and inflation still raging, the FED’s clock is slowly ticking towards midnight. And with investors eager to front-run the eventual announcement, history implies that they will position accordingly long before the bell rings.
Overview of the Upcoming Part of the Decline
- The barely visible corrective upswing in gold might already be over, and another huge decline is likely just around the corner.
- After miners slide in a meaningful and volatile way, but silver doesn’t (and it just declines moderately), I plan to switch from short positions in miners to short positions in silver. At this time, it’s too early to say at what price levels this would take place – perhaps with gold close to $1,600. I plan to exit those short positions when gold shows substantial strength relative to the USD Index, while the latter is still rallying. This might take place with gold close to $1,350 - $1,500 and the entire decline (from above $1,900 to about $1,475) would be likely to take place within 6-20 weeks, and I would expect silver to fall the hardest in the final part of the move. This moment (when gold performs very strongly against the rallying USD and miners are strong relative to gold – after gold has already declined substantially) is likely to be the best entry point for long-term investments, in my view. This might also happen with gold close to $1,475, but it’s too early to say with certainty at this time.
- As a confirmation for the above, I will use the (upcoming or perhaps we have already seen it?) top in the general stock market as the starting point for the three-month countdown. The reason is that after the 1929 top, gold miners declined for about three months after the general stock market started to slide. We also saw some confirmations of this theory based on the analogy to 2008. All in all, the precious metals sector would be likely to bottom about three months after the general stock market tops.
- The above is based on the information available today, and it might change in the following days/weeks.
Please note that the above timing details are relatively broad and “for general overview only” – so that you know more or less what I think and how volatile I think the moves are likely to be – on an approximate basis. These time targets are not binding or clear enough for me to think that they should be used for purchasing options, warrants or similar instruments.
Letters to the Editor
Q: Hi PR,
We appreciate your fantastic insights and complete macro analysis for the PMs, I am your # 1 subscriber.
I was recently watching this interview: https://www.youtube.com/watch?v=Ez6k4wbBLPE
I would like to see what your point of view is. You don't need to watch the whole video, but in the 11:50 timeframe they are talking about opinions on gold retracing to $1500s, just as it did in 2012. It wasn’t convincing but there was a good narrative about the government.
Let me know your thoughts.
Thanks,
A: Thank you for the kind words, I’m very happy that you enjoy my analyses so much!
In short, the argument is that gold is not going to decline to $1,500 or so because of the change in the dynamics on the market; that generally boils down to the fact that a lot of money was thrown at it recently.
I agree that it changed a lot and that it made gold’s potential ridiculously favorable in the long run, but I disagree with regard to the implications regarding the short or medium term. The markets simply won’t move in the short run because of these fundamentals, just as gold hasn’t rallied based on them in the past 10 months. In fact, gold failed to hold above the previous (2011) highs despite them. So, again, the fundamentals don’t tell us what the market is going to do in the following weeks (and usually they don’t tell us about the next few months either).
The argument is that gold moved lower because of the increase in the yields. I disagree that it was just that – many factors were involved, the technical part being perhaps the most important one. Besides:
- Gold plunged over $100 last month without a visible increase in the 10-year yield – in fact, the 10-year yield decreased in June.
- The yield could soar once again, triggering even bigger declines in gold.
If the technicals play out as they are likely to and other markets act profoundly as well (stocks slide while the USDX soars), then gold could even fall to $1,350 or so. If that happens, silver and gold stocks are going to be extremely cheap. This and the extremely positive fundamentals might create the best risk-to-reward opportunity of a decade.
Please note: I generally do not comment on long (longer than 5 minutes) videos that I’m forwarded, as it takes too much time that I could otherwise spend on providing analyses – which is something that’s definitely going to be useful to every reader. Don’t get me wrong, I appreciate every submission that readers provide (videos included, and please continue to do so), but a discussion of a long video might not be relevant to other readers – a good workaround would be to formulate questions based on such videos, rather than sending a link to the video itself.
Summary
To summarize, even though gold could still move somewhat higher in the near term, it seems that having a short position in the junior mining stocks is much more justified from the risk-to-reward point of view than having a long one in any part of the precious metals market. Gold miners’ underperformance along with a self-similar pattern in the USD Index (pointing to the breather being over) and the length of the “bottoming” process in gold that no longer resembles a bottom (but rather a pause within a slide) all make the bearish outlook justified from the risk-to-reward point of view.
After the sell-off (that takes gold to about $1,350 - $1,500), I expect the precious metals to rally significantly. The final part of the decline might take as little as 1-5 weeks, so it's important to stay alert to any changes.
Most importantly, please stay healthy and safe. We made a lot of money last March and this March, and it seems that we’re about to make much more on the upcoming decline, but you have to be healthy to enjoy the results.
As always, we'll keep you - our subscribers - informed.
By the way, we’re currently providing you with a possibility to extend your subscription by a year, two years or even three years with a special 20% discount. This discount can be applied right away, without the need to wait for your next renewal – if you choose to secure your premium access and complete the payment upfront. The boring time in the PMs is definitely over and the time to pay close attention to the market is here. Naturally, it’s your capital, and the choice is up to you, but it seems that it might be a good idea to secure more premium access now, while saving 20% at the same time. Our support team will be happy to assist you in the above-described upgrade at preferential terms – if you’d like to proceed, please contact us.
To summarize:
Trading capital (supplementary part of the portfolio; our opinion): Full speculative short positions (300% of the full position) in mining stocks are justified from the risk to reward point of view with the following binding exit profit-take price levels:
Mining stocks (price levels for the GDXJ ETF): binding profit-take exit price: $24.12; stop-loss: none (the volatility is too big to justify a stop-loss order in case of this particular trade)
Alternatively, if one seeks leverage, we’re providing the binding profit-take levels for the JDST (2x leveraged) and GDXD (3x leveraged – which is not suggested for most traders/investors due to the significant leverage). The binding profit-take level for the JDST: $39.87; stop-loss for the JDST: none (the volatility is too big to justify a SL order in case of this particular trade); binding profit-take level for the GDXD: $94.87; stop-loss for the GDXD: none (the volatility is too big to justify a SL order in case of this particular trade).
For-your-information targets (our opinion; we continue to think that mining stocks are the preferred way of taking advantage of the upcoming price move, but if for whatever reason one wants / has to use silver or gold for this trade, we are providing the details anyway.):
Silver futures upside profit-take exit price: unclear at this time - initially, it might be a good idea to exit, when gold moves to $1,512.
Gold futures upside profit-take exit price: $1,512.
Long-term capital (core part of the portfolio; our opinion): No positions (in other words: cash
Insurance capital (core part of the portfolio; our opinion): Full position
Whether you already subscribed or not, we encourage you to find out how to make the most of our alerts and read our replies to the most common alert-and-gold-trading-related-questions.
Please note that we describe the situation for the day that the alert is posted in the trading section. In other words, if we are writing about a speculative position, it means that it is up-to-date on the day it was posted. We are also featuring the initial target prices to decide whether keeping a position on a given day is in tune with your approach (some moves are too small for medium-term traders, and some might appear too big for day-traders).
Additionally, you might want to read why our stop-loss orders are usually relatively far from the current price.
Please note that a full position doesn't mean using all of the capital for a given trade. You will find details on our thoughts on gold portfolio structuring in the Key Insights section on our website.
As a reminder - "initial target price" means exactly that - an "initial" one. It's not a price level at which we suggest closing positions. If this becomes the case (like it did in the previous trade), we will refer to these levels as levels of exit orders (exactly as we've done previously). Stop-loss levels, however, are naturally not "initial", but something that, in our opinion, might be entered as an order.
Since it is impossible to synchronize target prices and stop-loss levels for all the ETFs and ETNs with the main markets that we provide these levels for (gold, silver and mining stocks - the GDX ETF), the stop-loss levels and target prices for other ETNs and ETF (among other: UGL, GLL, AGQ, ZSL, NUGT, DUST, JNUG, JDST) are provided as supplementary, and not as "final". This means that if a stop-loss or a target level is reached for any of the "additional instruments" (GLL for instance), but not for the "main instrument" (gold in this case), we will view positions in both gold and GLL as still open and the stop-loss for GLL would have to be moved lower. On the other hand, if gold moves to a stop-loss level but GLL doesn't, then we will view both positions (in gold and GLL) as closed. In other words, since it's not possible to be 100% certain that each related instrument moves to a given level when the underlying instrument does, we can't provide levels that would be binding. The levels that we do provide are our best estimate of the levels that will correspond to the levels in the underlying assets, but it will be the underlying assets that one will need to focus on regarding the signs pointing to closing a given position or keeping it open. We might adjust the levels in the "additional instruments" without adjusting the levels in the "main instruments", which will simply mean that we have improved our estimation of these levels, not that we changed our outlook on the markets. We are already working on a tool that would update these levels daily for the most popular ETFs, ETNs and individual mining stocks.
Our preferred ways to invest in and to trade gold along with the reasoning can be found in the how to buy gold section. Furthermore, our preferred ETFs and ETNs can be found in our Gold & Silver ETF Ranking.
As a reminder, Gold & Silver Trading Alerts are posted before or on each trading day (we usually post them before the opening bell, but we don't promise doing that each day). If there's anything urgent, we will send you an additional small alert before posting the main one.
Thank you.
Przemyslaw Radomski, CFA
Founder, Editor-in-chief

