

Briefly: in our opinion, full (250% of the regular size of the position) speculative short positions in gold, silver and mining stocks are justified from the risk/reward perspective at the moment of publishing this Alert.
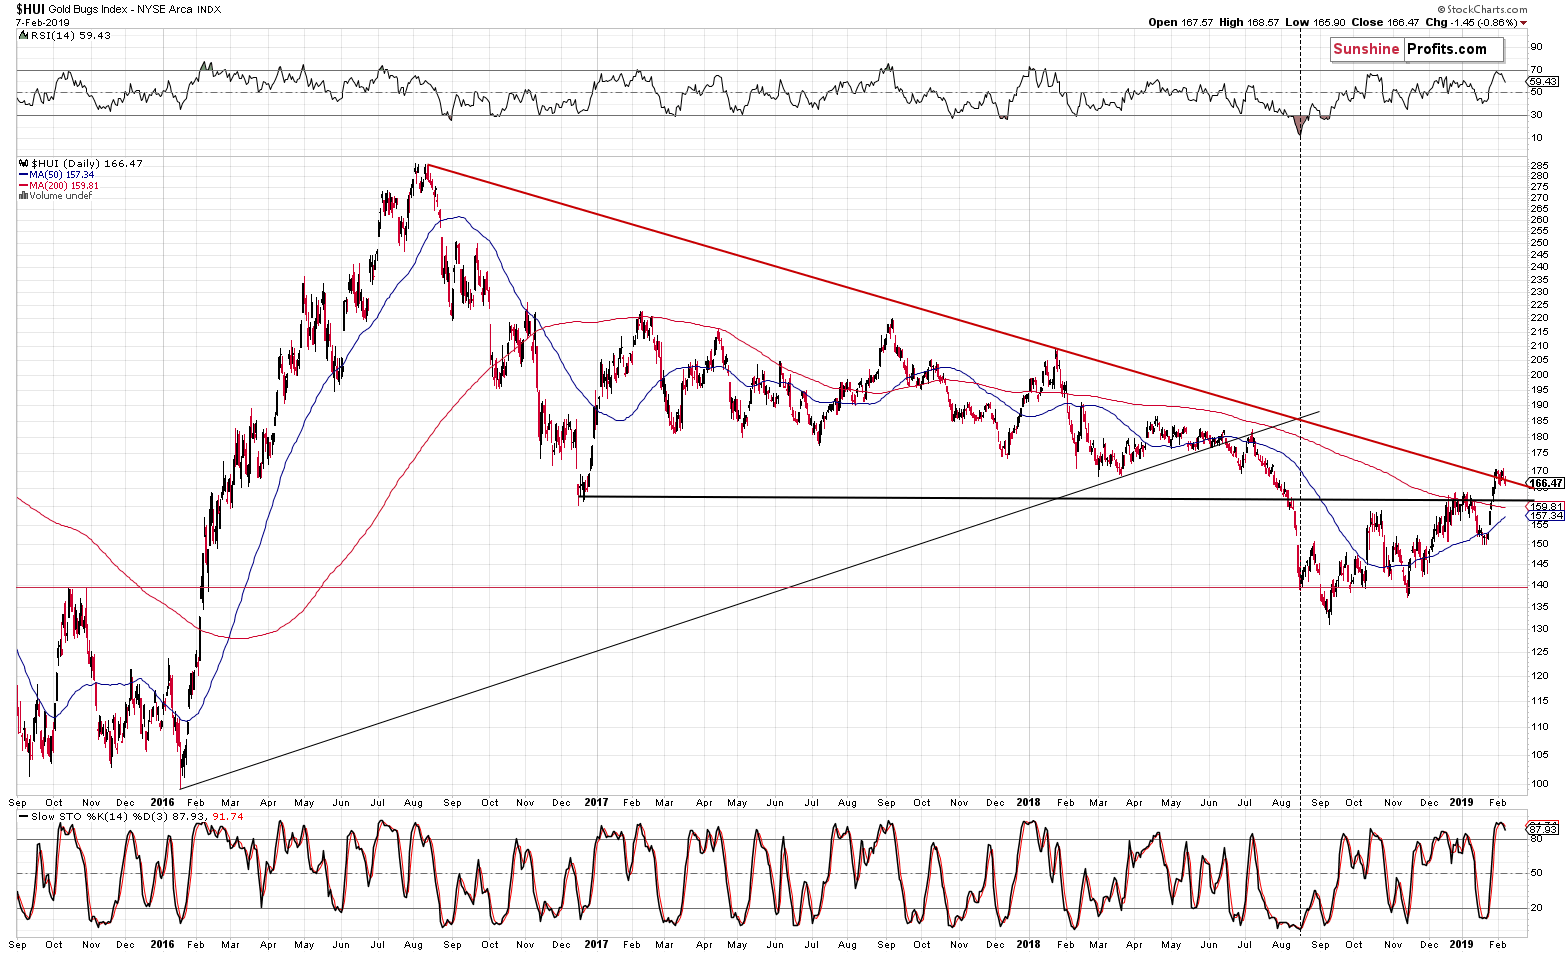
The breakouts in mining stocks are now history – the miners invalidated the moves above both: short- and medium-term resistance lines. And yet, the situation is still similar to what we saw in 2016. How can that be, and what are the implications?
The situation is indeed similar, because mining stocks seem to have faked their final signals at the very end of a medium-term movement. In 2016, miners faked underperformance and this year, they faked strength. In 2016, when the underperformance and breakdown were invalidated, gold stocks were on a verge of a major upswing. Now, they appear to be on a verge of a huge drop.
Mining Stocks’ Breakout Invalidation
Let’s take a look at the details.
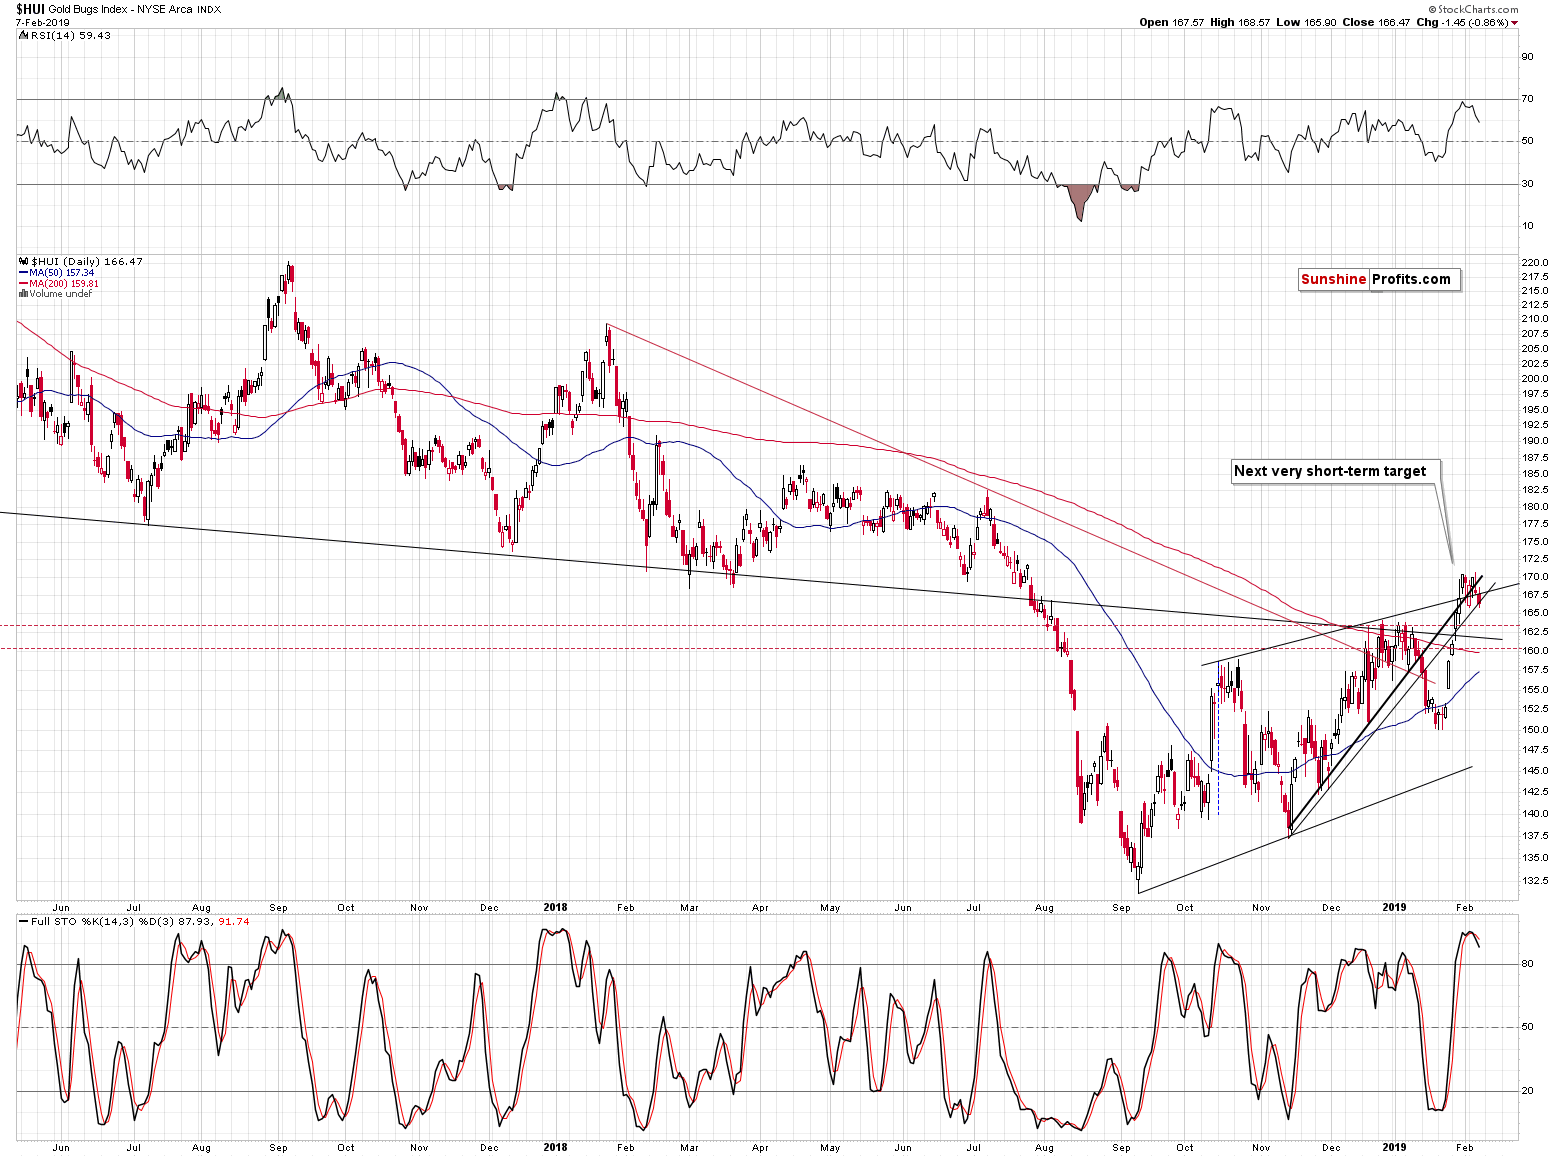
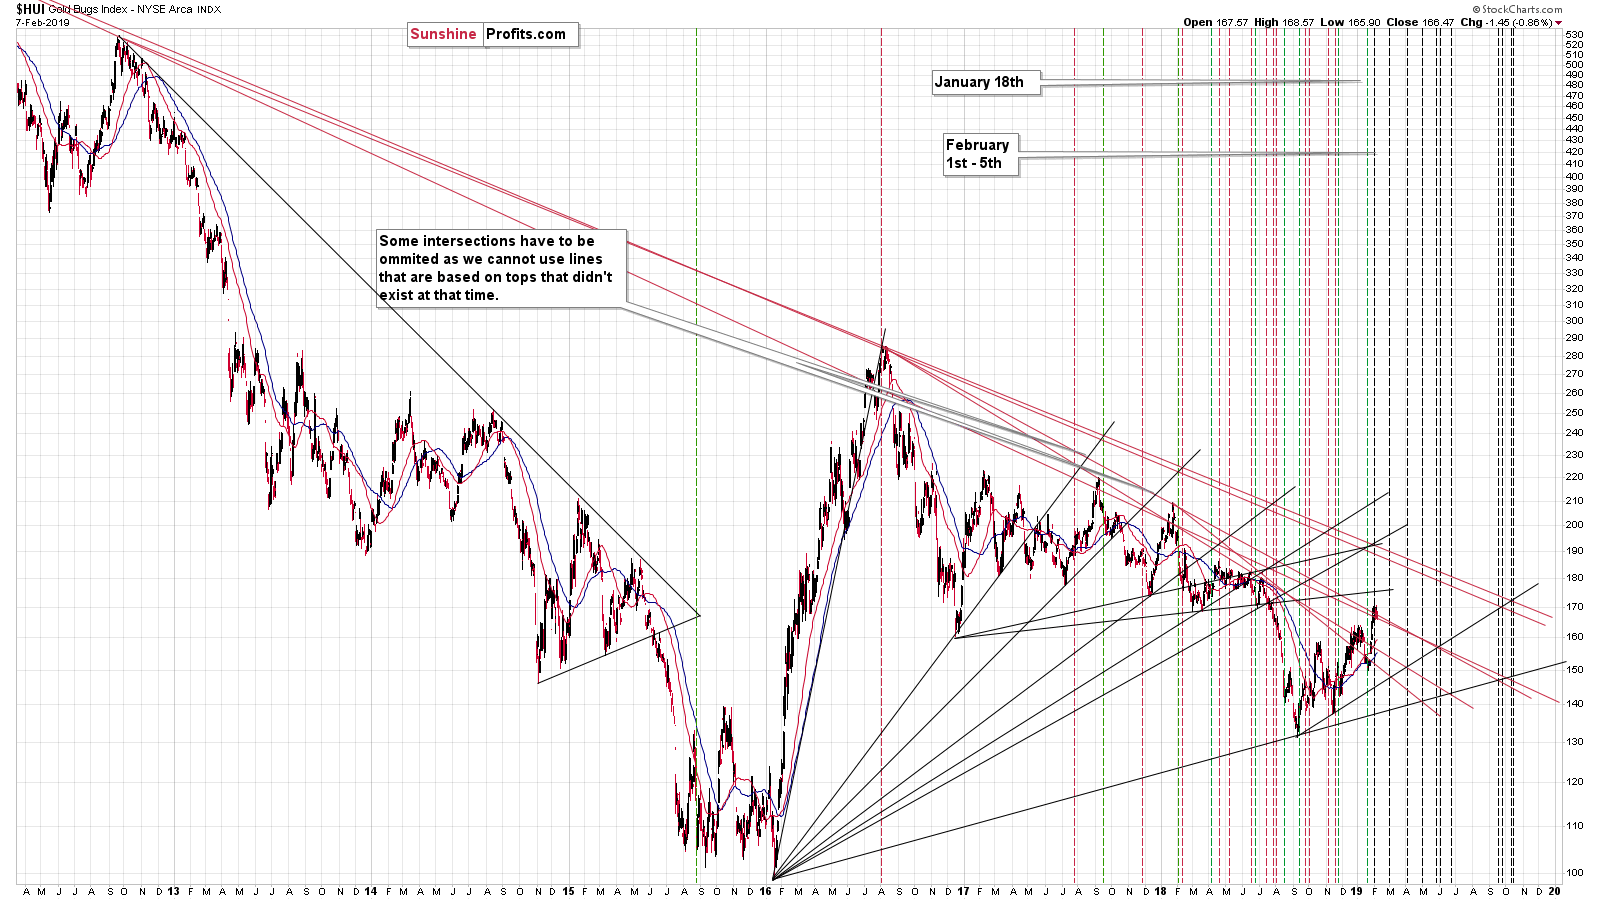
Invalidations that took place very close to triangle-vertex-based reversals, while RSI moved to 70 and a fresh, clear sell signal from the Stochastic indicator are a very bearish combination.
As far as the reversals are concerned, please note that the above chart features the short-term triangle with apex in early February, and that increases the strength of the long-term reversals (we’ll feature them later today) even further.
It seems that our explanation of the most recent upswing in the miners was indeed correct – the strength was fake:
It means that the investors and traders are not eager to participate in the price moves at this time. There are few buyers and few sellers, and thus it’s relatively easy to push the price in a given direction. Yesterday’s move in mining stocks shows how easy it was for traders to push the price higher, despite the lack of really positive developments in gold. Inexperienced traders would say that it was bullish. Indeed – in most cases, when miners outperform gold, it’s a clear bullish sign. But on very low-volume days, it’s not particularly informative. It can be a local technical move that’s driven by a specific technical formation that results in a visible price move. Normally – in case of regular or high volume – the market forces make sure that miners move in tune with gold and if they don’t, it tells us something (either bullish or bearish). But in light of a very low volume, we don’t have this kind of information. Or more precisely, we do, but the strength of the mechanism is too weak to be trusted.
Gold and THE Reversal
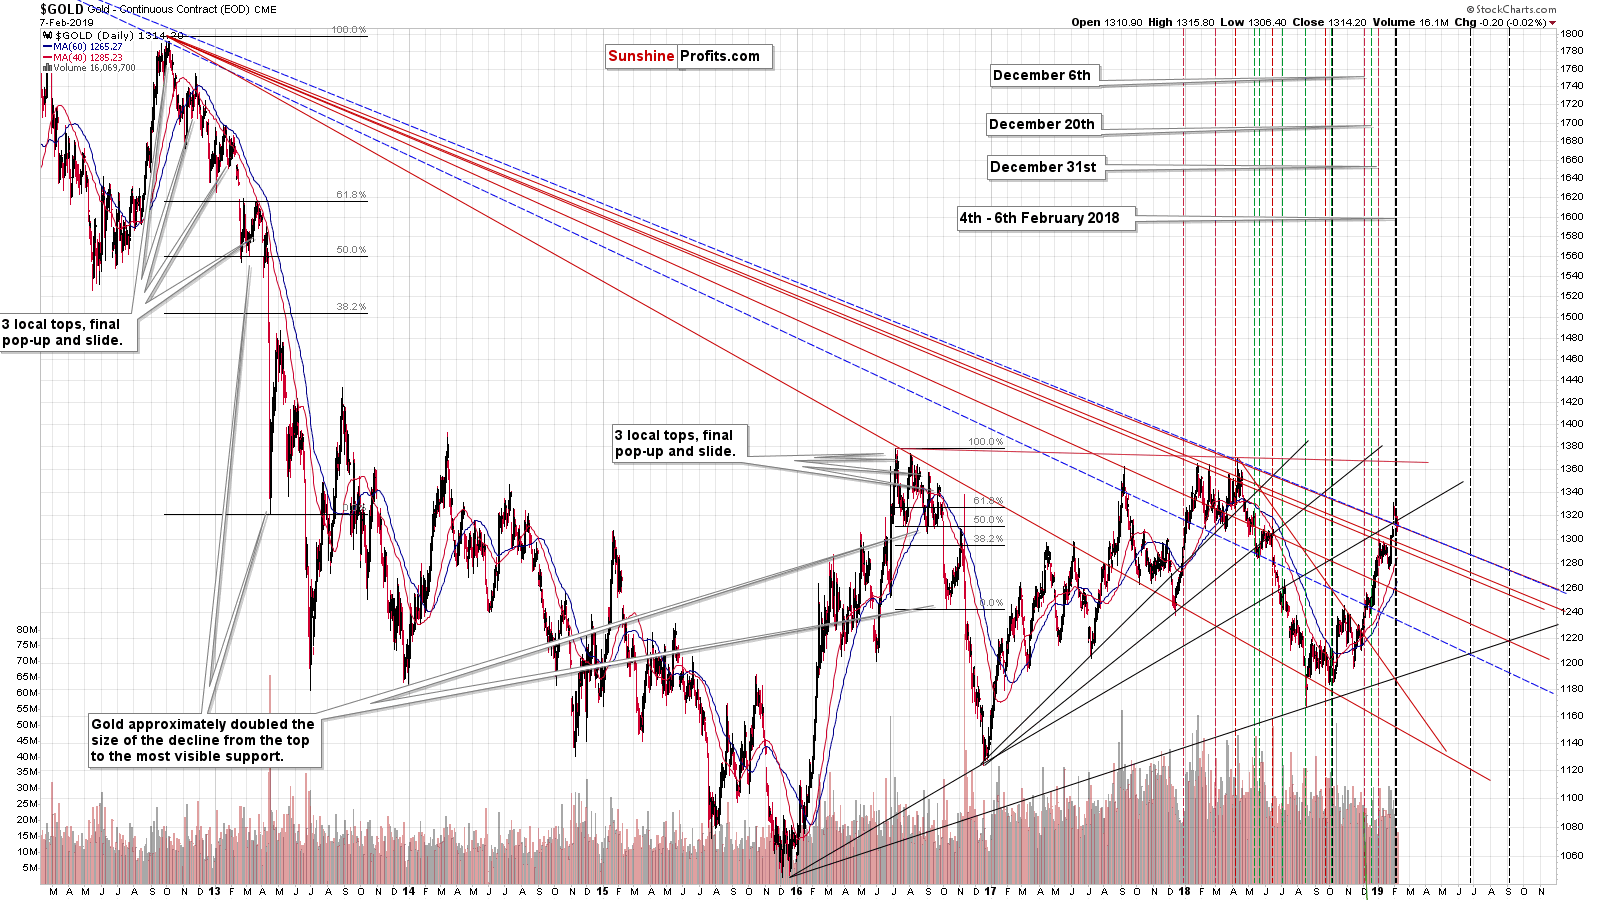
Gold moved to the long-term vertex-based reversal, RSI touched the 70 level thus flashing a reliable sell signal, and the Stochastics is about to flash a sell signal as well. Only a little more short-term weakness is needed for the latter.
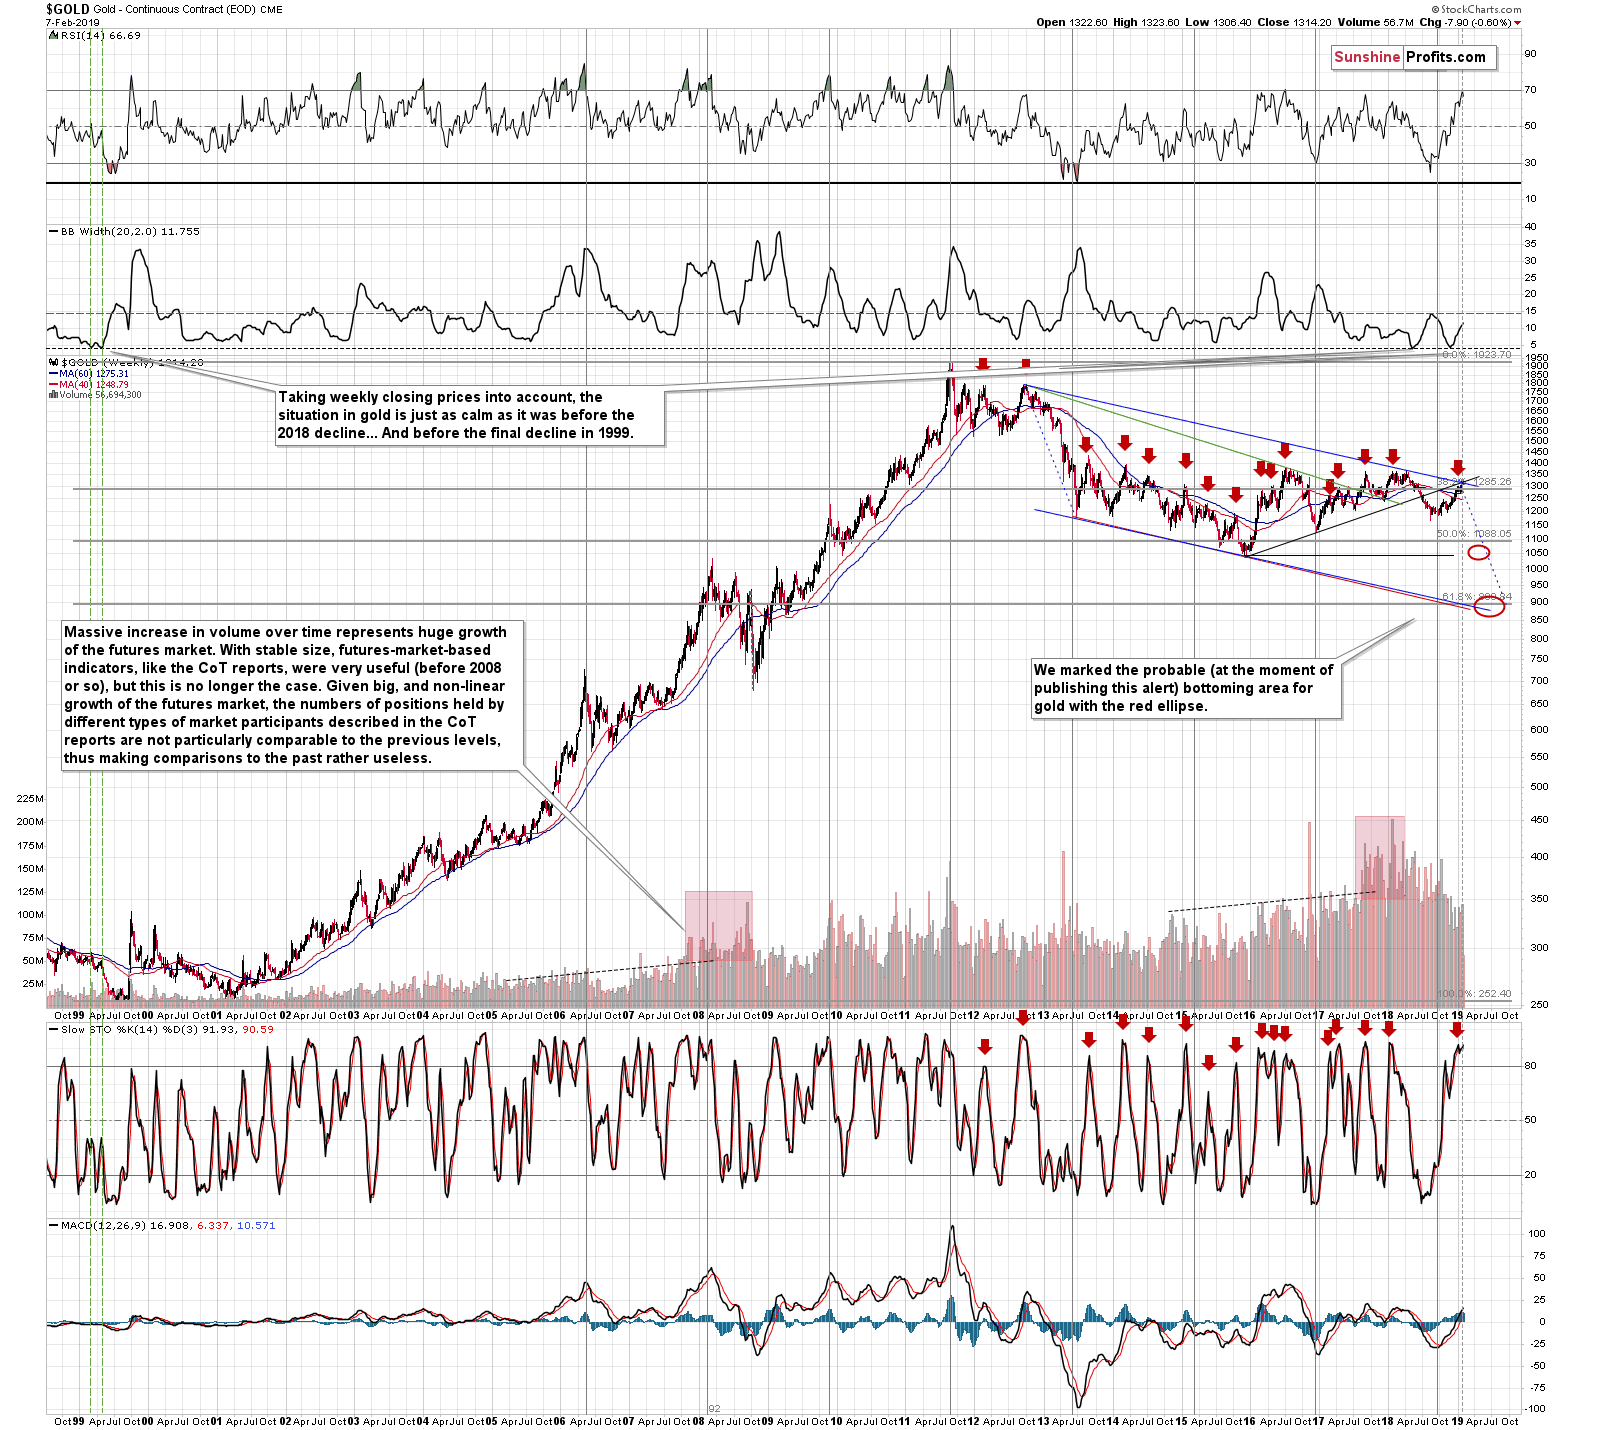
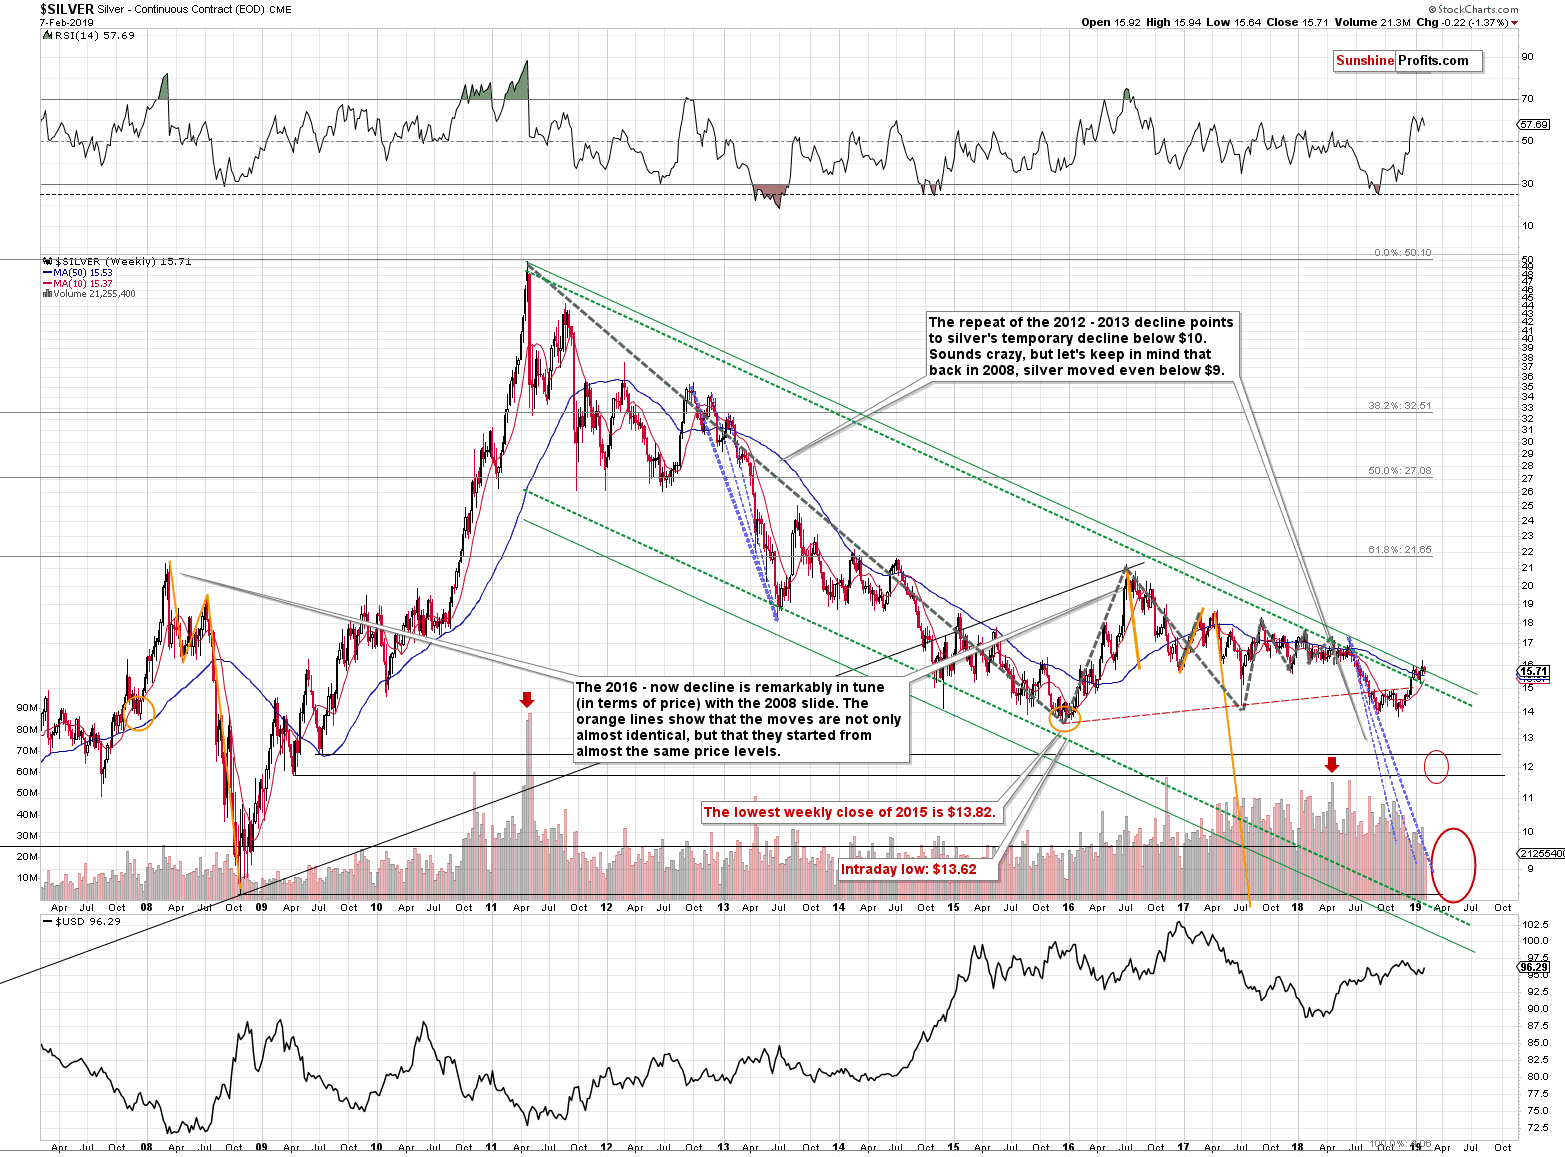
It all happened after gold moved higher for a few months, which took place on a relatively low volume overall. This rally may have appeared significant, but from the long-term point of view, it looks much more like a medium-term correction, similar to the one that took place in late 2012.
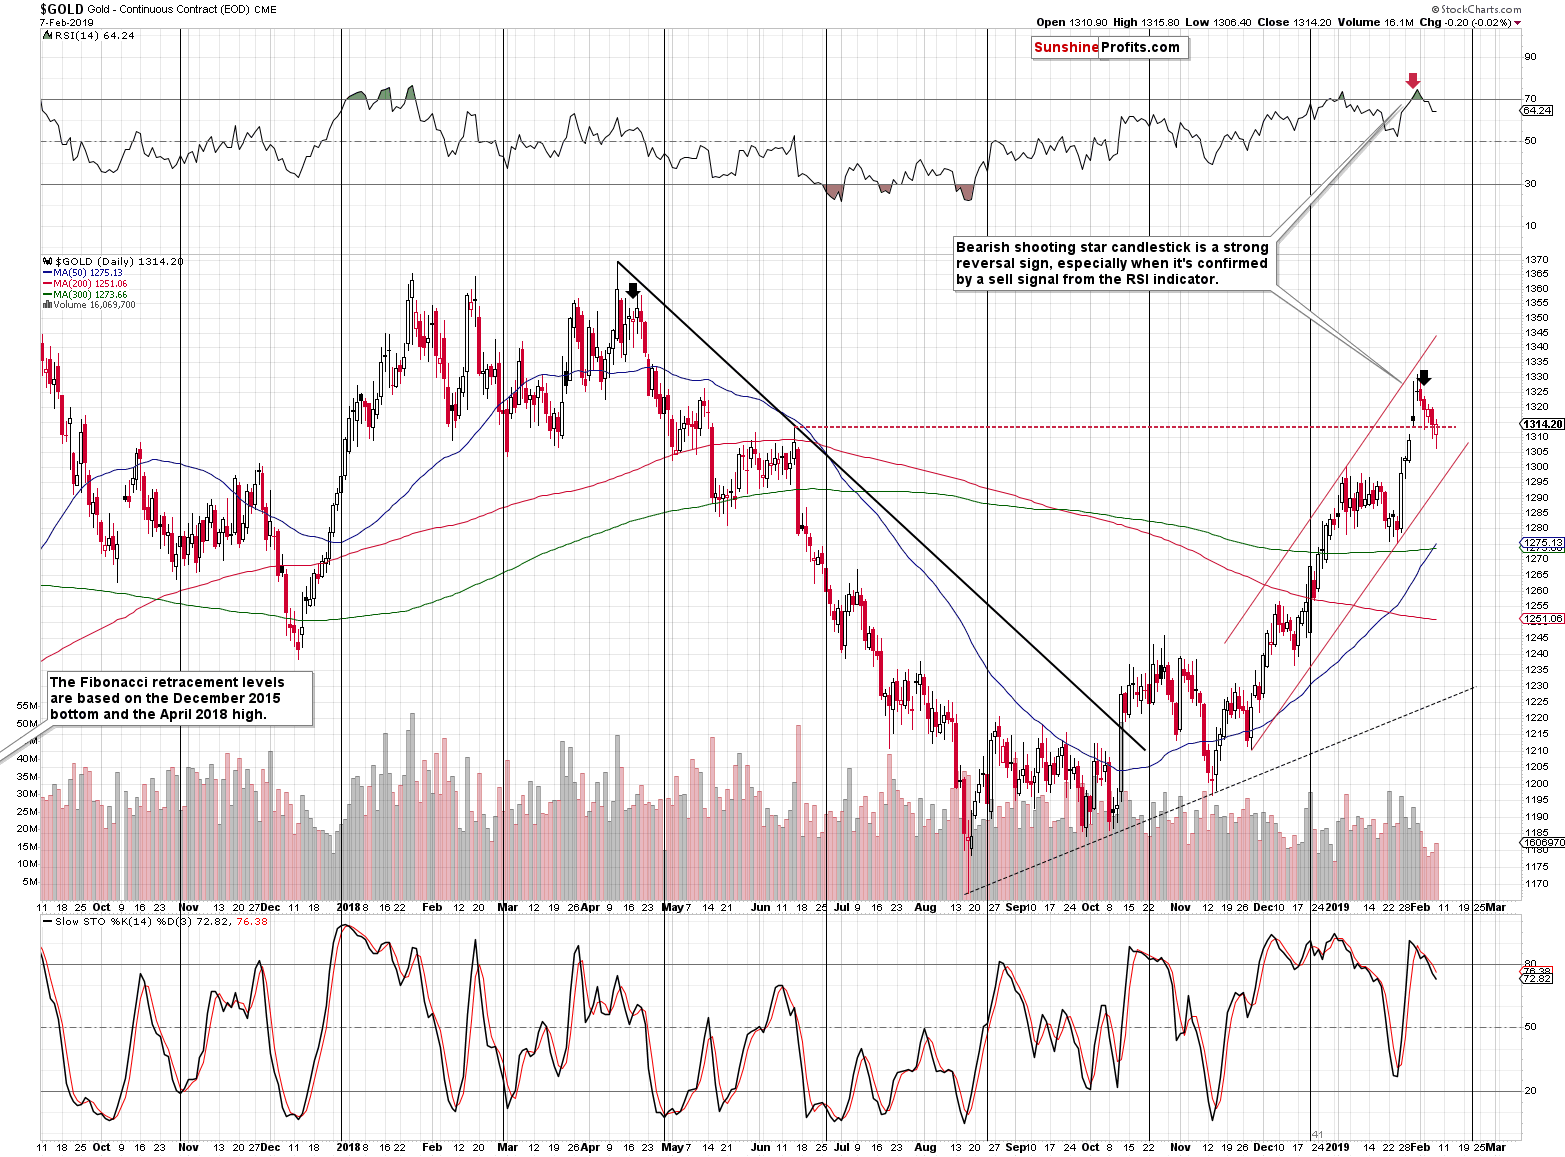
On a short-term basis, low volume during a decline might be discouraging, but it’s not. The price-volume mechanism is not symmetrical as if there were no buyers and no sellers, the price would decline, not stay at the same level. The implications of low volume are really different for the upswings and for the declines. That’s why upswings on low volume are bearish and declines on low volume are rather neutral.
Silver Update
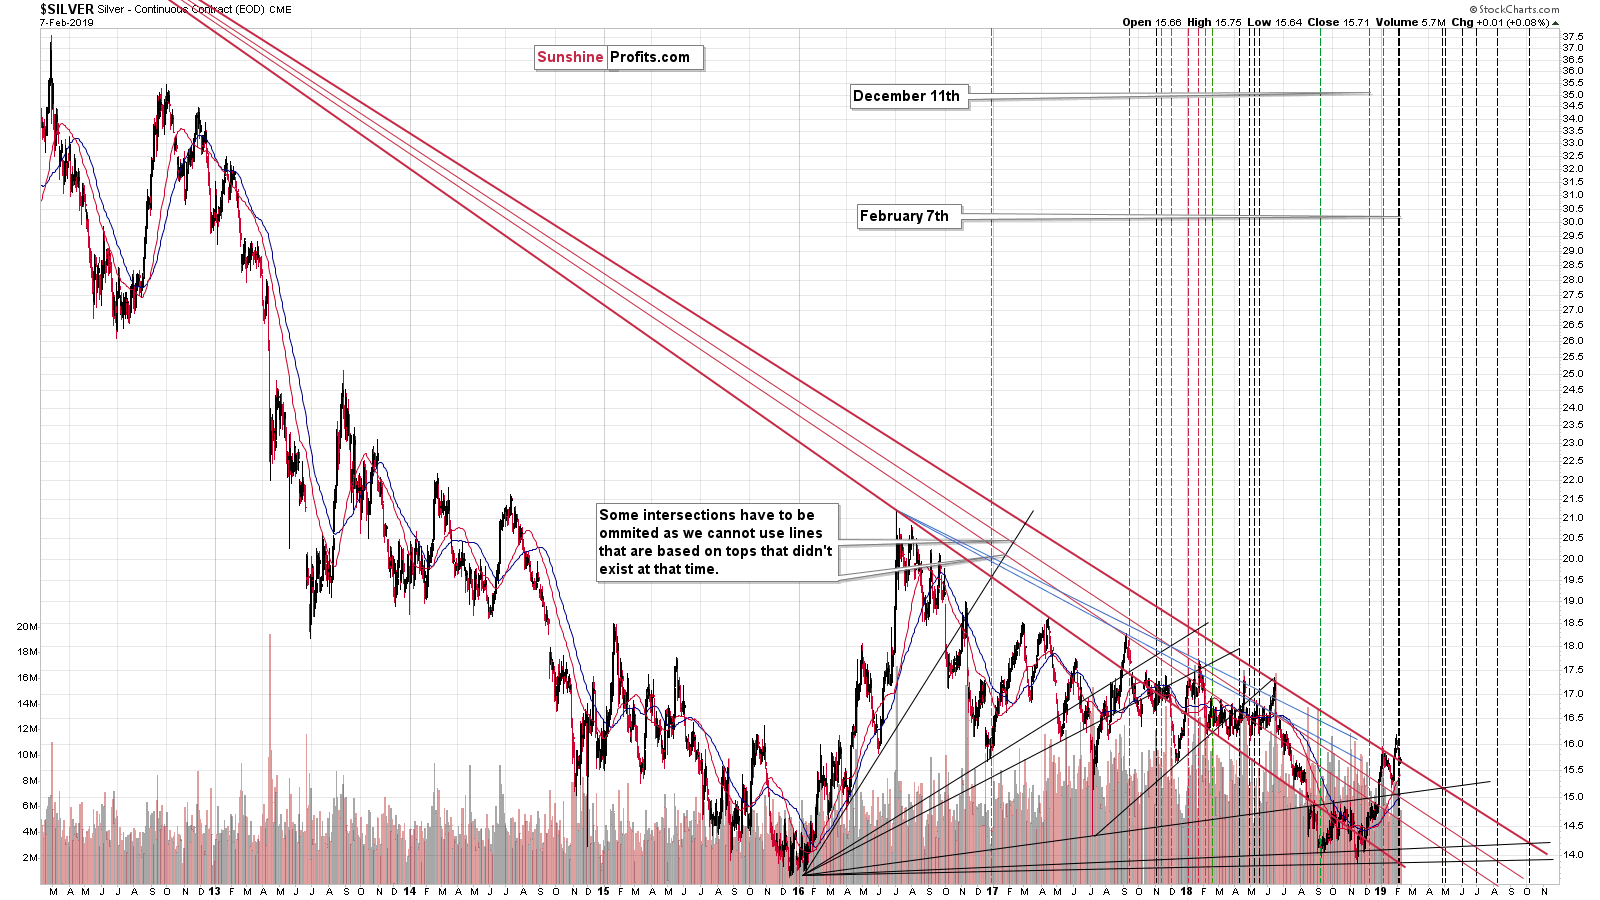
Meanwhile, silver invalidated its small breakout above the long-term resistance line, just like we expected it to. On Tuesday, we wrote the following:
Silver might move higher, even above this important line. After all, silver is known for forming fakeouts instead of breakouts. But such a move would not likely be significant. Ultimately, this line is critical so any deviation from the regular course of action (strong resistances are not easily broken) should only be temporary and rather small.
In terms of the intraday price moves, silver already invalidated the breakout above it, showing how the above works in practice. We might see another attempt, but it would very likely fail.
We have seen another attempt to move higher, and it has indeed failed. The outlook for silver is bearish.
USD Index Rising
Before summarizing, let’s take a look at the USD Index.
In short, what we wrote yesterday, remains up-to-date:
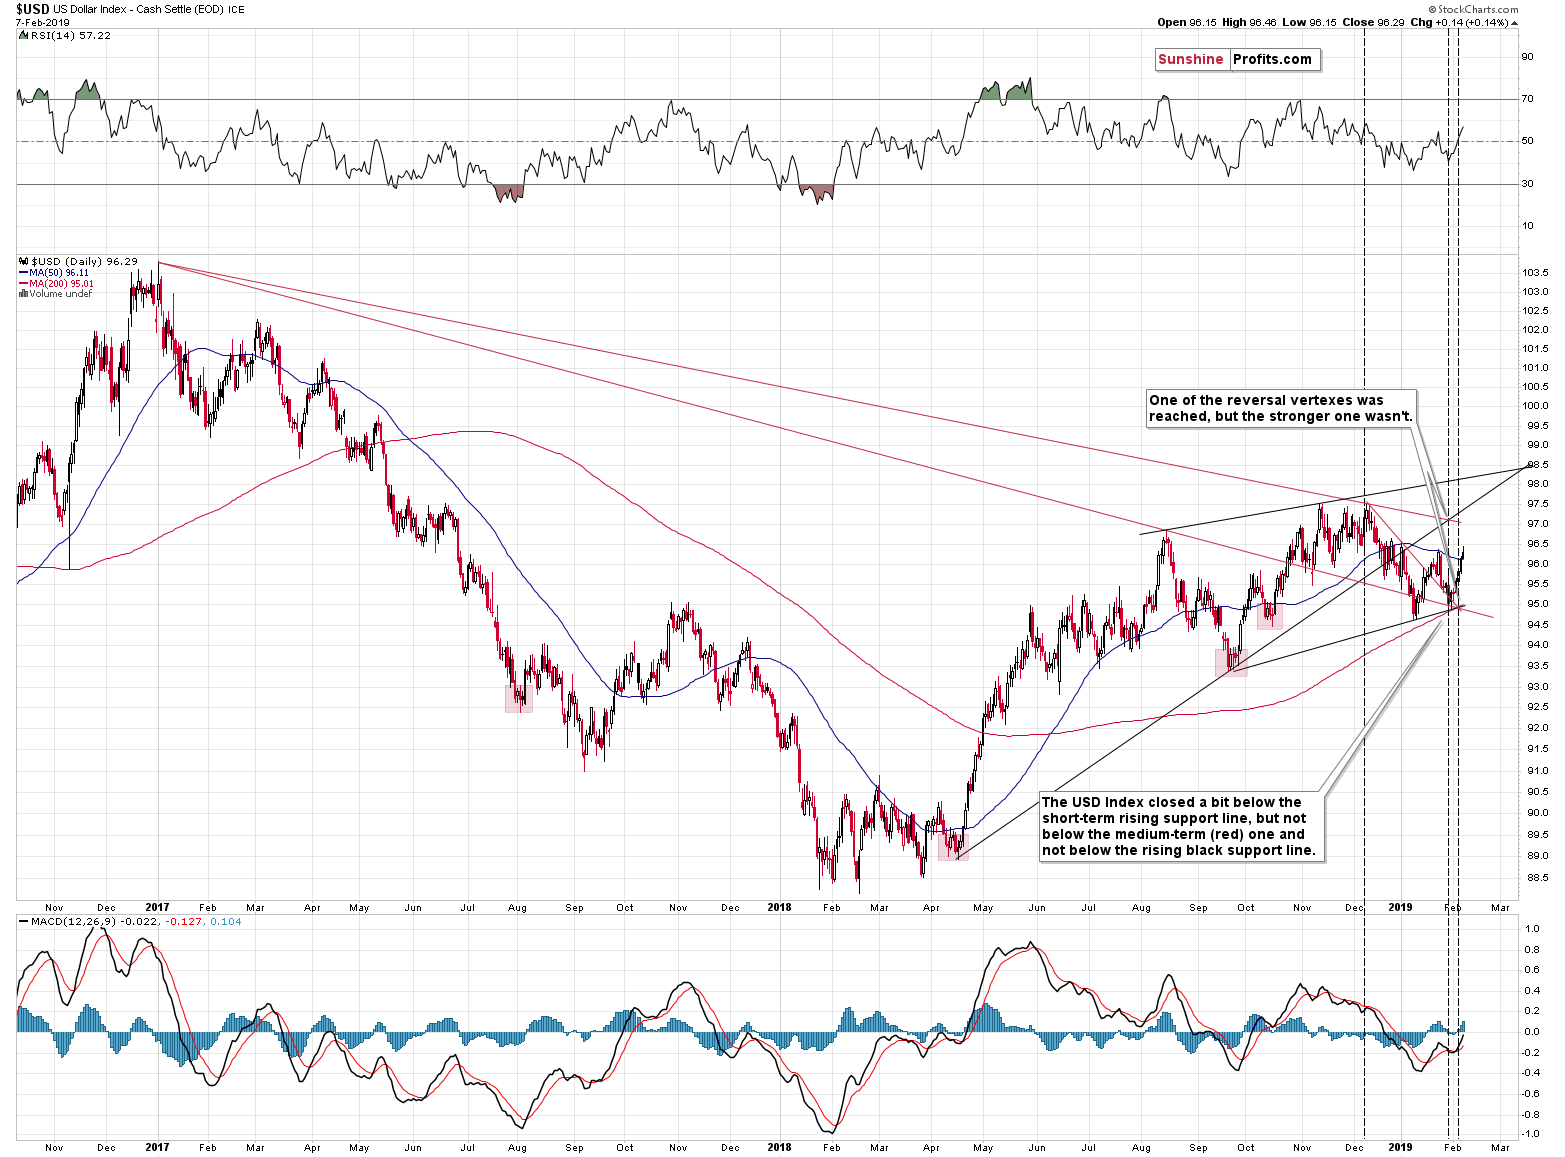
In case of the US currency, we are already right after the triple-vertex-based reversal, which increases the odds that the bottom in the USD Index is already in. In fact, we have already made profits in the currency sector based on USD’s strength. The triple-vertex-based reversal (its implication of USD Index bottom being in) is one of the reasons why it’s not particularly surprising to see higher USDX values without much lower PM values. The former may already be after their reversal, while the latter are either at it or right before it.
In this case, it will likely be the difference in the dates of reversals that causes the delay in gold’s and silver’s reaction time. We previously wrote that at times, PMs’ reaction to USDX movement can be delayed – and at this time, we have a technical reason for that.
The above may continue to have impact on the USDX and the precious metal sector this week, but it seems that the odds for another sizable upswing in the PMs and the miners have declined substantially. PMs and the miners are moving beyond their reversal dates and this means that the chance for another upswing decreases with each passing day.
Long-term Reversals Check
Speaking of the reversal dates, let’s take a look at the long-term reversals.
In short, they all indicate that the reversals have already taken place. The moves after the reversals are small so far, but they are visible in all cases. The reversals for the USD Index and for the precious metals market were not perfectly aligned and while the Fed’s dovish comments were the likely reason for USD’s early bottom, they didn’t change the reversal dates for the PMs. Consequently, the reaction in gold, silver, and mining stocks was delayed as the reversals prevented the decline in the PMs to start right along with the rally in the USD. That’s the likely reason why the current reversal in PMs is rather mild and the top is rounded instead of being sharp and volatile.
However, the shape of the reversal doesn’t change the main thing, which is that the medium-term decline has most likely already begun.
Summary
Summing up, the recent rally and kind of resilience in the PMs complex may appear encouraging, but it doesn’t change the medium-term trend and outlook, which remains bearish. Since gold, silver, and mining stocks rallied right before the very powerful combination of reversals, it means that the implications for the following weeks are bearish. We have laid out the case for seeing the rounded PMs top, for the current mild reversal characterized by little volatility. It’s the non-perfect alignment for reversal dates within the PMs and USD Index that is taking time to work its way through to the PMs decline.
As PMs and miners move beyond their reversal dates, so does the USD Index, and it becomes increasingly likely that it was the dovish comment from the Fed that triggered the reversal earlier than it was likely to present itself based on technical factors alone.
With the general decline in gold and silver, and the invalidation of the breakout in the mining stocks, it seems that the current size of the short position is justified.
The upside is quite limited, while the downside remains enormous. The turning points look to have been reached this week and any brief upswing in the metals before the huge decline starts, seems less likely with the time passing.
As always, we’ll keep you – our subscribers – informed.
To summarize:
Trading capital (supplementary part of the portfolio; our opinion): Full short positions (250% of the full position) in gold, silver and mining stocks are justified from the risk/reward perspective with the following stop-loss orders and exit profit-take price levels:
- Gold: profit-take exit price: $1,062; stop-loss: $1,337; initial target price for the DGLD ETN: $82.96; stop-loss for the DGLD ETN $41.27
- Silver: profit-take exit price: $12.32; stop-loss: $16.44; initial target price for the DSLV ETN: $47.67; stop-loss for the DSLV ETN $24.18
- Mining stocks (price levels for the GDX ETF): profit-take exit price: $13.12; stop-loss: $23.27; initial target price for the DUST ETF: $80.97; stop-loss for the DUST ETF $16.27
Note: the above is a specific preparation for a possible sudden price drop, it does not reflect the most likely outcome. You will find a more detailed explanation in our August 1st Alert. In case one wants to bet on junior mining stocks’ prices (we do not suggest doing so – we think senior mining stocks are more predictable in the case of short-term trades – if one wants to do it anyway, we provide the details), here are the stop-loss details and target prices:
- GDXJ ETF: profit-take exit price: $17.52; stop-loss: $34.62
- JDST ETF: initial target price: $154.97 stop-loss: $35.87
Long-term capital (core part of the portfolio; our opinion): No positions (in other words: cash)
Insurance capital (core part of the portfolio; our opinion): Full position
Important Details for New Subscribers
Whether you already subscribed or not, we encourage you to find out how to make the most of our alerts and read our replies to the most common alert-and-gold-trading-related-questions.
Please note that the in the trading section we describe the situation for the day that the alert is posted. In other words, it we are writing about a speculative position, it means that it is up-to-date on the day it was posted. We are also featuring the initial target prices, so that you can decide whether keeping a position on a given day is something that is in tune with your approach (some moves are too small for medium-term traders and some might appear too big for day-traders).
Plus, you might want to read why our stop-loss orders are usually relatively far from the current price.
Please note that a full position doesn’t mean using all of the capital for a given trade. You will find details on our thoughts on gold portfolio structuring in the Key Insights section on our website.
As a reminder – “initial target price” means exactly that – an “initial” one, it’s not a price level at which we suggest closing positions. If this becomes the case (like it did in the previous trade) we will refer to these levels as levels of exit orders (exactly as we’ve done previously). Stop-loss levels, however, are naturally not “initial”, but something that, in our opinion, might be entered as an order.
Since it is impossible to synchronize target prices and stop-loss levels for all the ETFs and ETNs with the main markets that we provide these levels for (gold, silver and mining stocks – the GDX ETF), the stop-loss levels and target prices for other ETNs and ETF (among other: UGLD, DGLD, USLV, DSLV, NUGT, DUST, JNUG, JDST) are provided as supplementary, and not as “final”. This means that if a stop-loss or a target level is reached for any of the “additional instruments” (DGLD for instance), but not for the “main instrument” (gold in this case), we will view positions in both gold and DGLD as still open and the stop-loss for DGLD would have to be moved lower. On the other hand, if gold moves to a stop-loss level but DGLD doesn’t, then we will view both positions (in gold and DGLD) as closed. In other words, since it’s not possible to be 100% certain that each related instrument moves to a given level when the underlying instrument does, we can’t provide levels that would be binding. The levels that we do provide are our best estimate of the levels that will correspond to the levels in the underlying assets, but it will be the underlying assets that one will need to focus on regarding the signs pointing to closing a given position or keeping it open. We might adjust the levels in the “additional instruments” without adjusting the levels in the “main instruments”, which will simply mean that we have improved our estimation of these levels, not that we changed our outlook on the markets. We are already working on a tool that would update these levels on a daily basis for the most popular ETFs, ETNs and individual mining stocks.
Our preferred ways to invest in and to trade gold along with the reasoning can be found in the how to buy gold section. Additionally, our preferred ETFs and ETNs can be found in our Gold & Silver ETF Ranking.
As a reminder, Gold & Silver Trading Alerts are posted before or on each trading day (we usually post them before the opening bell, but we don't promise doing that each day). If there's anything urgent, we will send you an additional small alert before posting the main one.
=====
Latest Free Trading Alerts:
The old continent is dying. The euro is on the brink of collapse. This is what you can often hear in the press. But is that really the case? We invite you to read our today’s article about the development of the Eurozone in the last twenty years and find out what are the real prospect of the euro – and what does it imply for the gold market.
=====
Thank you.
Sincerely,
Przemyslaw Radomski, CFA
Editor-in-chief, Gold & Silver Fund Manager

