

Briefly: In our opinion, full (150% of the regular size of the position) speculative short positions in gold, silver and mining stocks are justified from the risk/reward perspective at the moment of publishing this alert.
The precious metals sector has been on the rise this year, right? Then why are its two key parts below the first close of the year? If that’s not shocking, it definitely becomes such if you consider that the USD Index is over 1.2 index points below the January close. What’s REALLY going on in the precious metals sector?
It’s topping – that’s what’s going on. The more profound the top, the more time it can take for all the factors to play out. We have multiple bearish factors in play at this time. The mining stocks’ underperformance is back. At the same time, gold is much more willing to react to the USD’s upswings than daily (and even intraday) declines. That’s a powerful bearish combination.
Let’s examine the charts for today (chart courtesy of http://stockcharts.com).
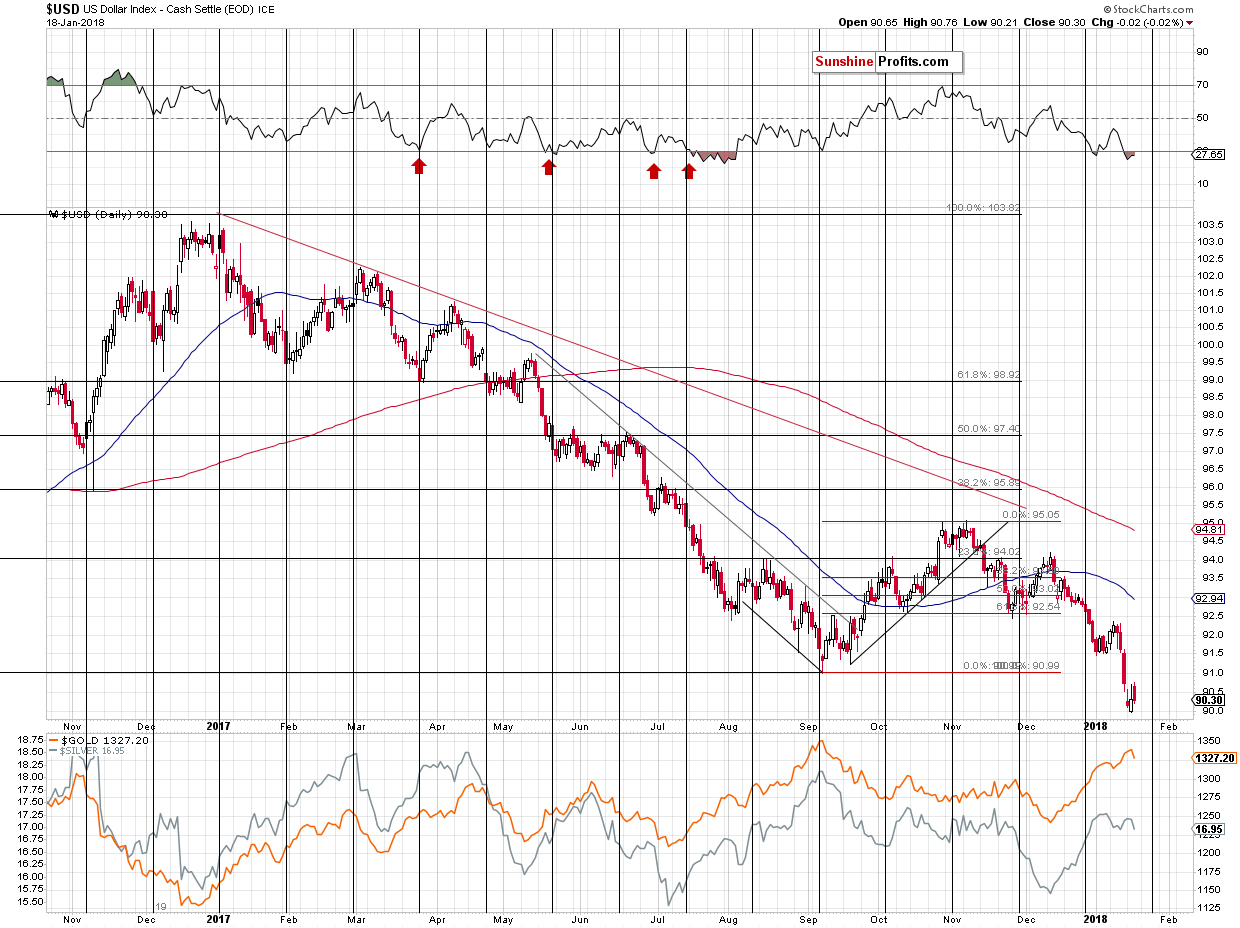
The USD Index moved higher today but only initially. After the initial upswing, the USD moved back down and ended the session without a meaningful change. Consequently, one might have expected gold to move down initially, but then to move back up and close the session unchanged. That would be the neutral reaction. What did gold futures do?
Gold futures declined, proving the bearish nature of the most recent price swings. Gold has moved higher today ($1,336 at the moment of writing these words), while the USD moved to 90.21, but is this bullish? Not really. With the USD at the recent lows, gold should be at $1,345 or so and it’s well below this level.
In other words, gold’s bullish vulnerability still seems to have become gold’s bearish vulnerability.
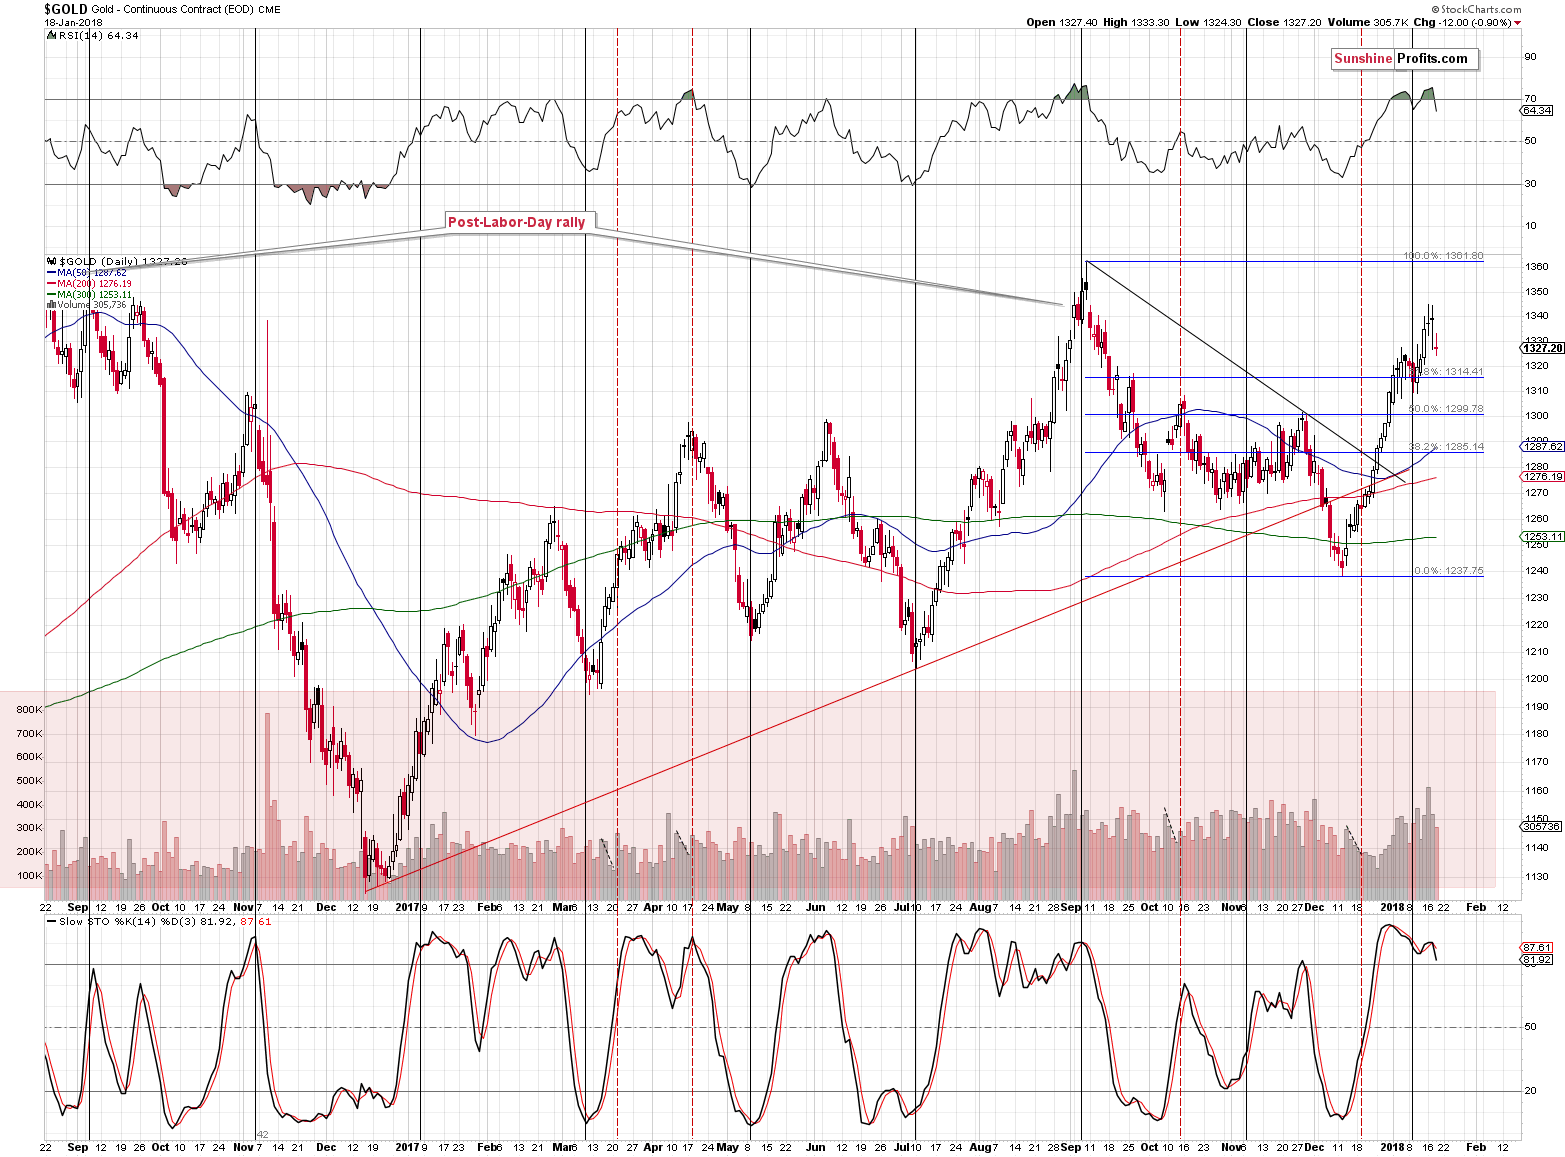
Another thing that may appear bullish, but really isn’t is the relatively low level of volume that accompanied yesterday’s decline. Please keep in mind that the situation in volume is not symmetrical. If there are no bids and no sell orders, the price does not stay at the same level – it moves lower. In consequence, a rally on low volume is bearish, but a decline on low volume is neutral.
The above is a general observation. In the above case, we also have a specific analogy that we should take into account. Namely, back in September, when gold moved lower right after topping, it did so on relatively low volume. So, should the low volume during a decline be viewed as something bullish? No.
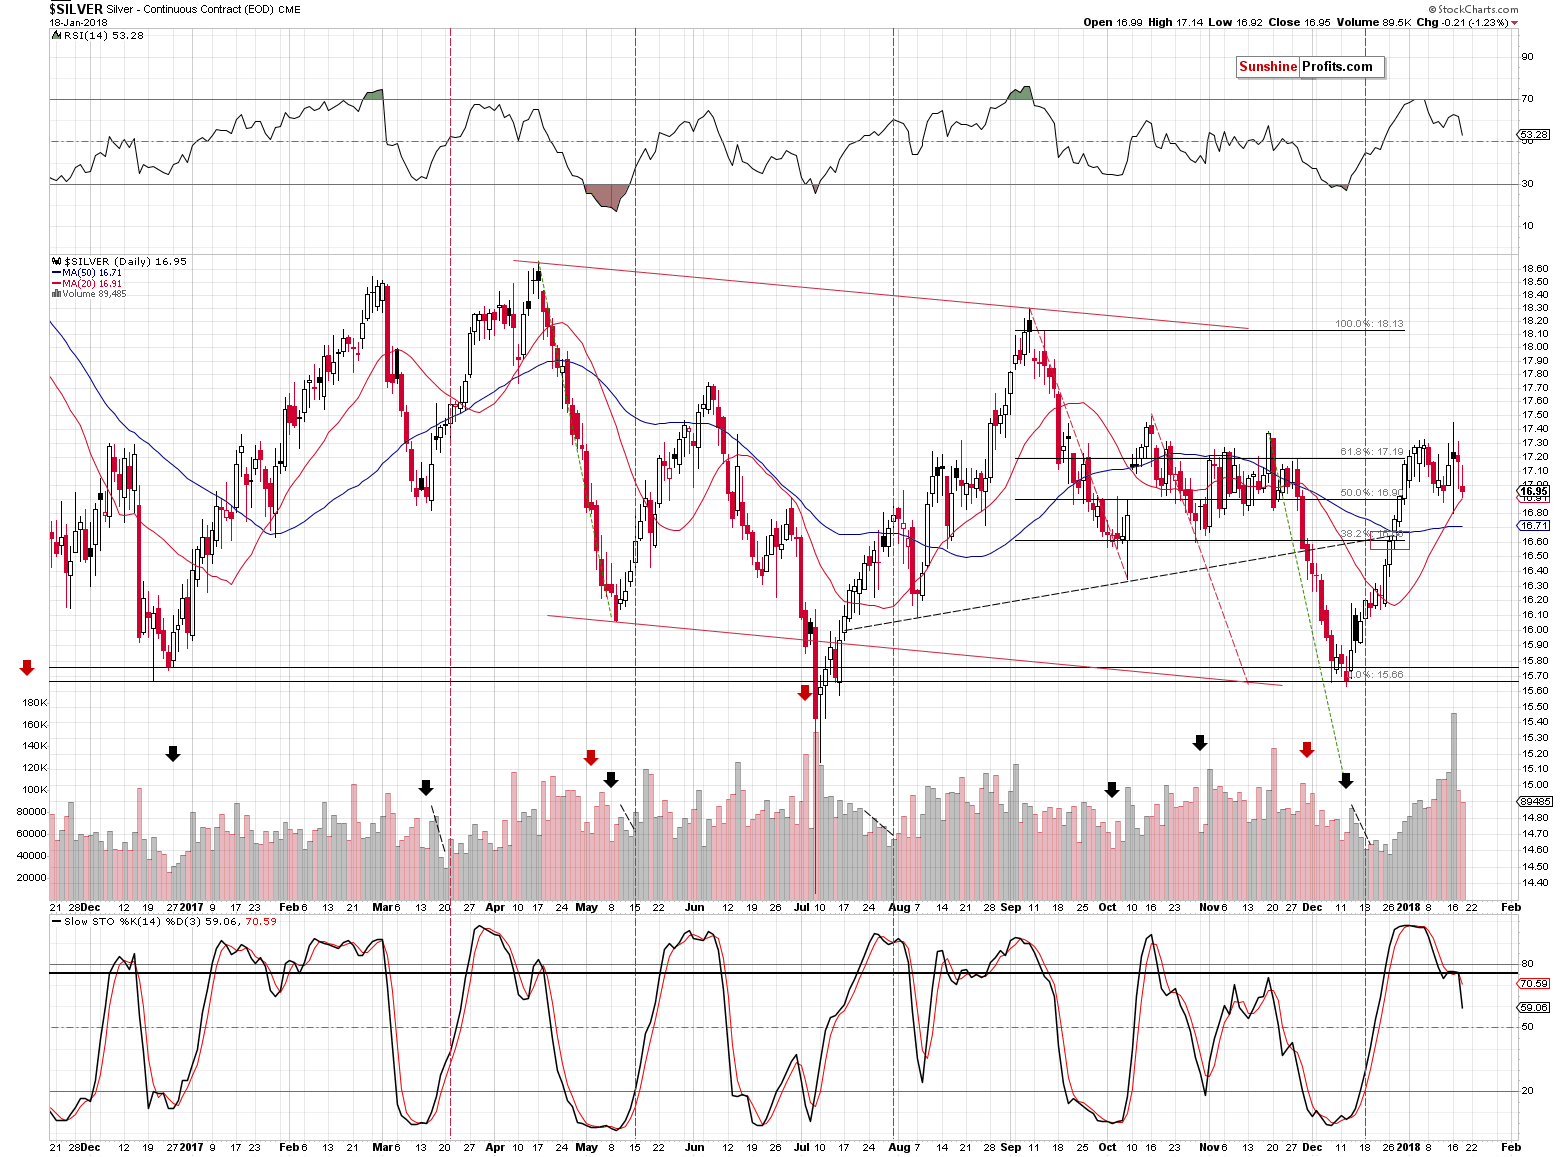
Silver closed yesterday’s session not only below the January 2nd close, but also below the December 31st, 2017 close. In other words, 2018 is a down year for silver, even considering the current price of $17.07.
This is particularly shocking given the very strong performance of the general stock market, with which silver is traditionally more correlated than gold. Silver simply does not want to move higher and this is based on more than just a day or two – this has been the case for weeks.
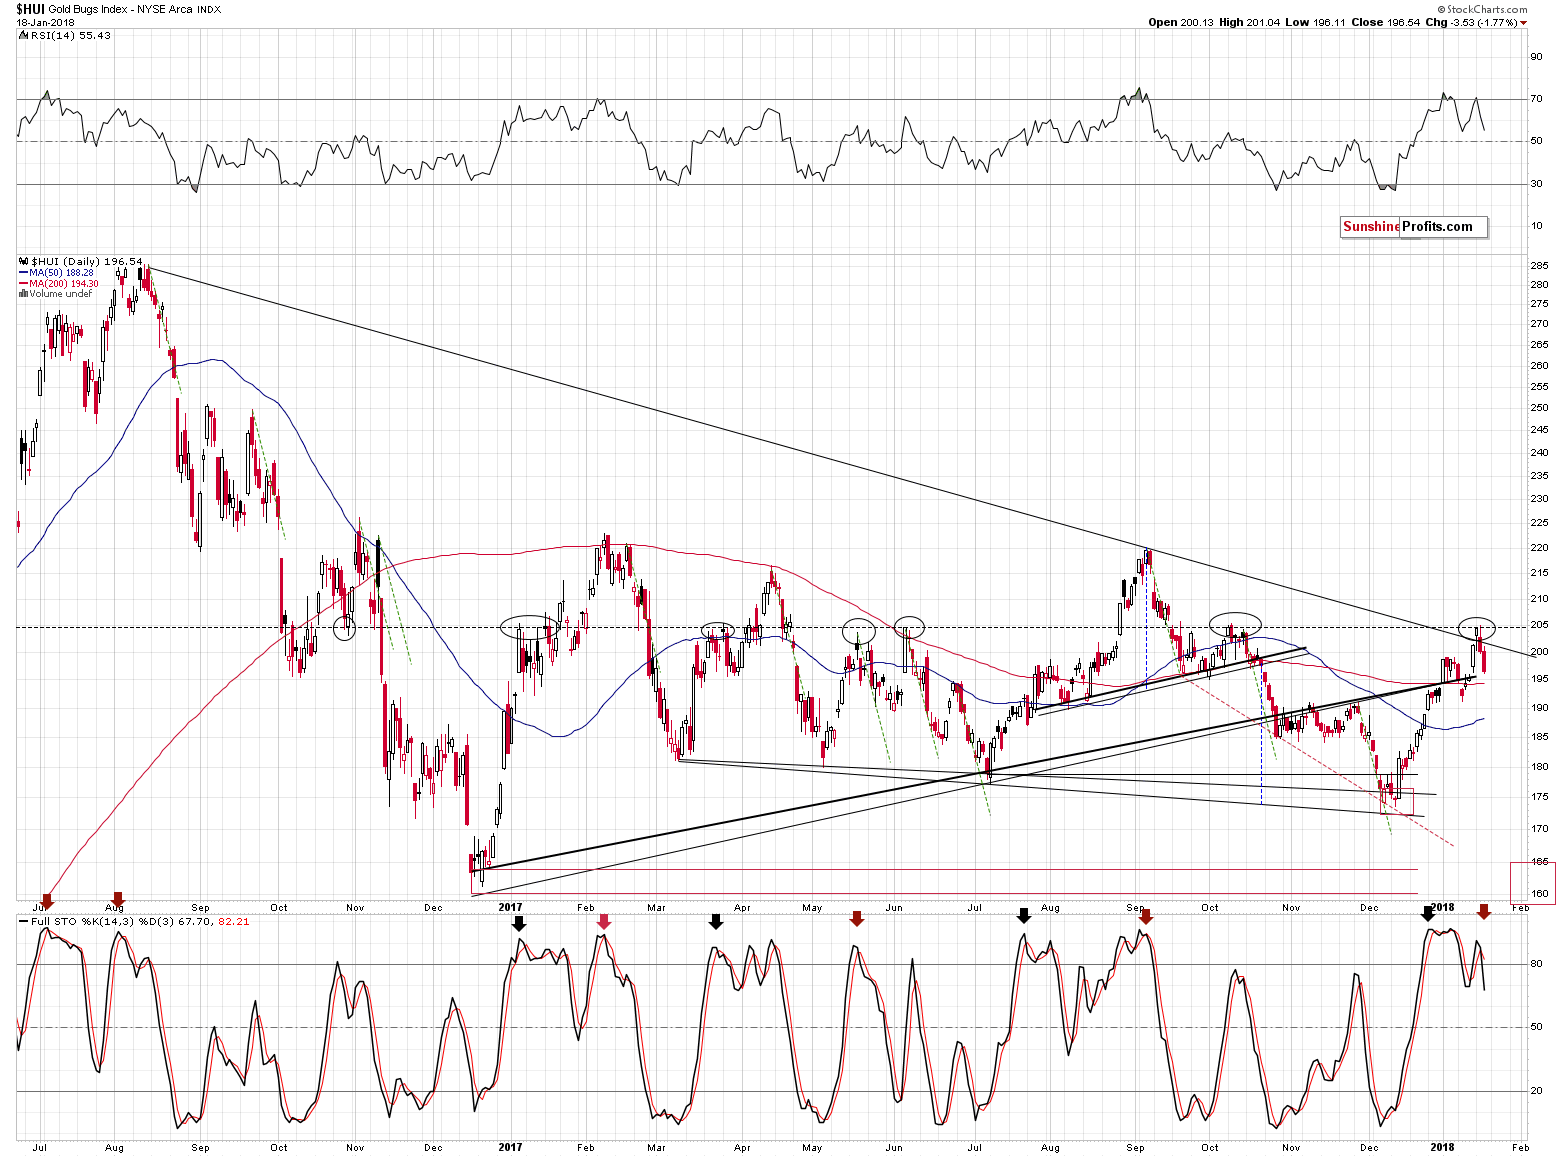
Gold stocks moved lower once again yesterday and this time the daily closing price was not only below the declining resistance line, but below the first closing price of the year and almost back below the rising support line.
It’s also worth noting that the Stochastic indicator flashed its sell signal. In yesterday’s alert, we commented on this possibility in the following way:
We haven’t seen the sell signal just yet, but it seems one is coming as yesterday’s invalidation is likely to be followed by at least a brief decline. The brief decline is something that would likely trigger a sell signal in the Stochastic, opening a technical way to much bigger declines.
The mentioned bigger decline could already be underway.
Most importantly, however, gold stocks are once again underperforming gold.
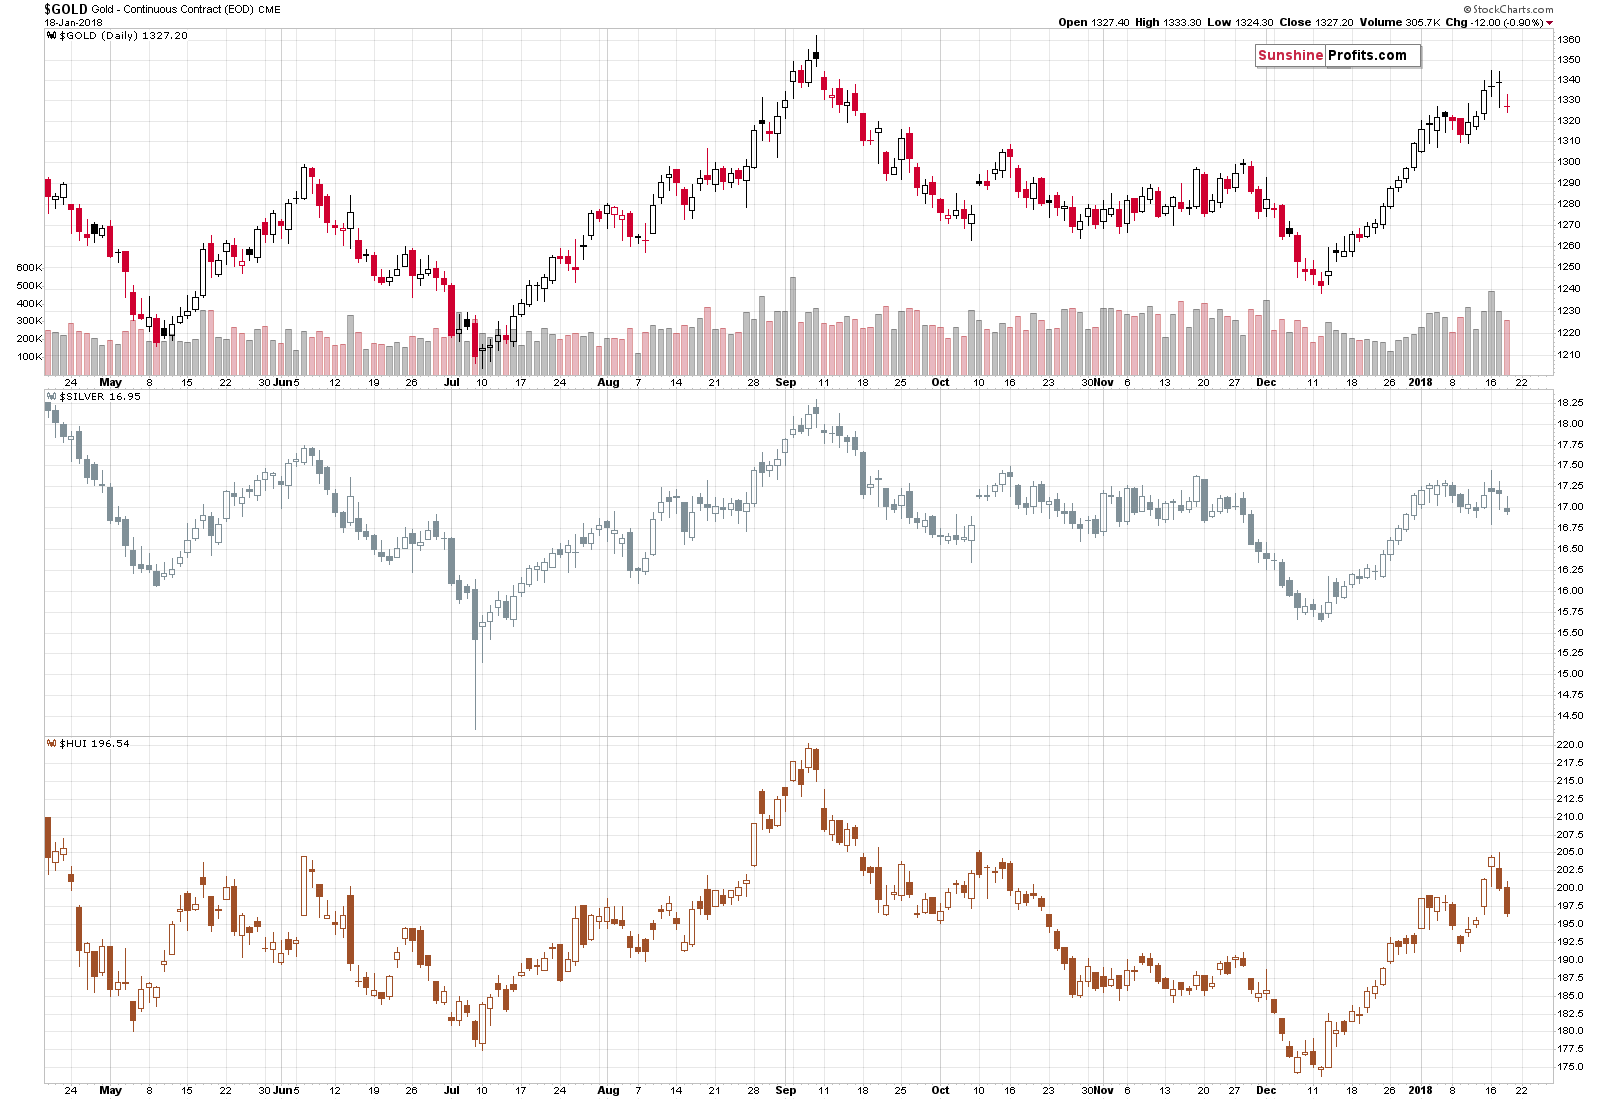
The above chart clearly shows the extent to which gold miners have underperformed gold. While the yellow metal is only a bit lower (relatively speaking), gold stocks have declined in a quite profound manner. That’s something that confirms tops very often, so the implications here are definitely bearish.
Summing up, the way gold reacted to the USD’s movement in the past few days continues to point to lower gold prices, while yesterday’s big decline in mining stocks suggests that silver’s volume signal is likely to come into play sooner rather than later. In fact, these factors indicate that the top is already in. Even if this isn’t the case, it seems that the top is at hand. The next big downswing seems to be just around the corner.
As always, we will keep you – our subscribers – informed.
To summarize:
Trading capital (supplementary part of the portfolio; our opinion): Full short positions (150% of the full position) in gold, silver and mining stocks are justified from the risk/reward perspective with the following stop-loss orders and initial target price levels:
- Gold: initial target price: $1,218; stop-loss: $1,364; initial target price for the DGLD ETN: $53.98; stop-loss for the DGLD ETN $38.28
- Silver: initial target price: $14.63; stop-loss: $17.72; initial target price for the DSLV ETN: $33.88; stop-loss for the DSLV ETN $21.28
- Mining stocks (price levels for the GDX ETF): initial target price: $19.22; stop-loss: $26.14; initial target price for the DUST ETF: $39.88; stop-loss for the DUST ETF $19.78
In case one wants to bet on junior mining stocks' prices (we do not suggest doing so – we think senior mining stocks are more predictable in the case of short-term trades – if one wants to do it anyway, we provide the details), here are the stop-loss details and initial target prices:
- GDXJ ETF: initial target price: $27.82; stop-loss: $38.22
- JDST ETF: initial target price: $94.88 stop-loss: $37.78
Long-term capital (core part of the portfolio; our opinion): No positions (in other words: cash)
Insurance capital (core part of the portfolio; our opinion): Full position
Important Details for New Subscribers
Whether you already subscribed or not, we encourage you to find out how to make the most of our alerts and read our replies to the most common alert-and-gold-trading-related-questions.
Please note that the in the trading section we describe the situation for the day that the alert is posted. In other words, it we are writing about a speculative position, it means that it is up-to-date on the day it was posted. We are also featuring the initial target prices, so that you can decide whether keeping a position on a given day is something that is in tune with your approach (some moves are too small for medium-term traders and some might appear too big for day-traders).
Plus, you might want to read why our stop-loss orders are usually relatively far from the current price.
Please note that a full position doesn’t mean using all of the capital for a given trade. You will find details on our thoughts on gold portfolio structuring in the Key Insights section on our website.
As a reminder – “initial target price” means exactly that – an “initial” one, it’s not a price level at which we suggest closing positions. If this becomes the case (like it did in the previous trade) we will refer to these levels as levels of exit orders (exactly as we’ve done previously). Stop-loss levels, however, are naturally not “initial”, but something that, in our opinion, might be entered as an order.
Since it is impossible to synchronize target prices and stop-loss levels for all the ETFs and ETNs with the main markets that we provide these levels for (gold, silver and mining stocks – the GDX ETF), the stop-loss levels and target prices for other ETNs and ETF (among other: UGLD, DGLD, USLV, DSLV, NUGT, DUST, JNUG, JDST) are provided as supplementary, and not as “final”. This means that if a stop-loss or a target level is reached for any of the “additional instruments” (DGLD for instance), but not for the “main instrument” (gold in this case), we will view positions in both gold and DGLD as still open and the stop-loss for DGLD would have to be moved lower. On the other hand, if gold moves to a stop-loss level but DGLD doesn’t, then we will view both positions (in gold and DGLD) as closed. In other words, since it’s not possible to be 100% certain that each related instrument moves to a given level when the underlying instrument does, we can’t provide levels that would be binding. The levels that we do provide are our best estimate of the levels that will correspond to the levels in the underlying assets, but it will be the underlying assets that one will need to focus on regarding the signs pointing to closing a given position or keeping it open. We might adjust the levels in the “additional instruments” without adjusting the levels in the “main instruments”, which will simply mean that we have improved our estimation of these levels, not that we changed our outlook on the markets. We are already working on a tool that would update these levels on a daily basis for the most popular ETFs, ETNs and individual mining stocks.
Our preferred ways to invest in and to trade gold along with the reasoning can be found in the how to buy gold section. Additionally, our preferred ETFs and ETNs can be found in our Gold & Silver ETF Ranking.
As a reminder, Gold & Silver Trading Alerts are posted before or on each trading day (we usually post them before the opening bell, but we don't promise doing that each day). If there's anything urgent, we will send you an additional small alert before posting the main one.
=====
Latest Free Trading Alerts:
Our base scenario for 2018 is rather bearish for the gold market. However, there are some upside risks for the gold market, which could materialize in 2018. We invite you to read our today’s article about them and find out what are the potential factors that could send gold prices higher in 2018.
Yields on U.S. Treasuries have leaped recently. It will wreck the yellow metal. Or maybe not.
Will Surge in Bond Yields Smash Gold?
S&P 500 index gained 0.9% on Wednesday, as it retraced its Tuesday's decline. Is this a topping pattern or just relatively flat correction within an uptrend?
S&P 500 Reversed Higher, No Fear Again
=====
Hand-picked precious-metals-related links:
PRECIOUS-Gold up on weaker dollar, but heads for first weekly loss in 6
Chile’s regulator orders permanent closure of Barrick's Pascua-Lama mine
=====
In other news:
Dollar hurt by U.S. shutdown fears, Treasury yields at highest since 2014
Government Closing Near as GOP Bill at Brink: Shutdown Update
SEC says bitcoin funds raise 'investor protection issues'
IEA Sees ‘Explosive’ Growth in U.S. Oil Output As Prices Rally
=====
Thank you.
Sincerely,
Przemyslaw Radomski, CFA
Founder, Editor-in-chief, Gold & Silver Fund Manager
Gold & Silver Trading Alerts
Forex Trading Alerts
Oil Investment Updates
Oil Trading Alerts

