

Briefly: In our opinion, full (200% of the regular size of the position) speculative short positions in gold, silver and mining stocks are justified from the risk/reward perspective at the moment of publishing this alert.
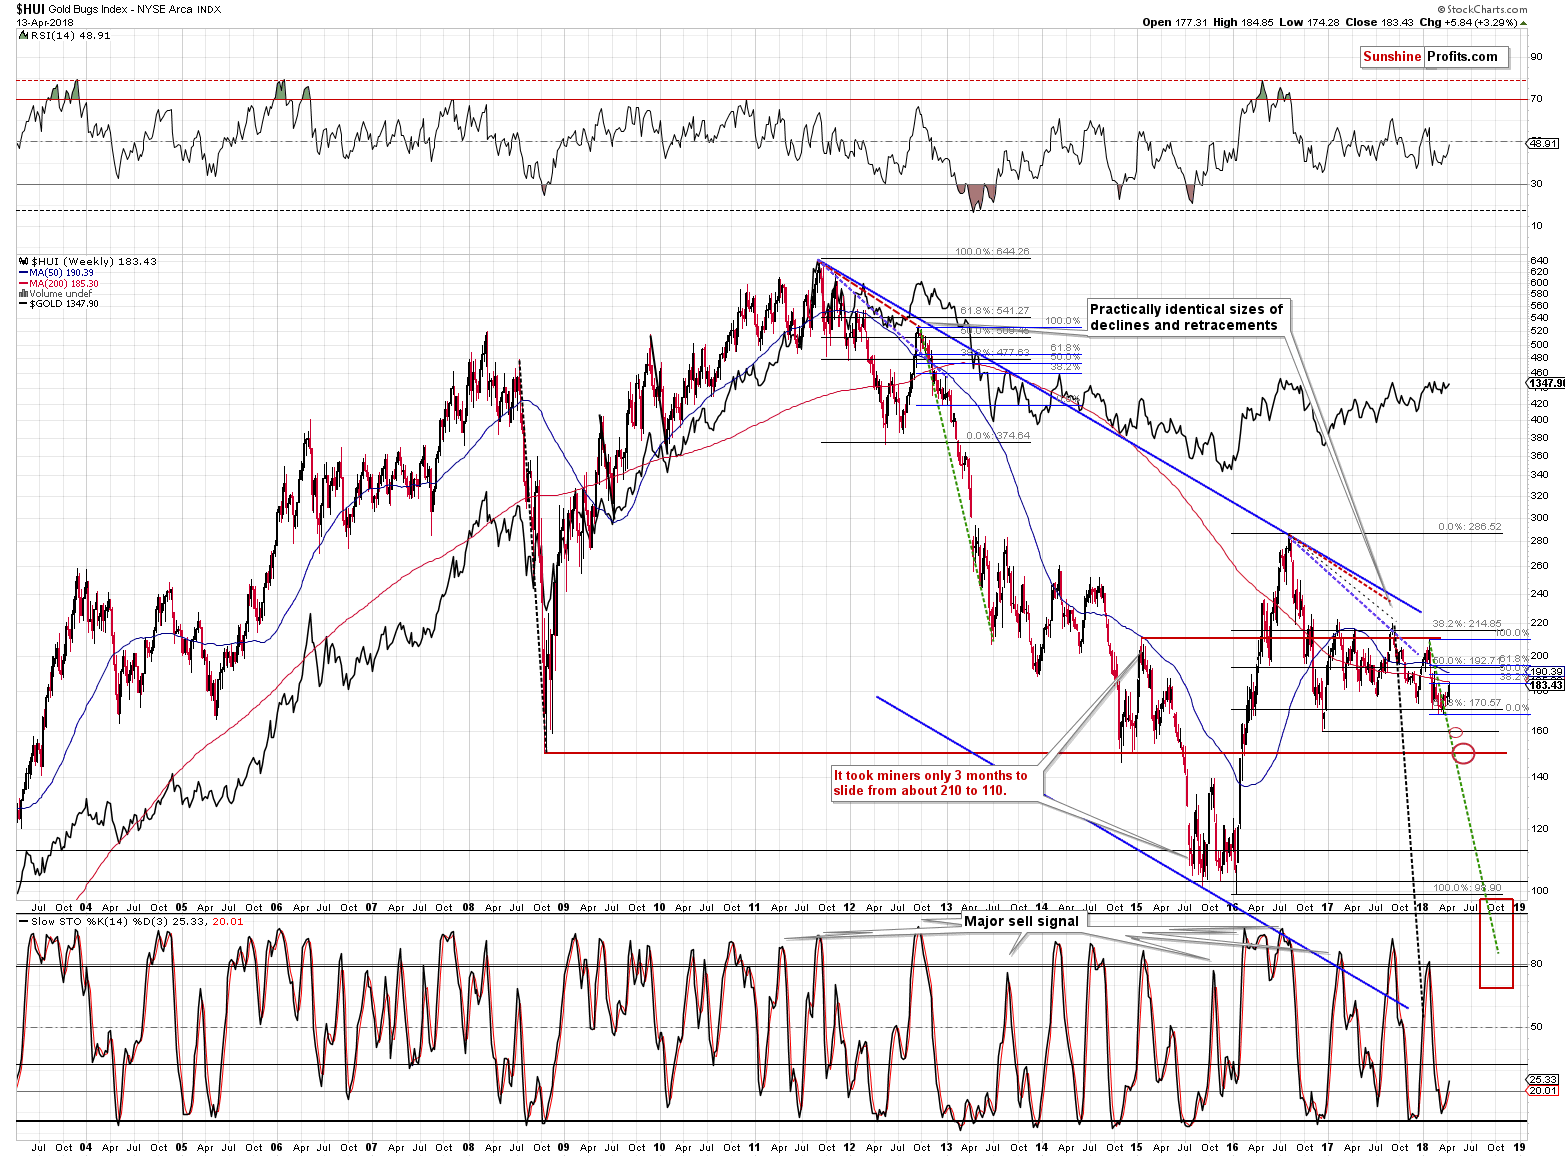
The strength in gold stocks was not a one-day event. Despite the daily reversal that we saw during last week, gold miners managed to close the week at a new monthly high. In fact, Friday’s close was the highest close in the GDX ETF in 2 months. The HUI to gold ratio increased significantly in the last few days as well. The strength in mining stocks seems to be indicating that the rally in the entire precious metals sector is only beginning. What’s next?
Most likely, a disappointment for those who believe this single seemingly bullish factor. There’s no denying that gold stocks rallied and that they have rallied more than gold in the past few days. But… It’s all normal. It all falls in line with what we saw during previous consolidations during bigger declines. Let’s take a closer look, starting with the metals (chart courtesy of http://stockcharts.com).
Gold and Silver Erase Earlier Rallies
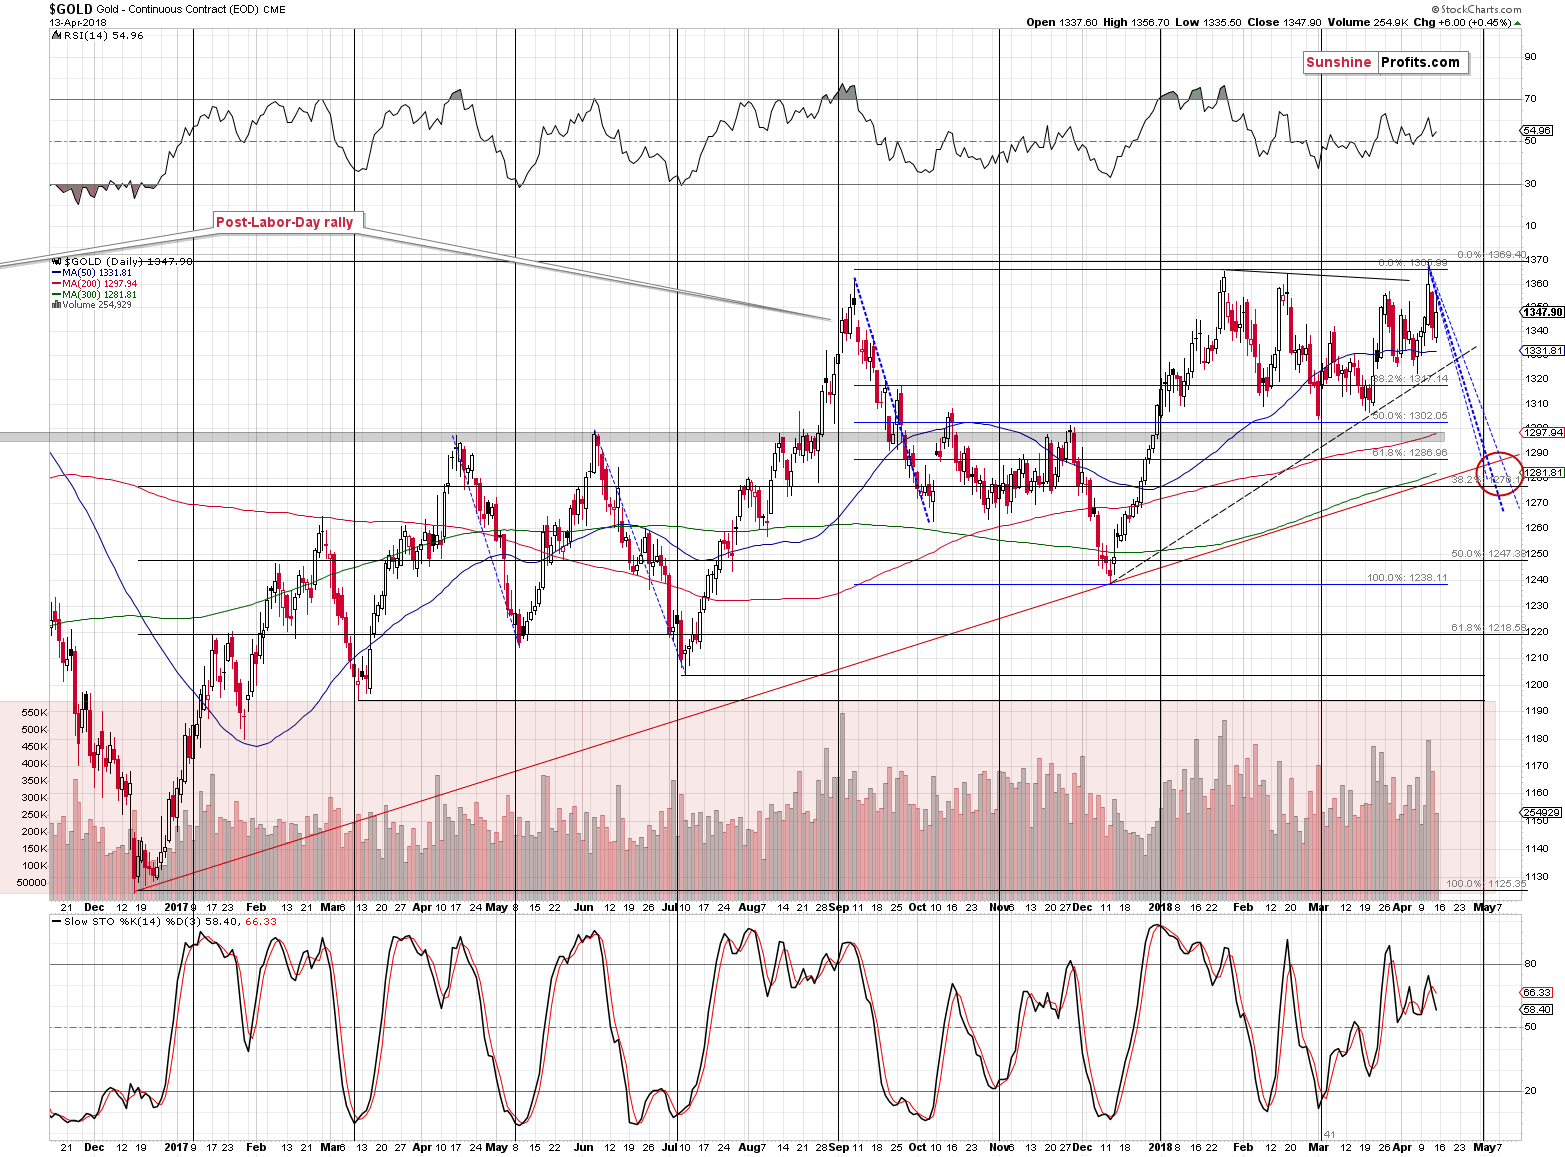
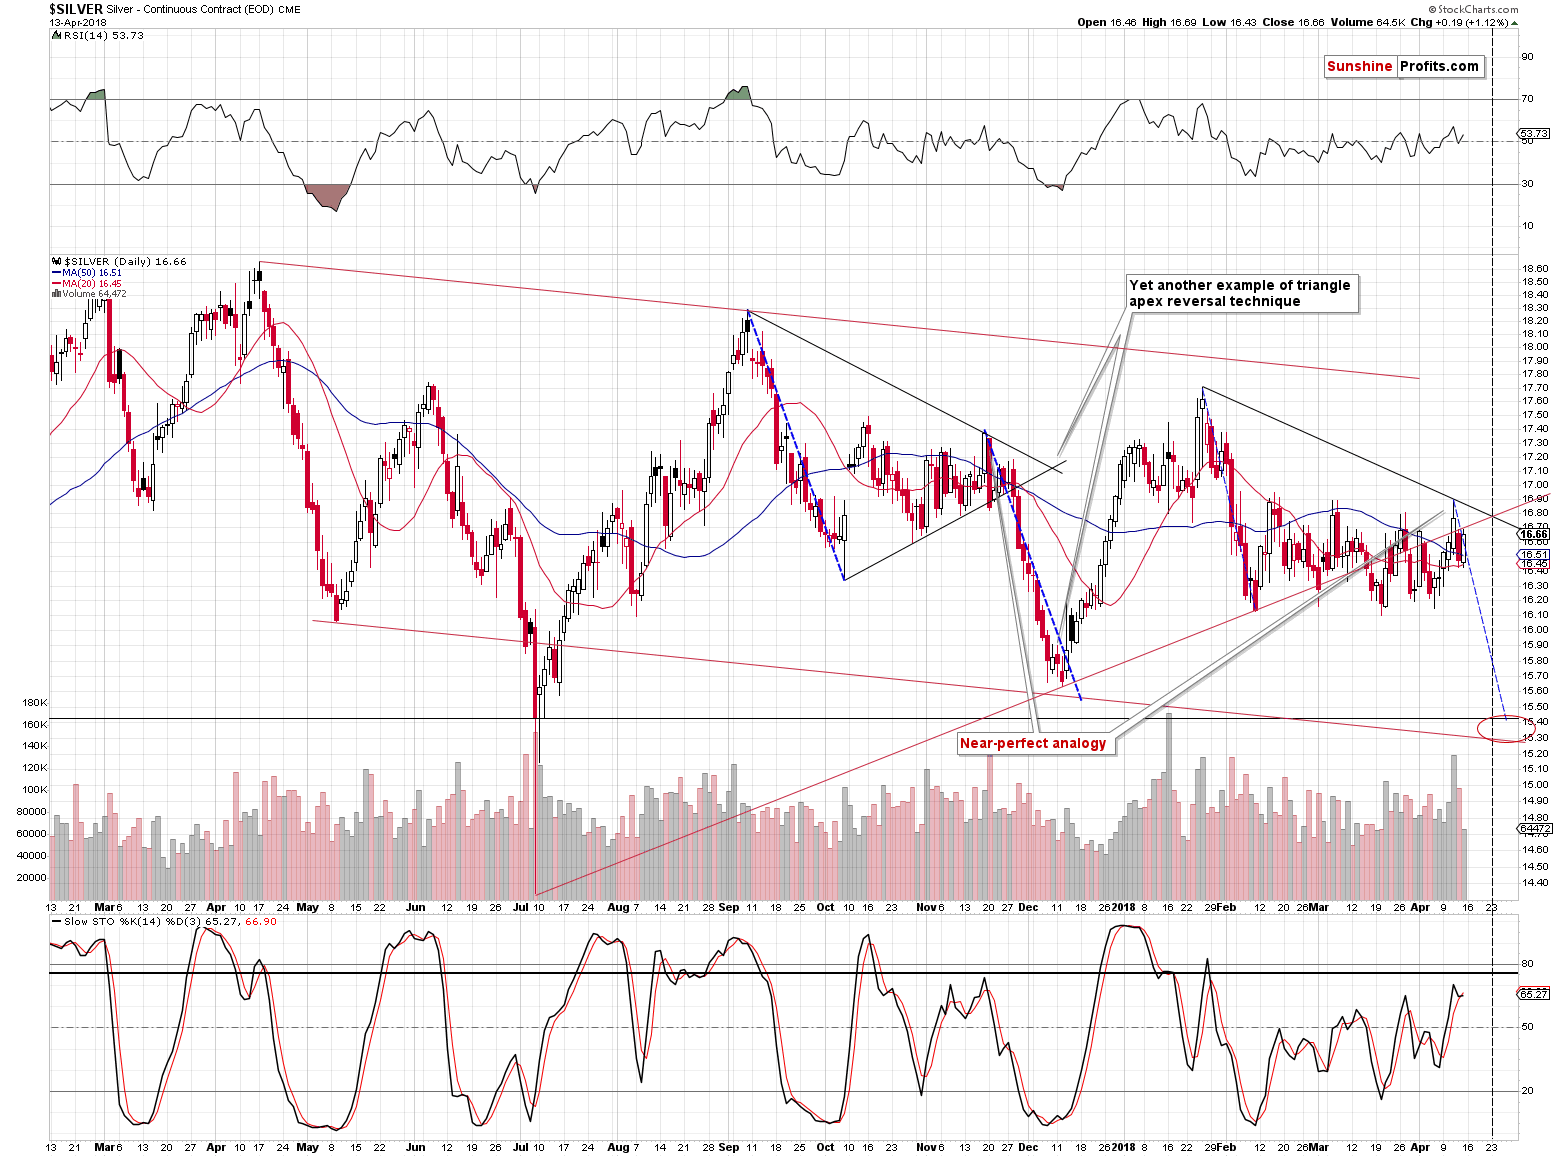
Both metals moved higher on Friday and in both cases the rally was quite in tune with what we can expect at this stage of a decline. Please note the declining blue lines, which represent the previous declines. In both cases, the price declines on average at the same or very similar pace.
The volume was relatively low in both metals and in the case of silver, it was the lowest volume that we had seen in almost a month. This suggests that the upswing is a small correction within a decline, not a start of something more meaningful.
Both markets point to the next reversal close to the end of the April, though silver may bottom sooner due to its self-similar pattern. Just as the white metal declined in a sharper manner in early December, it could get ahead of itself during this decline. It’s not a sure bet, but it shouldn’t surprise us.
All in all, the outlook for the metals remains bearish.
Mining Stocks – What Changed and What Didn’t
Miners held up very well last week and even managed to close it at a new weekly high. In Friday’s alert, we wrote that Thursday’s resilience was nothing to call home about, but since we saw another daily show of strength, once again, the question is if this makes the outlook somewhat bullish.
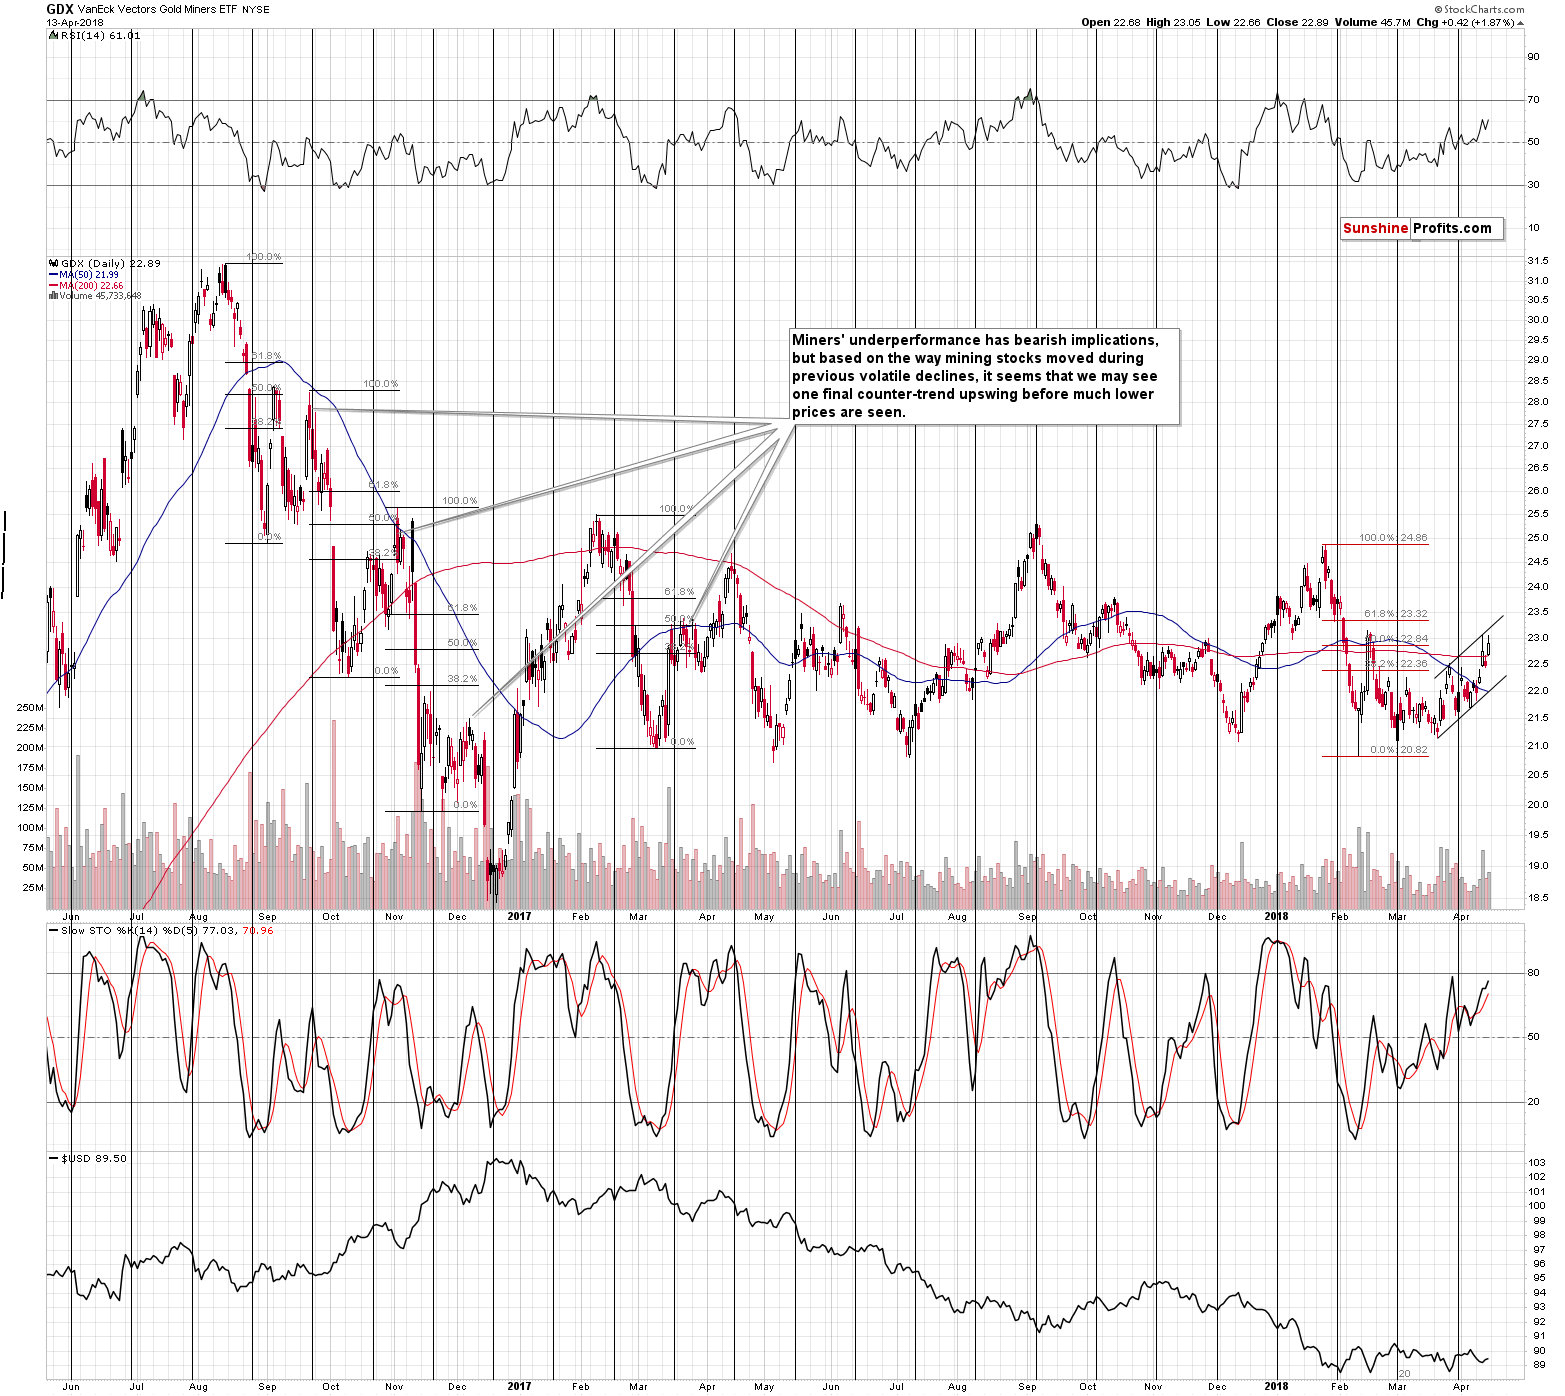
The volume was not as significant as it was during the reversal, but it was still quite significant. It’s not clear if that’s a bullish thing, though. The reason is that on one hand, we saw a daily rally, but on the other hand, the GDX reversed before the end of the session in a rather unclear manner. If it had been a crystal-clear reversal, the implications of the relatively big volume would be bearish. If it was clear that there had been no reversal, the implications would be bullish. Given the lack of clarity regarding the reversal, the implications of sizable volume are currently neutral.
There was no breakout above the zigzag pattern, in which mining stocks very often correct, so this is still a bearish factor.
There was no breakout above the Wednesday’s intraday high. The GDX moved right to it and the HUI Index formed its intraday high slightly below the Wednesday’s high.
From the long-term point of view, we also see that that gold stocks didn’t break above any important level. Consequently, also from this point of view, last week’s rally is not a bullish deviation from a bearish pattern – it’s part of the pattern.
During the 2012 – 2013 decline, there was a corrective upswing, during which gold stocks corrected to about the 38.2% Fibonacci retracement level. We saw exactly the same thing last week. We marked the retracements in blue, so please see for yourself.
The short-term rally was therefore a natural part of the much bigger decline, not it’s end.
Consequently, technically, there was no breakout – mining stocks’ strength relative to gold is the only thing about them that seems bullish. Therefore, that’s the thing we’ll examine particularly thoroughly today.
Mining Stocks’ Strength
In order to get clearer signals, we’ll use both proxies for the sector: GDX and HUI. Let’s start with the former’s ratio to gold.
In Friday’s alert, we wrote the following:
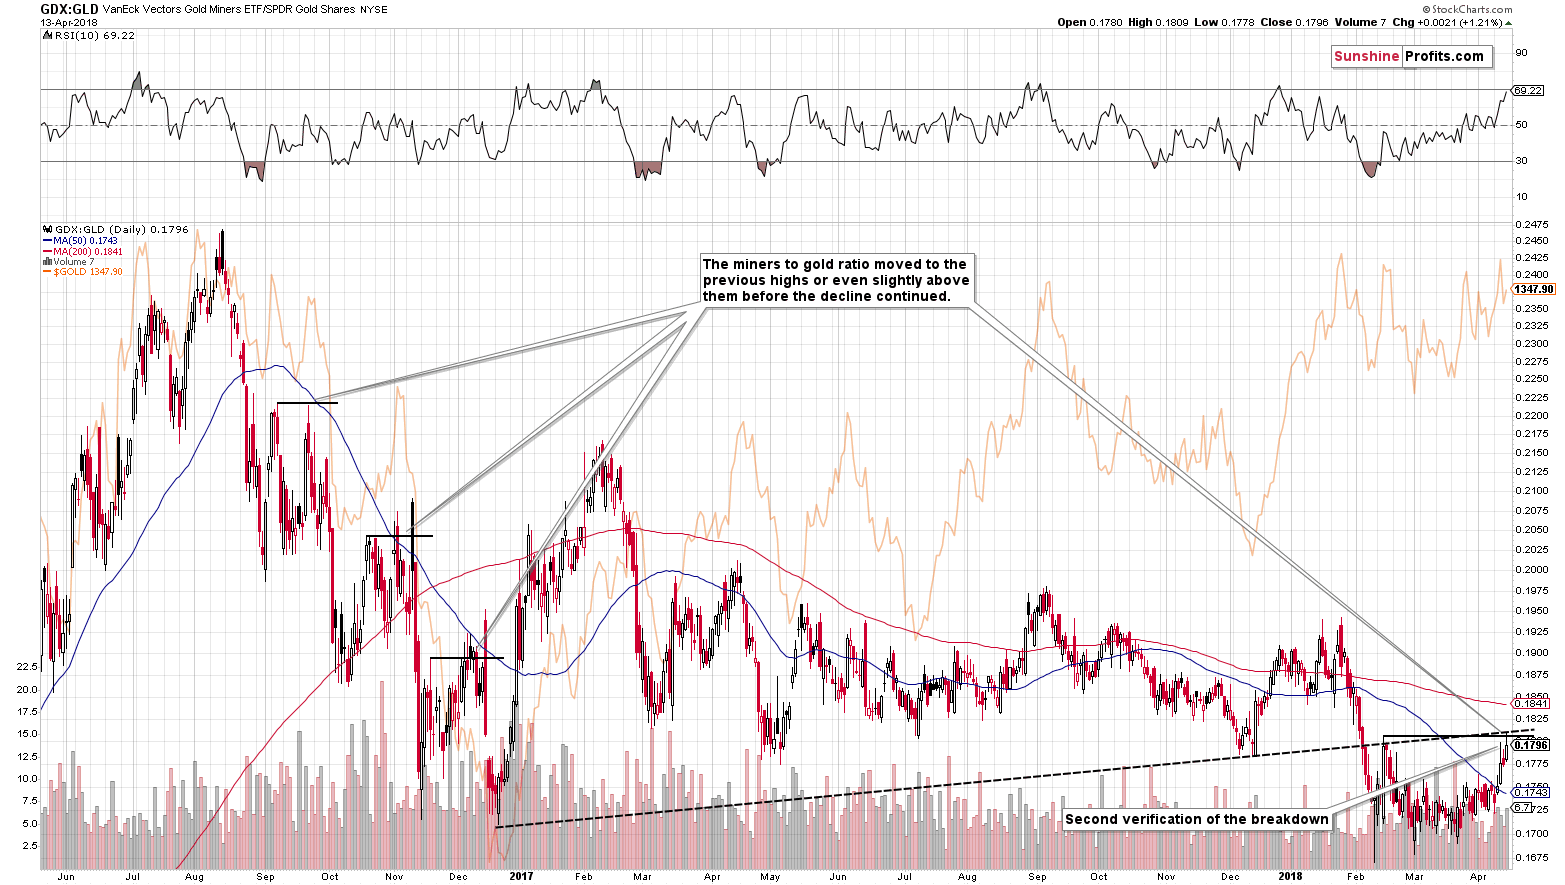
We can say, however, that the outperformance is in agreement with the previous small, local rallies. In fact, even though GDX moved to its February high, the gold stocks to gold ratio didn’t move close to it. So, should we be really concerned about the miners’ strength? Not really – it’s not visible in any other term except for the very short term, and it would take additional confirmations for this signal to become something very important.
Based on Friday’s action, the ratio did move to the mid-February high. But is this a bullish development? As is usually the case, the context provides the key details.
We already wrote multiple times that during the previous big decline, the GDX moved to its previous local high before continuing to move lower. This comment is still visible on the above GDX ETF chart that we featured above. The point is that this kind of performance was not only seen in the GDX – it was also seen in the case of the GDX to gold ratio.
We marked the previous highs and the resistance that it created with short, horizontal black lines. In the first case, the miners reversed right after touching it briefly (just as we saw on Friday) and in the last two cases, miners moved slightly above it only to decline back below it shortly thereafter. That’s what we saw at the beginning of November 2016 and in December. The early November was the time when gold formed a major top and the case in December was followed by a decline in gold.
Moreover, from the purely technical point of view, this month’s upswing in the ratio was simply another verification of the breakdown below the medium-term resistance line based on the 2016 and late-2017 bottoms. The breakdown was not invalidated, so its implications remain bearish.
Therefore, can we say that the implications of Friday’s move in the GDX to gold ratio really have bullish implications? Not at all.
But perhaps the HUI to gold ratio has more bullish implications?
No. It actually has more bearish implications.
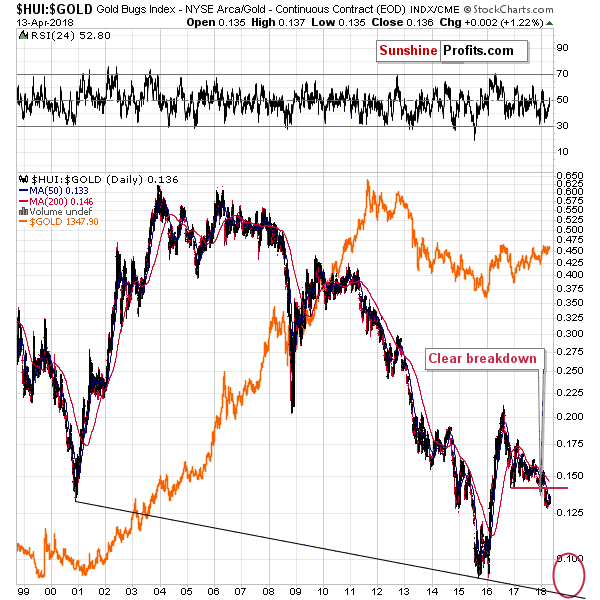
The gold stocks to gold ratio is after a major breakdown below the long-term support and there’s no meaningful support all the way until the ratio reaches its 2015 and 2016 lows.
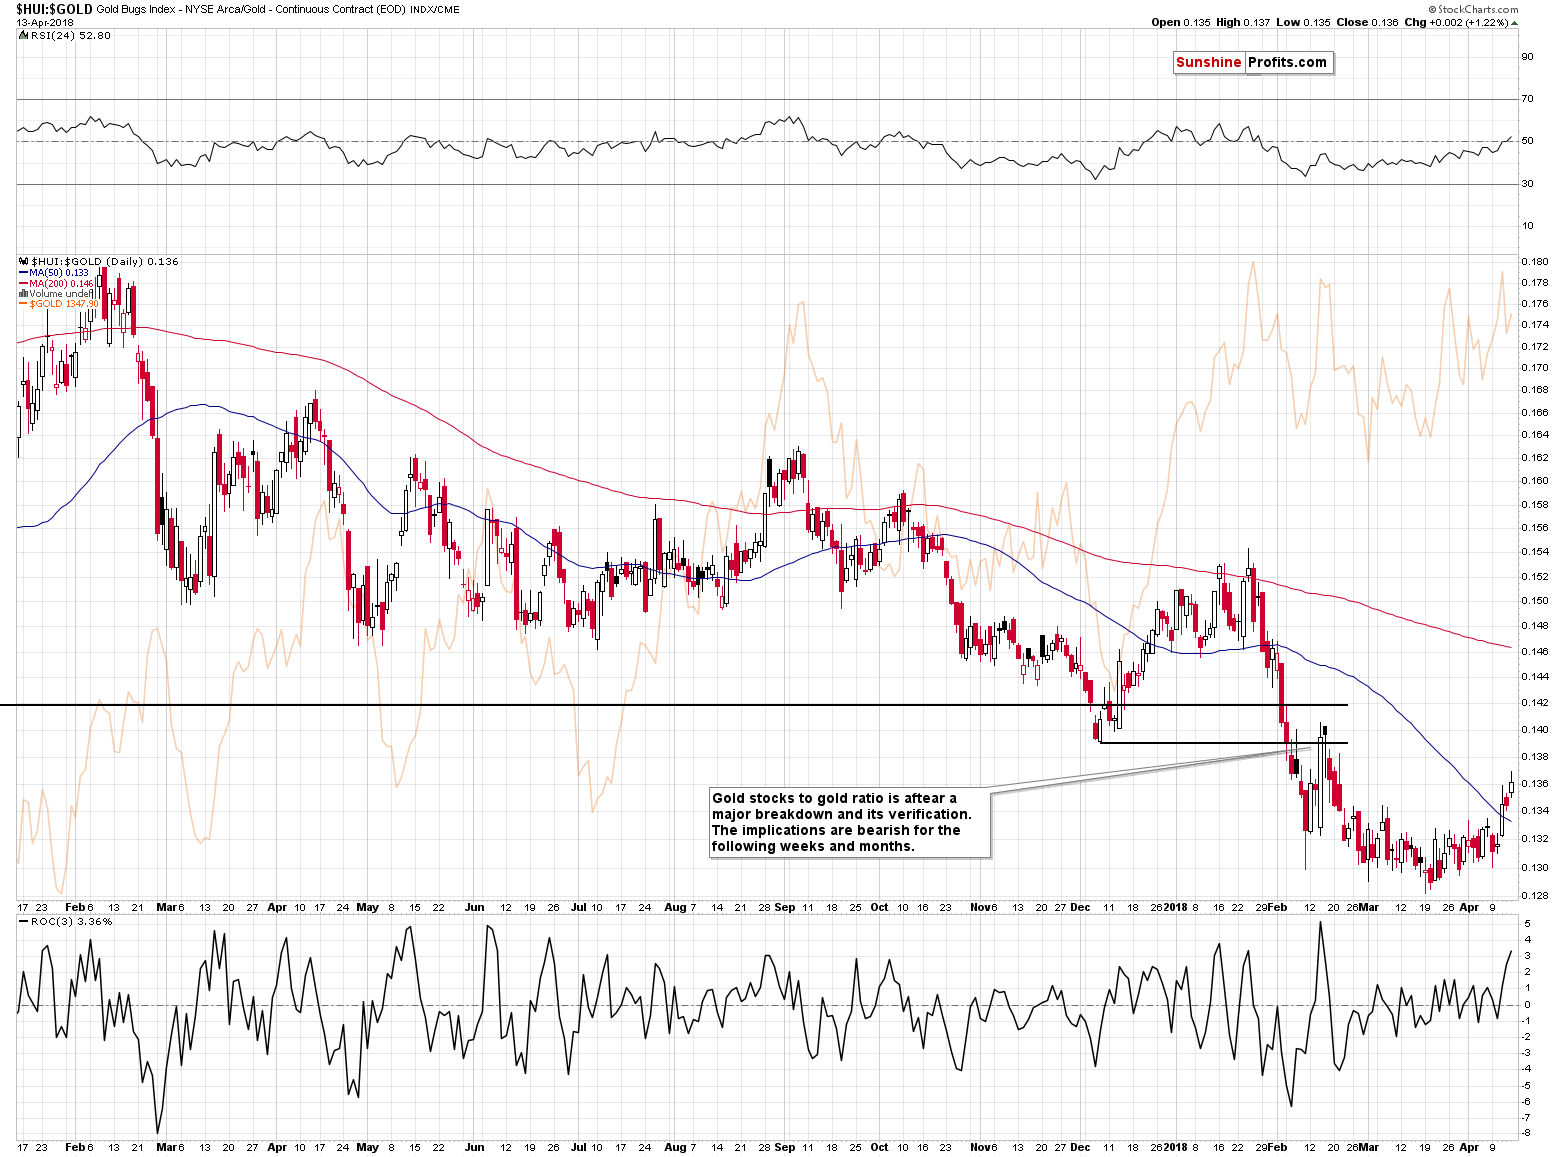
This breakdown was not invalidated and the HUI to gold ratio is actually not even very close to the 2016 low. The recent strength would need to be approximately doubled for this level to be reached. Consequently, nothing really changed in the case of this ratio – the bearish implications remain clearly in place.
Summary
Summing up, the strength in mining stocks was significant only if we consider the short-term price moves only – the bigger picture reversals that it’s nothing to call home about. The recent performance in the ratios between miners and gold is in tune with what we saw in the past during a big decline and since that’s the only seemingly bullish thing that we currently see in the case of the miners, the overall outlook remains bearish. The huge-volume-confirmed reversals that we saw last week seem to be much more profound developments with more important – and bearish – implications.
As always, we will keep you – our subscribers – informed.
To summarize:
Trading capital (supplementary part of the portfolio; our opinion): Full short positions (200% of the full position) in gold, silver and mining stocks are justified from the risk/reward perspective with the following stop-loss orders and initial target price levels:
- Gold: initial target price: $1,218; stop-loss: $1,382; initial target price for the DGLD ETN: $53.98; stop-loss for the DGLD ETN $37.68
- Silver: initial target price: $14.63; stop-loss: $17.33; initial target price for the DSLV ETN: $33.88; stop-loss for the DSLV ETN $21.48
- Mining stocks (price levels for the GDX ETF): initial target price: $19.22; stop-loss: $23.54; initial target price for the DUST ETF: $39.88; stop-loss for the DUST ETF $21.46
In case one wants to bet on junior mining stocks' prices (we do not suggest doing so – we think senior mining stocks are more predictable in the case of short-term trades – if one wants to do it anyway, we provide the details), here are the stop-loss details and initial target prices:
- GDXJ ETF: initial target price: $27.82; stop-loss: $36.14
- JDST ETF: initial target price: $94.88 stop-loss: $41.86
Long-term capital (core part of the portfolio; our opinion): No positions (in other words: cash)
Insurance capital (core part of the portfolio; our opinion): Full position
Important Details for New Subscribers
Whether you already subscribed or not, we encourage you to find out how to make the most of our alerts and read our replies to the most common alert-and-gold-trading-related-questions.
Please note that the in the trading section we describe the situation for the day that the alert is posted. In other words, it we are writing about a speculative position, it means that it is up-to-date on the day it was posted. We are also featuring the initial target prices, so that you can decide whether keeping a position on a given day is something that is in tune with your approach (some moves are too small for medium-term traders and some might appear too big for day-traders).
Plus, you might want to read why our stop-loss orders are usually relatively far from the current price.
Please note that a full position doesn’t mean using all of the capital for a given trade. You will find details on our thoughts on gold portfolio structuring in the Key Insights section on our website.
As a reminder – “initial target price” means exactly that – an “initial” one, it’s not a price level at which we suggest closing positions. If this becomes the case (like it did in the previous trade) we will refer to these levels as levels of exit orders (exactly as we’ve done previously). Stop-loss levels, however, are naturally not “initial”, but something that, in our opinion, might be entered as an order.
Since it is impossible to synchronize target prices and stop-loss levels for all the ETFs and ETNs with the main markets that we provide these levels for (gold, silver and mining stocks – the GDX ETF), the stop-loss levels and target prices for other ETNs and ETF (among other: UGLD, DGLD, USLV, DSLV, NUGT, DUST, JNUG, JDST) are provided as supplementary, and not as “final”. This means that if a stop-loss or a target level is reached for any of the “additional instruments” (DGLD for instance), but not for the “main instrument” (gold in this case), we will view positions in both gold and DGLD as still open and the stop-loss for DGLD would have to be moved lower. On the other hand, if gold moves to a stop-loss level but DGLD doesn’t, then we will view both positions (in gold and DGLD) as closed. In other words, since it’s not possible to be 100% certain that each related instrument moves to a given level when the underlying instrument does, we can’t provide levels that would be binding. The levels that we do provide are our best estimate of the levels that will correspond to the levels in the underlying assets, but it will be the underlying assets that one will need to focus on regarding the signs pointing to closing a given position or keeping it open. We might adjust the levels in the “additional instruments” without adjusting the levels in the “main instruments”, which will simply mean that we have improved our estimation of these levels, not that we changed our outlook on the markets. We are already working on a tool that would update these levels on a daily basis for the most popular ETFs, ETNs and individual mining stocks.
Our preferred ways to invest in and to trade gold along with the reasoning can be found in the how to buy gold section. Additionally, our preferred ETFs and ETNs can be found in our Gold & Silver ETF Ranking.
As a reminder, Gold & Silver Trading Alerts are posted before or on each trading day (we usually post them before the opening bell, but we don't promise doing that each day). If there's anything urgent, we will send you an additional small alert before posting the main one.
=====
Latest Free Trading Alerts:
A fresh 2018 high, an unbroken resistance and negative divergence. What does this interesting mix tell us about oil bull’s strength and further increases?
Crude Oil- As Bullish as it Seems?
The stock market failed to break above its short-term consolidation on Friday, as investors feared that the Syrian conflict may further escalate. They were right because there was a U.S., U.K. and France air strike on Saturday. However, expectations before the opening of today's trading session are positive and we may see another attempt at breaking higher. Will it be successful?
Stocks: Many Attempts and Still No Breakout
=====
Hand-picked precious-metals-related links:
PRECIOUS-Gold steadies as Syria strike fears fade
Safe haven assets slide on hope Syria mission is accomplished
=====
In other news:
Dollar dips as markets assess Syria risk, losses limited
U.S. Stock Futures Rally, Bonds Fall After Syria: Markets Wrap
Wall Street eyes earnings stabilizer after FAANG stocks wobble
A Fund That Beats 98% of Its Peers Is Shorting the Dollar
Solid earnings season won't be enough to avert another correction, economist Robert Shiller says
Where Does the ECB Go From Here?
=====
Thank you.
Sincerely,
Przemyslaw Radomski, CFA
Founder, Editor-in-chief, Gold & Silver Fund Manager
Gold & Silver Trading Alerts
Forex Trading Alerts
Oil Investment Updates
Oil Trading Alerts

