

Briefly: in our opinion, full (200% of the regular size of the position) speculative short positions in gold, silver and mining stocks are justified from the risk/reward perspective at the moment of publishing this alert.
The HUI Index just broke below the previous 2018 low and it moved below the 61.8% Fibonacci retracement level based on the entire 2016 rally. There had previously been four attempts to break below this level and they all failed and were followed by rallies. The late-2016 invalidation even triggered a move to over 220. Should one prepare for a rally from here?
This may seem surprising, as history tends to repeat itself, but no. The HUI Index broke below the 2018 lows in both intraday and closing price terms even though gold and silver didn’t close below their Friday’s closing prices. And we only saw a small rally in the USD Index. This was not a favorable environment for gold miners to make any decisive move, and yet they did. That’s a profound sign of weakness and something that makes us think that the breakdown will be successful this time.
Let’s take a closer look (chart courtesy of http://stockcharts.com).
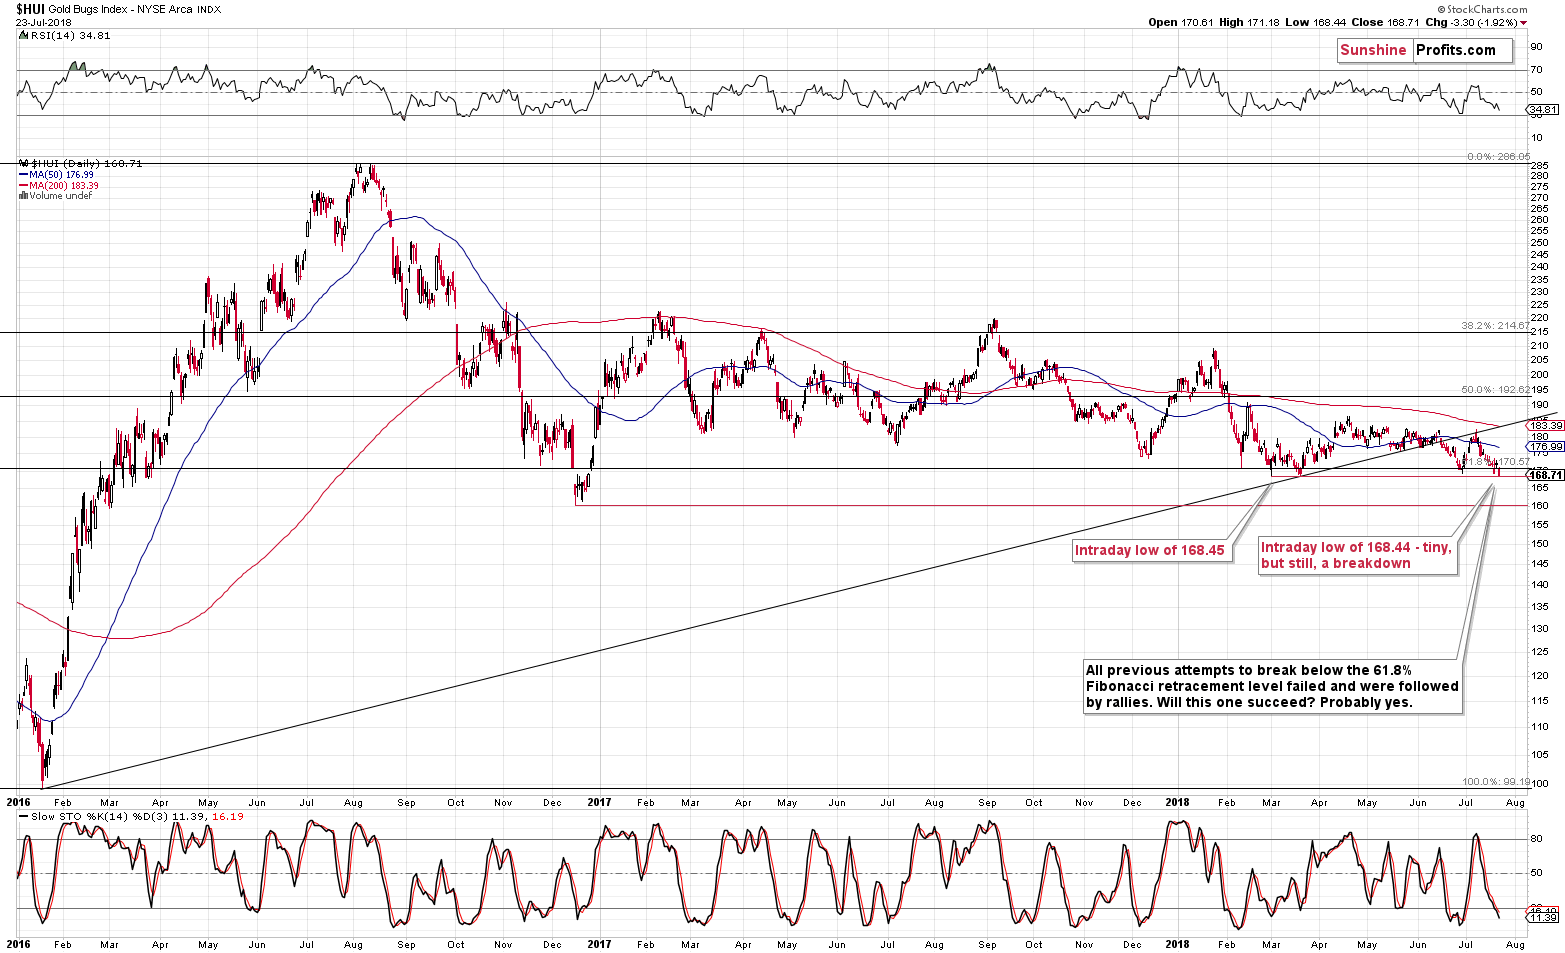
The breakdown below the 2018 low sounds more important, but in reality, the move below the 61.8% Fibonacci retracement has greater implications. This level has stopped the declines four times already and that was also the case on Friday. But, instead of rallying higher after the breakdown was invalidated, gold miners declined once again and moved below the previous low. That had never happened previously, and it already shows that this time really is different.
Moreover, yesterday’s volume was the second highest that we saw this month, which is another factor that confirms the bearish case.
There is a bullish silver lining regarding the decline and that is the proximity to the next cyclical turning point (this Friday). It means that we can see a corrective upswing after a few days of additional declines, but it’s too early to say that this will indeed be the case.
At this time the December 2016 low seems like a reasonable short-term target for the HUI Index (160), but we’ll be able to tell more about the likelihood of a bounce from this level once we move closer to it.
For now, let’s further discuss the breakdowns that we just saw. The thing that makes the HUI breakdowns really special is how little help it took from the other markets for them to be seen. Let’s take a look at the metals.
Rally in Gold and Silver? What Rally?
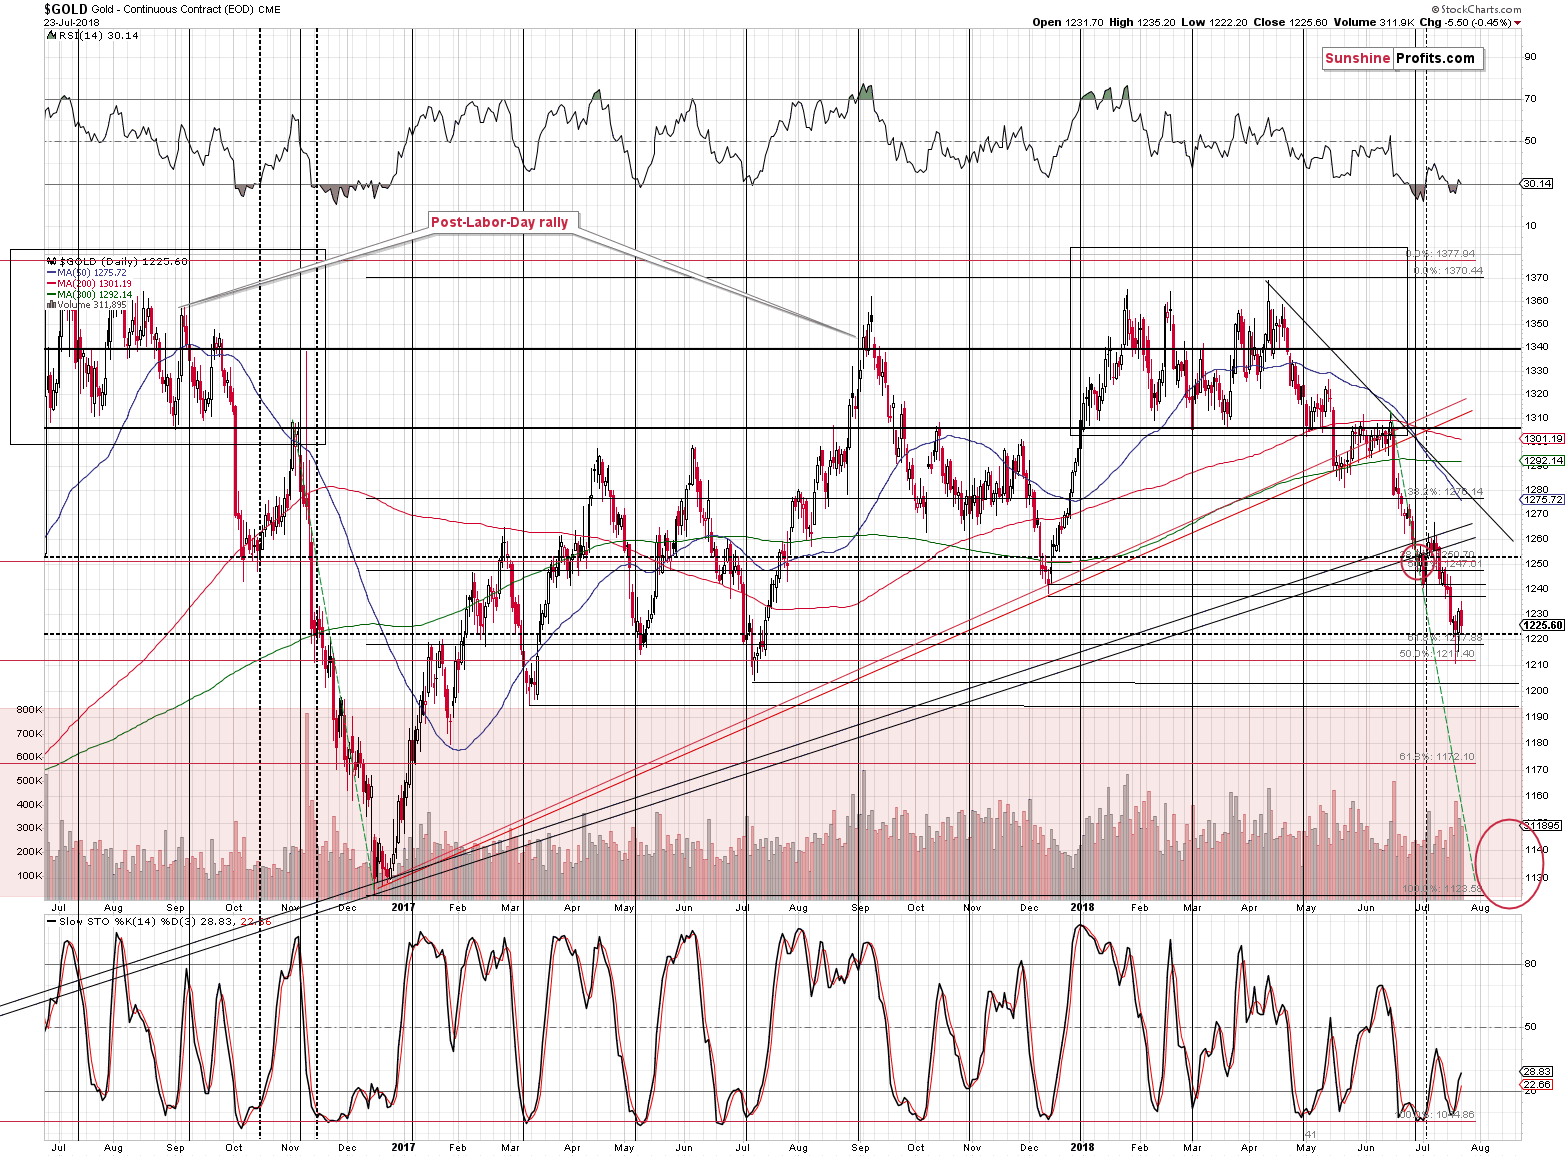
The rally that could have taken place based on what happened in the Japanese yen seems to be already over. The move was so small that many investors probably never even noticed that there was a correction at all.
Gold moved a bit higher on an intraday basis, but erased all these gains before the session was over. It closed only a few dollars above the Friday’s close.
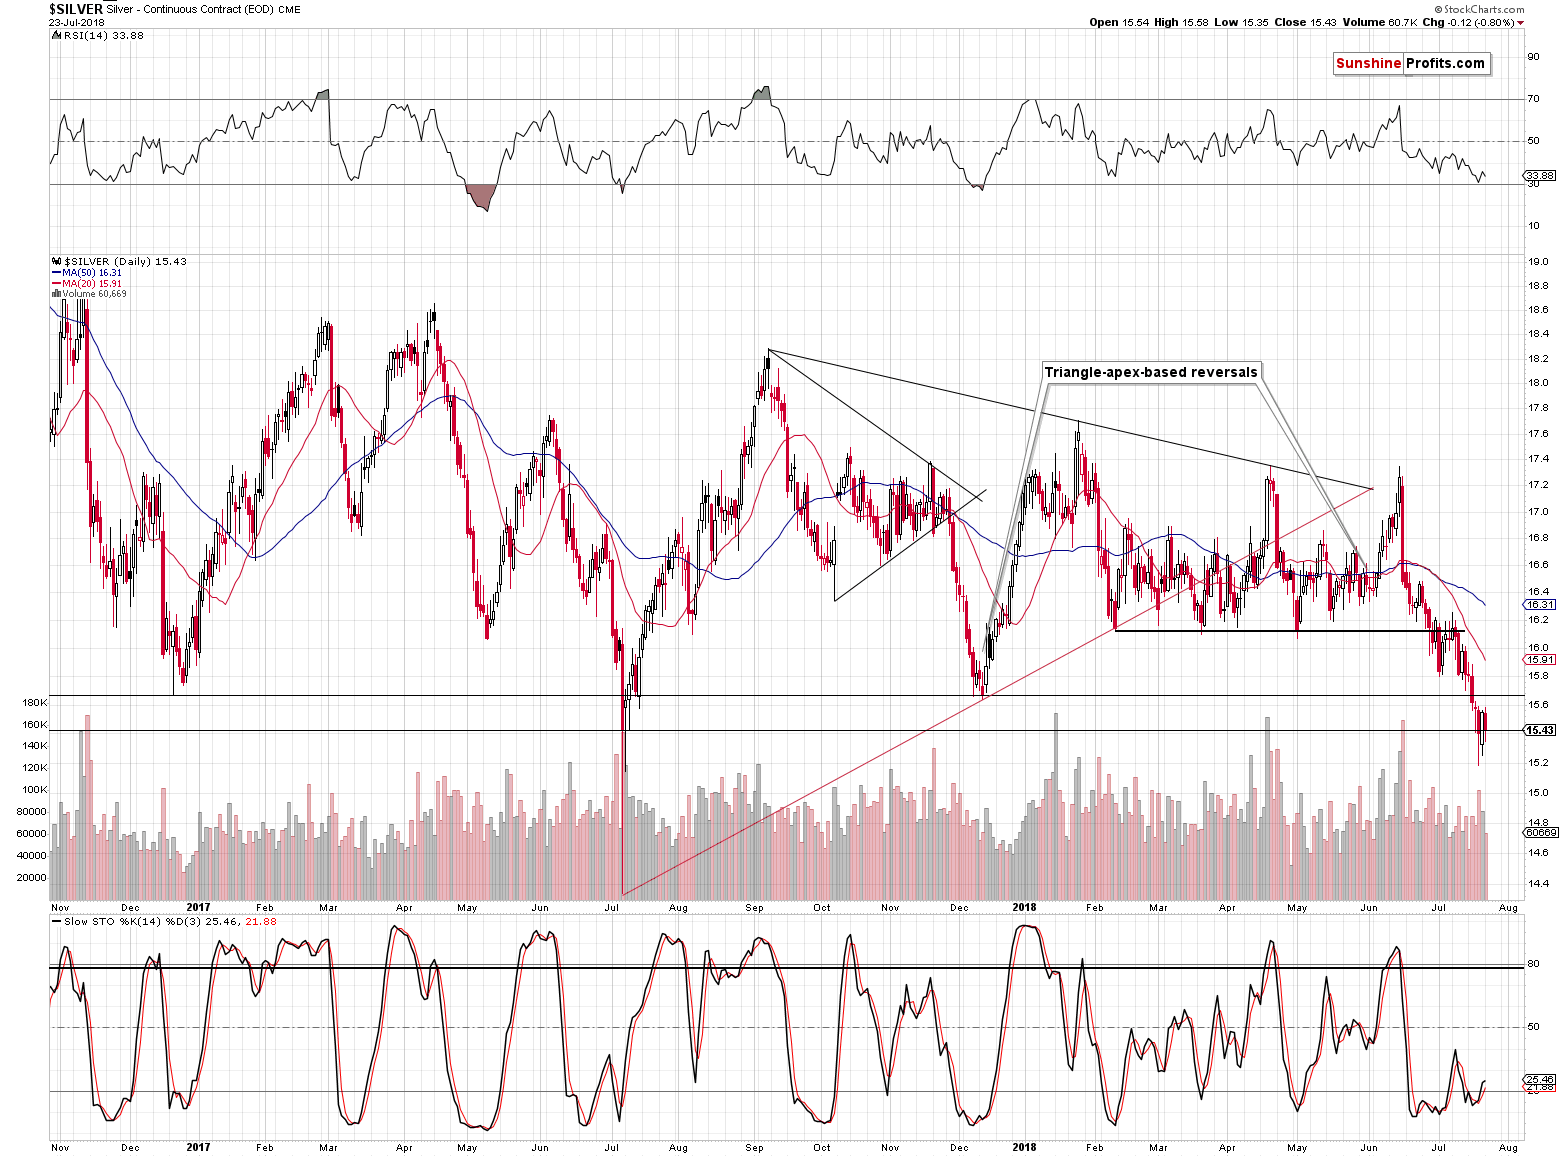
Silver closed right at its July 2017 low (in terms of the closing prices). There was no new breakdown, but the situation is already more bearish than it was in 2017, because back then, the initial invalidation was followed by a rally. This time, we have another attempt to move lower. At the moment of writing these words, silver is trading at $15.38, so it’s once again below the 2017 low (15.43 in terms of the closing prices).
The action in both metals was bearish, but since they didn’t move below the Friday’s closing prices, mining stocks were unlikely to move below them as well. But they did, and it serves as a strong bearish sign.
USD’s Help
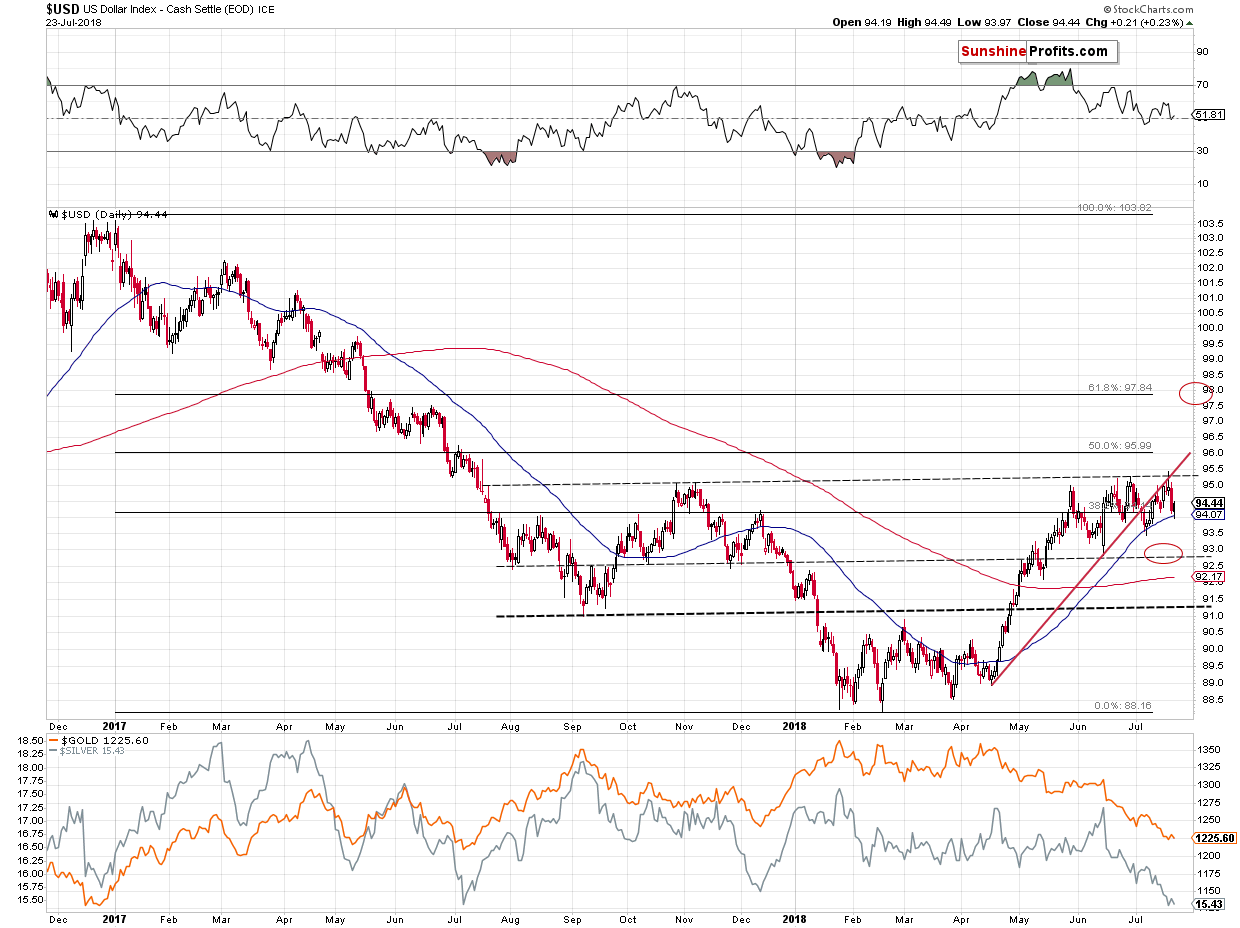
Another remarkable detail was how little help gold, silver and mining stocks’ decline got from the currency sector. The USD Index closed higher by only 0.21, which is about 1/3 of what it had declined in the previous two days. That was enough for gold and silver to almost move back to Friday’s closing prices and it was enough for gold miners to break to new lows. The implications of this lack of relative strength are bearish.
Summary
Summing up, the outlook for the precious metals is extremely bearish for the following days, weeks and months. Yesterday’s session provided us with three important bearish signs. The first is the breakdown in gold stocks, the second is the relative weakness in them and the third is the weakness of the entire PM sector relative to the currency moves.
This is a very bearish combination. In fact, it is more bearish than it would be if PMs had declined simply due to a rising USD. What we saw shows weakness and willingness to decline much further. When the USD Index finally soars, and the Japanese yen finally plunges, the precious metals and mining stocks are likely to slide in a very profound manner.
In other words, the – already sizable – profits on our short positions are likely to become much bigger before the trade is over.
As always, we will keep you – our subscribers – informed.
To summarize:
Trading capital (supplementary part of the portfolio; our opinion): Full short positions (200% of the full position) in gold, silver and mining stocks are justified from the risk/reward perspective with the following stop-loss orders and initial target price levels:
- Gold: initial target price: $1,142; stop-loss: $1,272; initial target price for the DGLD ETN: $63.96; stop-loss for the DGLD ETN $46.38
- Silver: initial target price: $14.42; stop-loss: $16.46; initial target price for the DSLV ETN: $32.97; stop-loss for the DSLV ETN $24.07
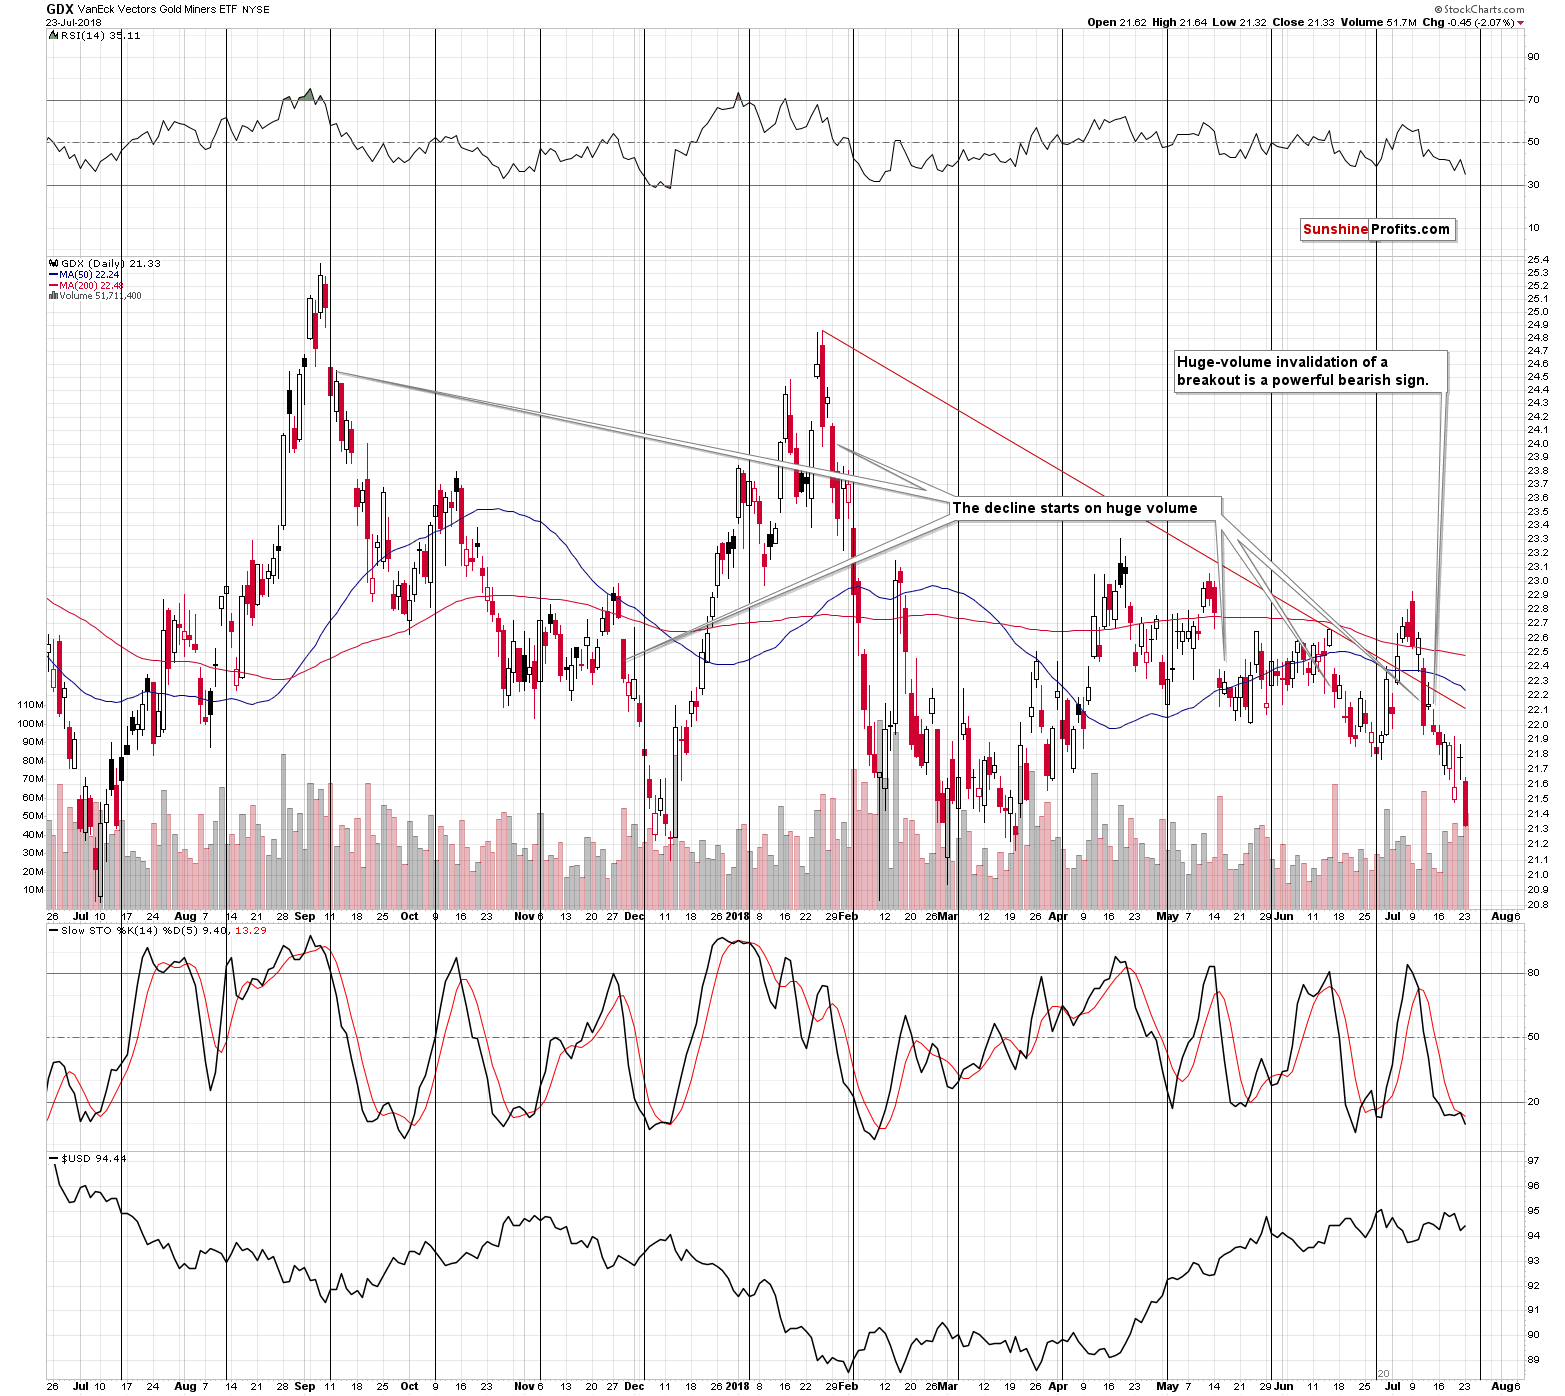
- Mining stocks (price levels for the GDX ETF): initial target price: $19.12; stop-loss: $23.64; initial target price for the DUST ETF: $37.97; stop-loss for the DUST ETF $20.87
In case one wants to bet on junior mining stocks’ prices (we do not suggest doing so – we think senior mining stocks are more predictable in the case of short-term trades – if one wants to do it anyway, we provide the details), here are the stop-loss details and initial target prices:
- GDXJ ETF: initial target price: $28.10; stop-loss: $34.82
- JDST ETF: initial target price: $74.83 stop-loss: $42.78
Long-term capital (core part of the portfolio; our opinion): No positions (in other words: cash)
Insurance capital (core part of the portfolio; our opinion): Full position
Important Details for New Subscribers
Whether you already subscribed or not, we encourage you to find out how to make the most of our alerts and read our replies to the most common alert-and-gold-trading-related-questions.
Please note that the in the trading section we describe the situation for the day that the alert is posted. In other words, it we are writing about a speculative position, it means that it is up-to-date on the day it was posted. We are also featuring the initial target prices, so that you can decide whether keeping a position on a given day is something that is in tune with your approach (some moves are too small for medium-term traders and some might appear too big for day-traders).
Plus, you might want to read why our stop-loss orders are usually relatively far from the current price.
Please note that a full position doesn’t mean using all of the capital for a given trade. You will find details on our thoughts on gold portfolio structuring in the Key Insights section on our website.
As a reminder – “initial target price” means exactly that – an “initial” one, it’s not a price level at which we suggest closing positions. If this becomes the case (like it did in the previous trade) we will refer to these levels as levels of exit orders (exactly as we’ve done previously). Stop-loss levels, however, are naturally not “initial”, but something that, in our opinion, might be entered as an order.
Since it is impossible to synchronize target prices and stop-loss levels for all the ETFs and ETNs with the main markets that we provide these levels for (gold, silver and mining stocks – the GDX ETF), the stop-loss levels and target prices for other ETNs and ETF (among other: UGLD, DGLD, USLV, DSLV, NUGT, DUST, JNUG, JDST) are provided as supplementary, and not as “final”. This means that if a stop-loss or a target level is reached for any of the “additional instruments” (DGLD for instance), but not for the “main instrument” (gold in this case), we will view positions in both gold and DGLD as still open and the stop-loss for DGLD would have to be moved lower. On the other hand, if gold moves to a stop-loss level but DGLD doesn’t, then we will view both positions (in gold and DGLD) as closed. In other words, since it’s not possible to be 100% certain that each related instrument moves to a given level when the underlying instrument does, we can’t provide levels that would be binding. The levels that we do provide are our best estimate of the levels that will correspond to the levels in the underlying assets, but it will be the underlying assets that one will need to focus on regarding the signs pointing to closing a given position or keeping it open. We might adjust the levels in the “additional instruments” without adjusting the levels in the “main instruments”, which will simply mean that we have improved our estimation of these levels, not that we changed our outlook on the markets. We are already working on a tool that would update these levels on a daily basis for the most popular ETFs, ETNs and individual mining stocks.
Our preferred ways to invest in and to trade gold along with the reasoning can be found in the how to buy gold section. Additionally, our preferred ETFs and ETNs can be found in our Gold & Silver ETF Ranking.
As a reminder, Gold & Silver Trading Alerts are posted before or on each trading day (we usually post them before the opening bell, but we don't promise doing that each day). If there's anything urgent, we will send you an additional small alert before posting the main one.
=====
Latest Free Trading Alerts:
The yellow metal lost its safe-haven status. This is what the analysts are saying as gold prices have failed to increase amid the trade wars with China. Are they right? Why haven’t the trade wars supported the price of gold?
Why Trade Wars Don’t Matter to the Gold Market
=====
Hand-picked precious-metals-related links:
PRECIOUS-Gold inches down on firmer dollar, muted response to US-Iran tension
Analysts slash gold price forecasts after second quarter plunge - Reuters poll
AngloGold Says There's No Escaping Demise of South African Gold
=====
In other news:
Trump’s Tweets Aren’t Expected to Hold Down the Dollar
China bond yields, stocks rise as Beijing signals policy shift
Czech central bank's new forecast to show jump in rate path
Oil steady as U.S.-Iran row balances trade worries
Iran says will respond in kind if U.S. tries to block oil exports
=====
Thank you.
Sincerely,
Przemyslaw Radomski, CFA
Founder, Editor-in-chief, Gold & Silver Fund Manager
Gold & Silver Trading Alerts
Forex Trading Alerts
Oil Investment Updates
Oil Trading Alerts

