

Briefly: In our opinion, full (200% of the regular size of the position) speculative short positions in gold, silver and mining stocks are justified from the risk/reward perspective at the moment of publishing this alert.
A new day, a new upswing and new important signals. Gold moved even closer to its previous highs, while silver and mining stocks moved higher as well. The HUI Index even managed to close at a new March high. What can we infer from the latter? Did the miners’ strength just invalidate the previous bearish signals?
In short, no. There was no real strength in miners, even though it might have appeared to be the case from the day-to-date point of view. Gold is close to its previous years’ highs and mining stocks are still very close to their recent lows. The HUI Index didn’t even manage to close above the 180 level despite a substantial rally in main stock indices.
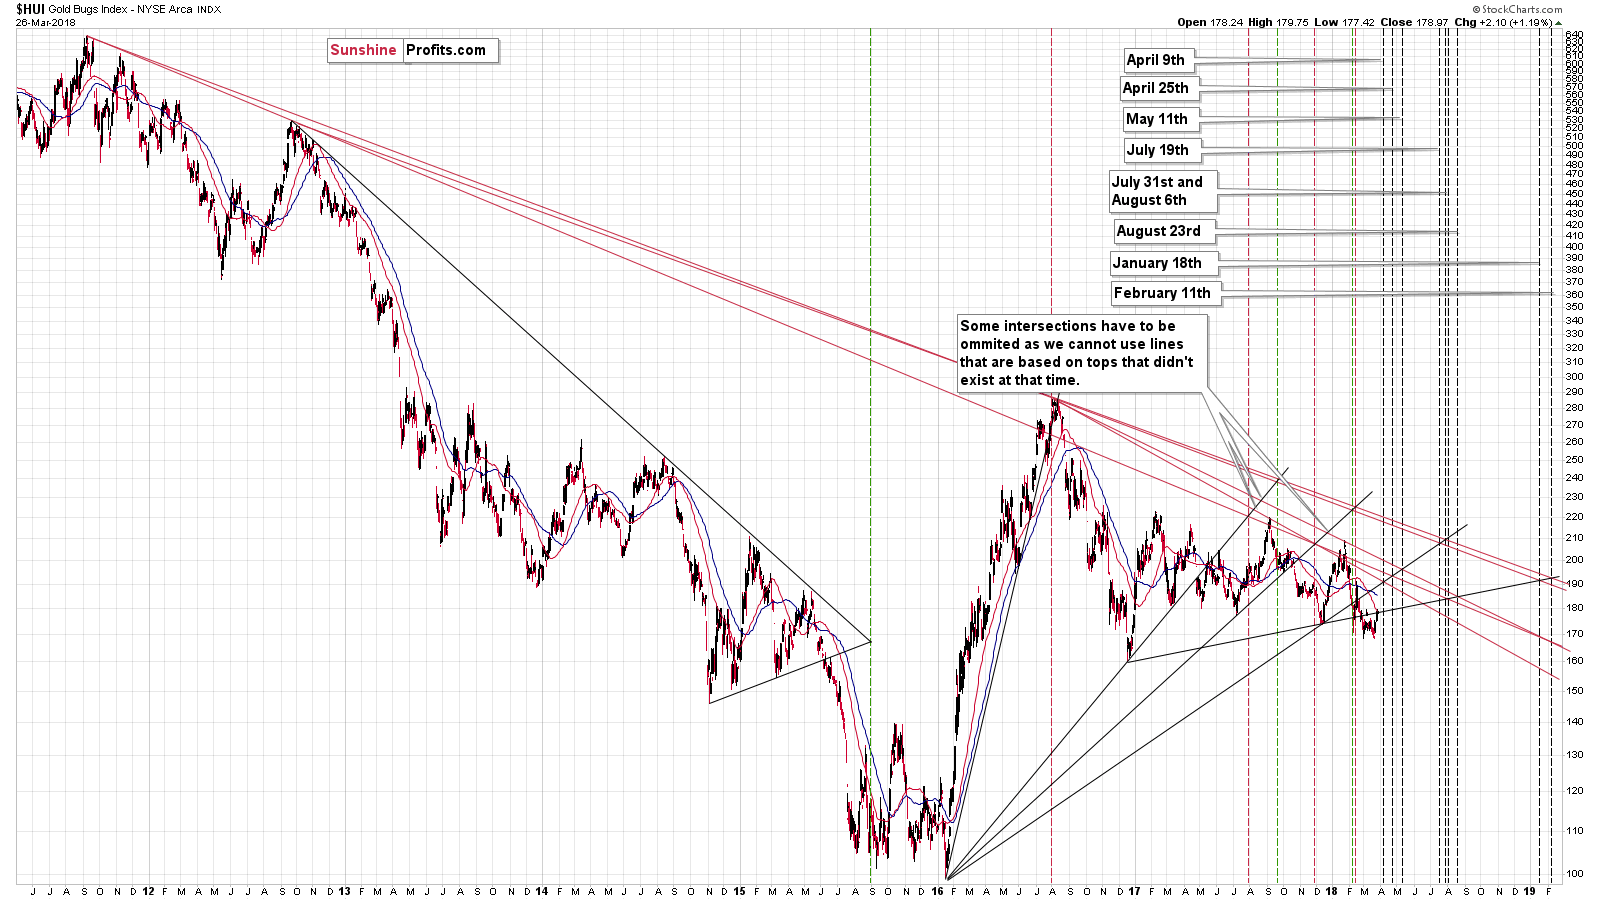
Let’s take a closer look at what happened in gold stocks (chart courtesy of http://stockcharts.com).
Gold Stocks’ “Strength”
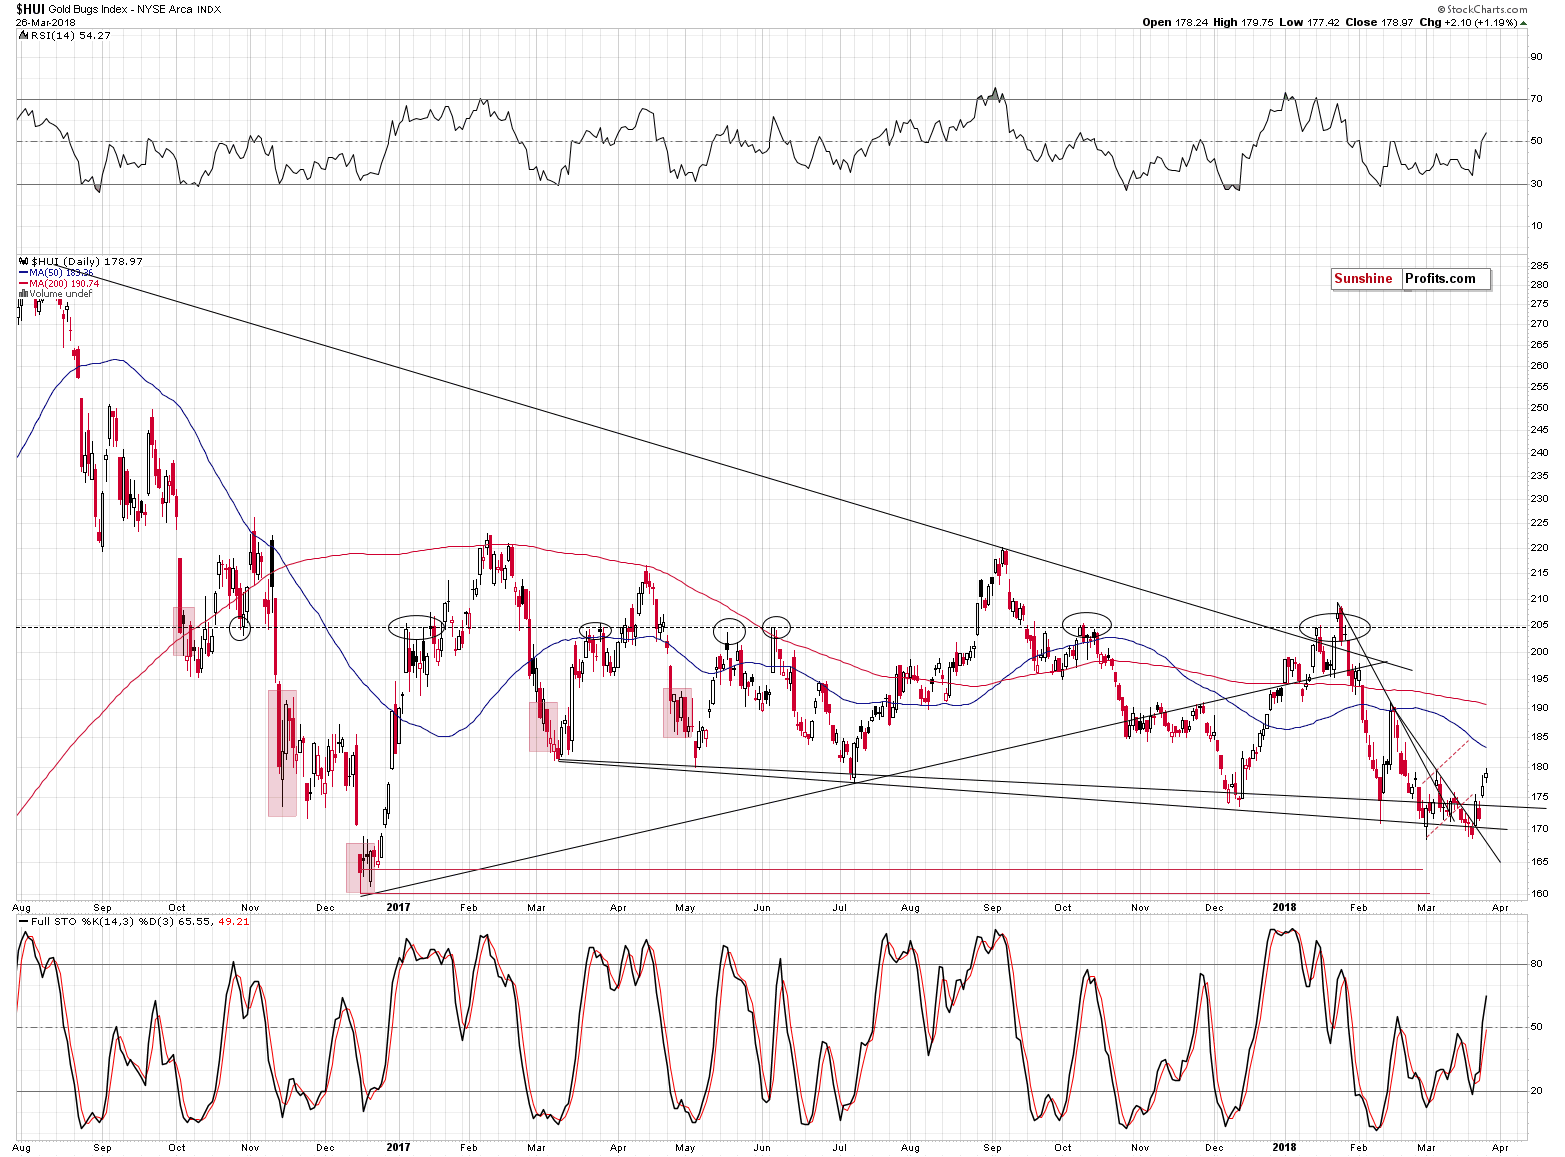
In yesterday’s alert, we explained why the general stock market was likely not the key reason behind the mining stocks’ weakness in the recent weeks and days. Yesterday’s session proved it. If it had been the case that mining stocks were really strong, but suppressed by the main stock indices, they would have soared back with a vengeance yesterday in light of a powerful almost 3% rally in the S&P 500 Index. Instead the HUI Index moved higher by a mere 2.10 index points (a bit more than 1%). Mining stocks, therefore, continue to show weakness and the implications continue to be very bearish for the following weeks.
Gold’s Rally and Price Patterns
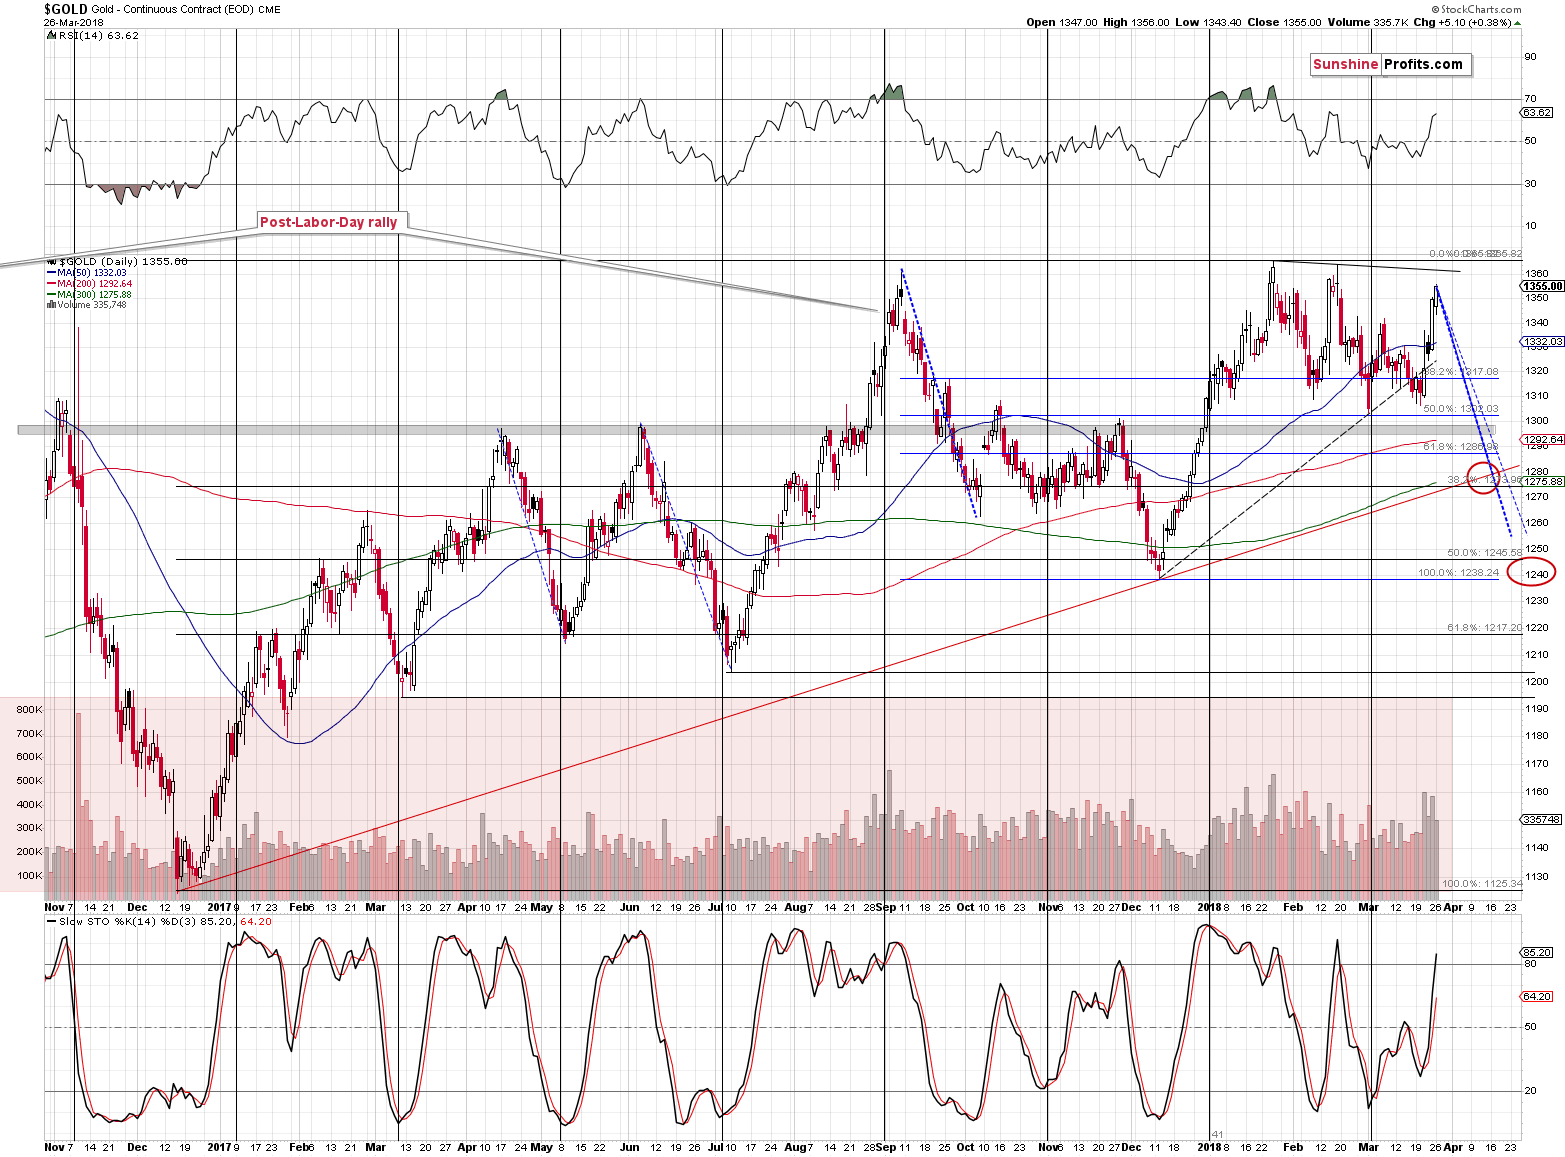
The outlook for gold seemed to change a bit based on the upswing that we saw yesterday, but in light of today’s pre-market action, it really didn’t.
At the moment of writing these words, the price of gold is below the level at which it was trading 24 hours before, so practically everything that we wrote about gold in yesterday’s alert remains up-to-date:
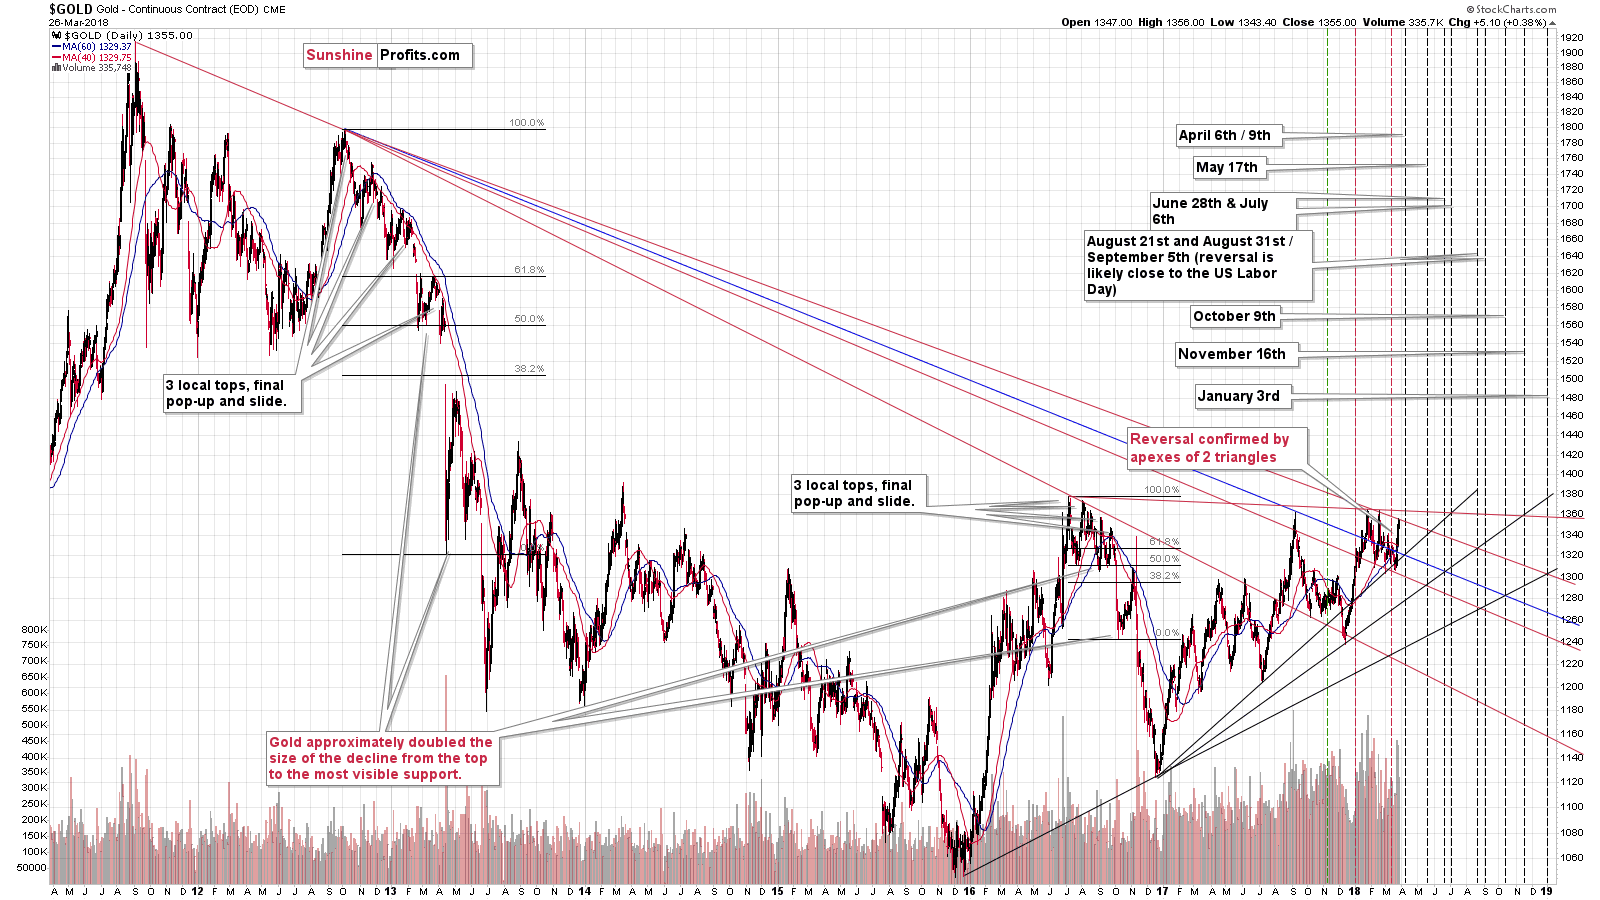
We previously had a situation in which gold was likely to decline and probably bottom before the end of the month. We also described a triple-top and an extra upswing pattern and we discussed how it was similar to what we had seen in the past.
Did any of the above become entirely invalidated based on last week’s upswing?
No. As far as the triple-top formation is concerned, it seems that the current top (the one that’s likely forming) is the third one and the early-March top was not a part of the formation at all. The analogy remains intact, although in a slightly different shape.
The rally didn’t change the apex-based turning points and it didn’t change the fact that the shapes of the declines are often similar. The only thing that changed is the starting point of the decline. Interestingly, if the price of gold declines as it used to decline in the past – in approximately the same way – then we can expect it to reach the rising red support line in the first half of April. That’s in perfect tune with the apex-based turning point. Based on the latter, we expect the next turnaround to be close to April 9th, which is more or less in tune with the shape of the decline.
Consequently, while the situation is no longer likely to develop in tune with earlier expectations, the price level that we described previously is still likely to be reached – only a bit later. Both mentioned techniques that we described earlier remain up-to-date – their implications are simply adjusted based on the newest information.
Silver’s Bearish Confirmation
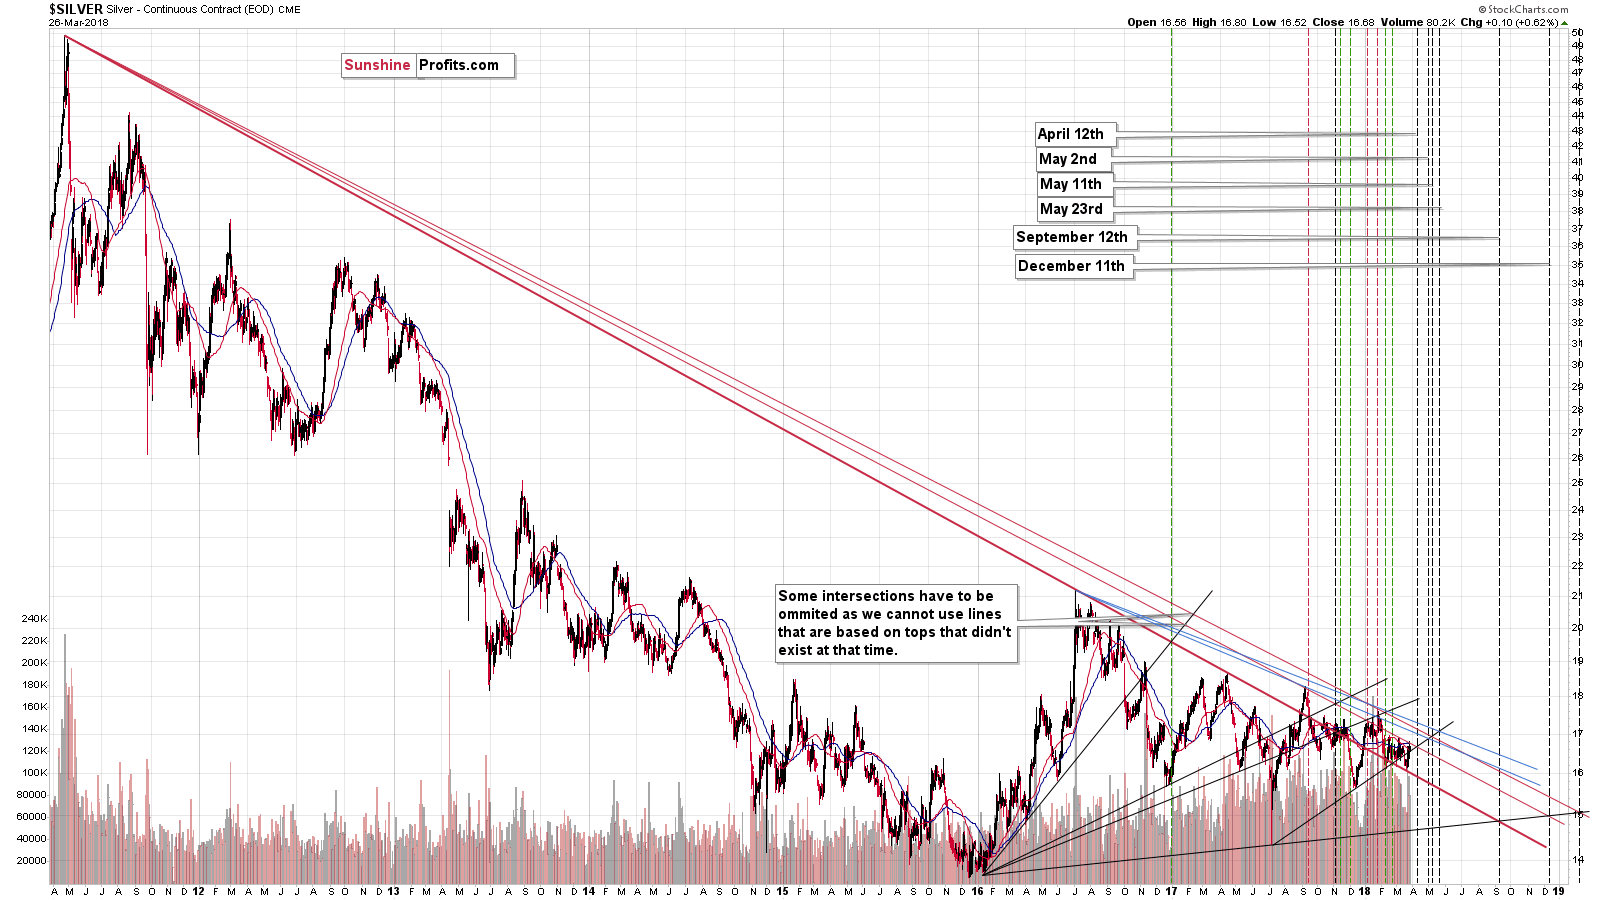
In the case of silver, however, we see more changes, but that doesn’t mean that the implications changed.
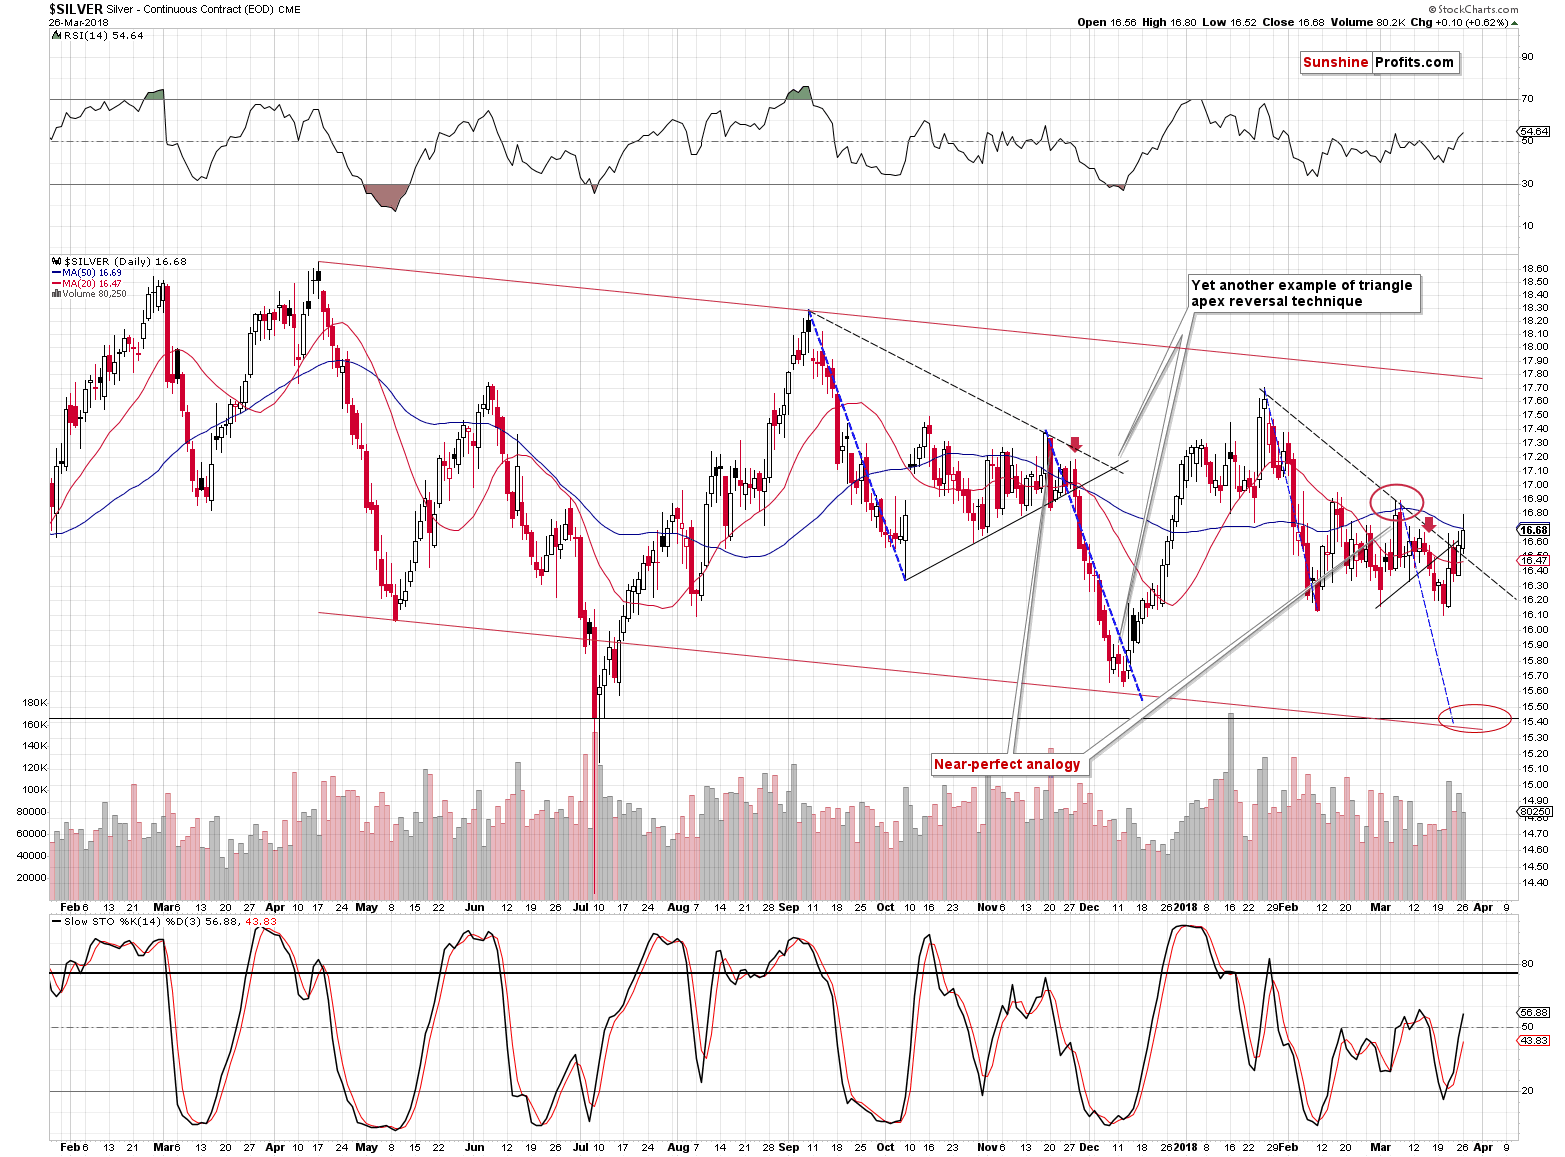
The white metal outperformed gold on a very short-term basis, which is a bearish sign for the short term. Those, who have been following our analyses, experienced the usefulness of the silver signal many times. If you are new to our alerts, the area marked with the red ellipse is the previous case of silver’s quick outperformance. It was also the local top and that’s not a coincidence. Interestingly, that top formed when silver temporarily moved above its 50-day moving average. We saw both factors: the move above the 50-DMA and intraday outperformance during yesterday’s session. So, if there are any implications of yesterday’s session (after all, silver closed only $0.10 higher), then they are bearish.
In yesterday’s alert we also discussed the CoT numbers and we used the Large Speculators as the proxy for the report. We have received requests to also comment on other parts of the report, and we’ll discuss this issue in one of the upcoming analyses (most likely sometime in April as we have a lot of family-related obligations before and during the Easter weekend and we don’t want to provide you with anything else than a thorough, meticulously researched analysis, and the latter requires a lot of time).
Reversal Alert
The next triple apex-based reversal date is looming, so let’s check what kind of reversal is likely to be seen in the first half of April.
Unfortunately, the above charts don’t provide a clear answer. Based on them, it seems that metals and miners have room for both a rally, and a decline. Both would fit before the reversal to make the latter something clear. If one of the scenarios would make much more sense, then it might impact the short-term outlook.
For instance, if we were just a few days before the reversal, then it would be likely that there would be no major change in the trend in the next few days and that it would take place close to the reversal date. We are not in this kind of situation.
The above, however, can still tell us something.
Just like the long-term resistance on the gold chart shows that the room for the rally is very limited in terms of price, the looming reversal date suggests the same thing for the time factor.
Even if gold continues to move sideways or slightly higher, it would be unlikely to keep this kind of performance for long – it would be likely to reverse close to April 9th.
Interestingly, this reversal date is confirmed by a few simultaneous reversal projections in the case of the crude oil (we discuss details in today’s crude oil analysis). Since market reversals are often connected, the above adds credibility to the already very credible triple (based on triangles in gold, silver, and gold stocks) reversal.
Summary
Summing up, gold moved higher on increased geopolitical tensions (possible trade war between the U.S. and China), but it doesn’t seem that it changed the current medium-term trend, which remains down. The extreme underperformance of mining stocks continues despite yesterday’s move higher, which clearly suggests that the main trend has not changed. The potential size of and time for the upswing seem to be rather limited and in light of yesterday’s intraday outperformance of silver, the top for this rally could already be in.
As always, we will keep you – our subscribers – informed.
To summarize:
Trading capital (supplementary part of the portfolio; our opinion): Full short positions (200% of the full position) in gold, silver and mining stocks are justified from the risk/reward perspective with the following stop-loss orders and initial target price levels:
- Gold: initial target price: $1,218; stop-loss: $1,382; initial target price for the DGLD ETN: $53.98; stop-loss for the DGLD ETN $37.68
- Silver: initial target price: $14.63; stop-loss: $17.33; initial target price for the DSLV ETN: $33.88; stop-loss for the DSLV ETN $21.48
- Mining stocks (price levels for the GDX ETF): initial target price: $19.22; stop-loss: $23.54; initial target price for the DUST ETF: $39.88; stop-loss for the DUST ETF $21.46
In case one wants to bet on junior mining stocks' prices (we do not suggest doing so – we think senior mining stocks are more predictable in the case of short-term trades – if one wants to do it anyway, we provide the details), here are the stop-loss details and initial target prices:
- GDXJ ETF: initial target price: $27.82; stop-loss: $36.14
- JDST ETF: initial target price: $94.88 stop-loss: $41.86
Long-term capital (core part of the portfolio; our opinion): No positions (in other words: cash)
Insurance capital (core part of the portfolio; our opinion): Full position
Important Details for New Subscribers
Whether you already subscribed or not, we encourage you to find out how to make the most of our alerts and read our replies to the most common alert-and-gold-trading-related-questions.
Please note that the in the trading section we describe the situation for the day that the alert is posted. In other words, it we are writing about a speculative position, it means that it is up-to-date on the day it was posted. We are also featuring the initial target prices, so that you can decide whether keeping a position on a given day is something that is in tune with your approach (some moves are too small for medium-term traders and some might appear too big for day-traders).
Plus, you might want to read why our stop-loss orders are usually relatively far from the current price.
Please note that a full position doesn’t mean using all of the capital for a given trade. You will find details on our thoughts on gold portfolio structuring in the Key Insights section on our website.
As a reminder – “initial target price” means exactly that – an “initial” one, it’s not a price level at which we suggest closing positions. If this becomes the case (like it did in the previous trade) we will refer to these levels as levels of exit orders (exactly as we’ve done previously). Stop-loss levels, however, are naturally not “initial”, but something that, in our opinion, might be entered as an order.
Since it is impossible to synchronize target prices and stop-loss levels for all the ETFs and ETNs with the main markets that we provide these levels for (gold, silver and mining stocks – the GDX ETF), the stop-loss levels and target prices for other ETNs and ETF (among other: UGLD, DGLD, USLV, DSLV, NUGT, DUST, JNUG, JDST) are provided as supplementary, and not as “final”. This means that if a stop-loss or a target level is reached for any of the “additional instruments” (DGLD for instance), but not for the “main instrument” (gold in this case), we will view positions in both gold and DGLD as still open and the stop-loss for DGLD would have to be moved lower. On the other hand, if gold moves to a stop-loss level but DGLD doesn’t, then we will view both positions (in gold and DGLD) as closed. In other words, since it’s not possible to be 100% certain that each related instrument moves to a given level when the underlying instrument does, we can’t provide levels that would be binding. The levels that we do provide are our best estimate of the levels that will correspond to the levels in the underlying assets, but it will be the underlying assets that one will need to focus on regarding the signs pointing to closing a given position or keeping it open. We might adjust the levels in the “additional instruments” without adjusting the levels in the “main instruments”, which will simply mean that we have improved our estimation of these levels, not that we changed our outlook on the markets. We are already working on a tool that would update these levels on a daily basis for the most popular ETFs, ETNs and individual mining stocks.
Our preferred ways to invest in and to trade gold along with the reasoning can be found in the how to buy gold section. Additionally, our preferred ETFs and ETNs can be found in our Gold & Silver ETF Ranking.
As a reminder, Gold & Silver Trading Alerts are posted before or on each trading day (we usually post them before the opening bell, but we don't promise doing that each day). If there's anything urgent, we will send you an additional small alert before posting the main one.
=====
Latest Free Trading Alerts:
Do you hear the military march? The world’s largest economies are flexing their muscles and preparing for war. Will gold win the trade conflict between the United States and China?
When Two Are Fighting, Gold Wins
=====
Hand-picked precious-metals-related links:
PRECIOUS-Gold slips from near 6-week high as trade tensions recede
This New Blockchain Platform Aims to Give Gold a Digital Edge
Commentary: Fifty years of ‘free’ gold
Palladium hurt by trade-war fears but fundamentals tight
=====
In other news:
Stocks Rebound on Trade Hopes; Bonds Turn Higher: Markets Wrap
The middle is being squeezed – can it recover?
EU markets watchdog clamps down on CFDs, 'binary' options
Bitcoin Hovers Near $8,000 Level as Investors Weigh Twitter Ban
=====
Thank you.
Sincerely,
Przemyslaw Radomski, CFA
Founder, Editor-in-chief, Gold & Silver Fund Manager
Gold & Silver Trading Alerts
Forex Trading Alerts
Oil Investment Updates
Oil Trading Alerts

