

Briefly: in our opinion, full (300% of the regular position size) speculative short positions in junior mining stocks are justified from the risk/reward point of view at the moment of publishing this Alert.
It’s the Fed interest rate decision day, and the markets are holding their breath, awaiting the uncertain. However, charts already suggest the answer.
Actually, the markets are quite “certain” of what the uncertain is going to be. 99.9% of market participants expect the rates to be raised by 25 bps, which means that when the Fed delivers this decision, nothing is likely to happen.
The markets could move based on what Powell says during the press conference, though, as that’s what’s likely to impact the market’s expectations. And markets – being forward-looking – move on expectations.
The current expectations are quite dovish, as the market expects the Fed to hike rates in March (by another 25 bps) and then keep them there – that’s what appears to be the most likely scenario based on the CME FedWatch Tool. And the market anticipates that rates will begin to fall in November.
Given that inflation remains high, it appears that the surprises will be on the hawkish side.
As far as the charts are concerned, we see only a little new development on the markets, as they pretty much nullified yesterday’s pre-session decline. Still, looking at the gold price and gold stocks and comparing where they both are provides us with bearish indications.
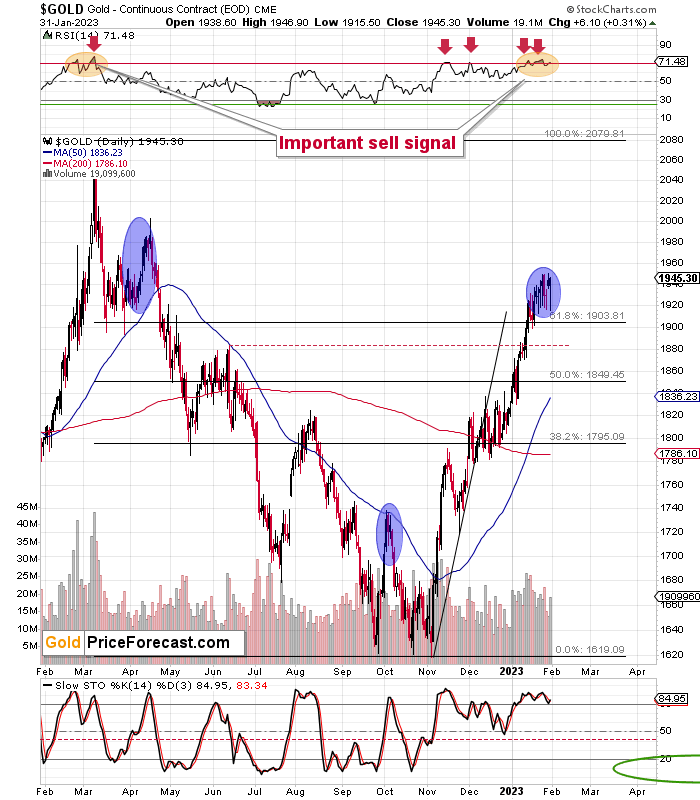
Even though gold futures invalidated a move above the 2011 high in intraday terms, they closed close to $1,945. This means that they remain near their recent highs.
Interestingly, the silver price has failed to move above the $24 level multiple times, and junior mining stocks are not at similarly high levels.
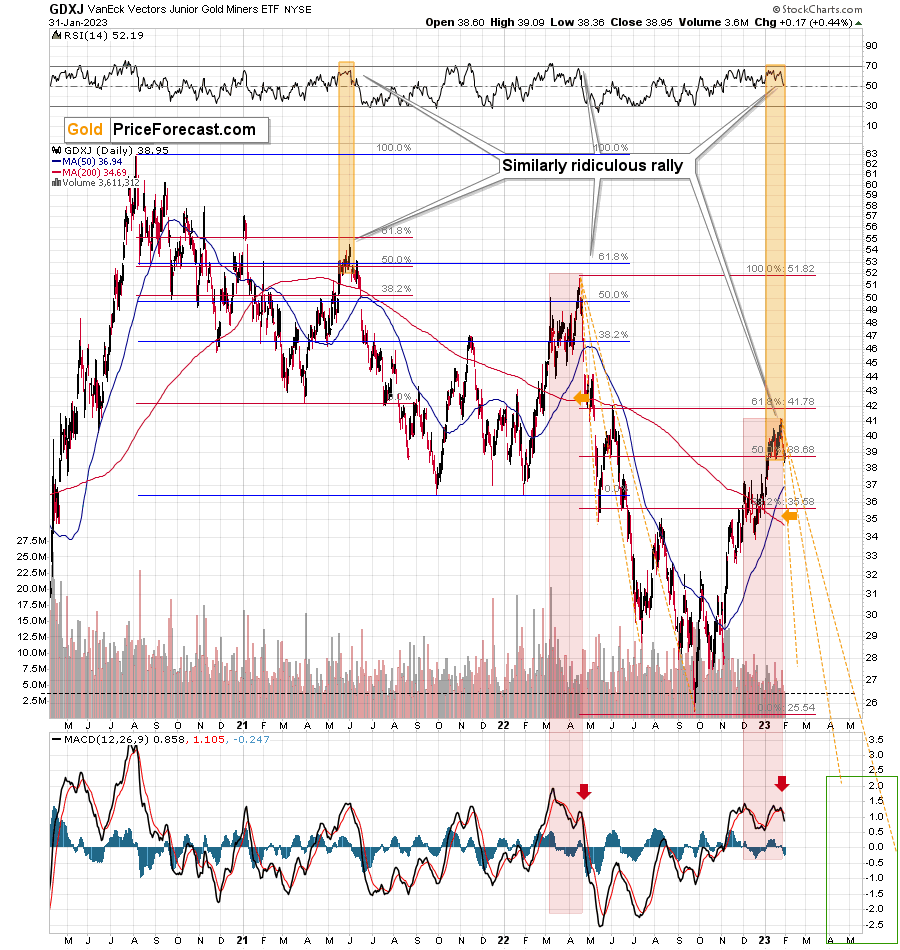
The GDXJ closed the day below the $39 level, which is well below its recent ~$41 high.
The mining stocks are therefore underperforming gold on a short-term basis as well as on a medium-term basis. After all, the GDXJ didn’t manage to correct 61.8% of its recent decline, while gold moved above its analogous retracement.
The above means that we saw a new bearish signal when taking both into account. However, there are equally bearish indications that we saw previously and that simply remain in place.
Gold’s RSI indicator is above 70, which is a classic signal, and the MACD based on the GDXJ (lower part of the chart) moved below its signal line, which is a sell indication. The same thing happened at the April 2022 top, by the way. Speaking of previous tops…
Even more importantly, the GDXJ’s correction of more than 50% but less than 61.8% of the preceding decline is something that ended two of the recent short-term but big corrections. The first one ended in June 2021, and the second one ended in April 2022. Now it seems that the current one ended in January 2023.
Each of those corrective upswings ended with the RSI near 70, and it’s been trading there for some time before moving much lower. History has a tendency to rhyme, and it appears that we are witnessing another bearish analogy at this time.
Also, have you noticed that the situation in the positions of gold hedgers (as reported by the Commitment of Traders report) is very similar to what we saw in 2012, right before the biggest part of the decline?
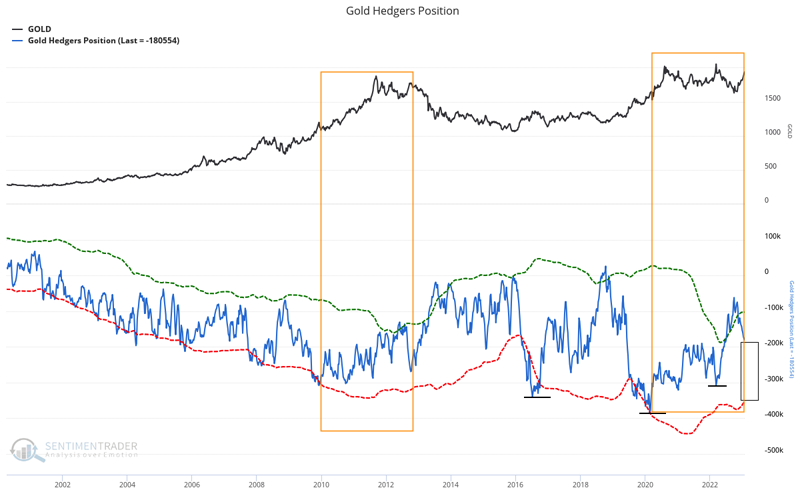
Yes, the orange rectangles are 100% identical (copy-paste).
The time between the low in the hedger’s position and the low that marked the start of the massive slide in gold is practically the same as the time between the 2020 bottom in the hedger’s position and the current moment.
Remarkable, isn’t it?
I already wrote previously that the current situation is similar to the 2011-2012 performance, with the exception that this time we saw an extra upswing in the meantime due to the Russian invasion.
The above chart clearly shows that the analogy remains intact, and its implications are very, very bearish.
Having said that, let’s take a look at the markets from a more fundamental point of view.
Will the FOMC End Gold’s Rally?
With the FOMC widely expected to increase the U.S. federal funds rate (FFR) by 25 basis points today, all eyes will be on Fed Chairman Jerome Powell’s 2:30 p.m. ET press conference. However, since investors often hear what they want to hear, his words should have little impact beyond the short term. As a result, it’s prudent to stay focused on the medium-term outlook, which continues to align with our technical and fundamental expectations.
For example, with the economic data supporting higher interest rates, the pivot narrative lacks fundamental merit. As evidence, the Dallas Fed’s Texas Service Sector Outlook Survey noted on Jan. 31:
“Labor market indicators pointed to stronger employment growth and steady workweeks. The employment index climbed five points from 5.3 to 10.5, while the part-time employment index rose three points to 1.2. The hours worked index improved from -1.8 to 0.9.”
In addition, we noted the strength in the manufacturing report on Jan. 31. We wrote:
“Labor market measures pointed to stronger employment growth and longer workweeks. The employment index climbed four points to 17.6, a reading significantly above its series average of 7.9. Thirty-one percent of firms noted net hiring, while 13 percent noted net layoffs. The hours worked index held fairly steady at 3.8.”
Likewise, The Conference Board released its Consumer Confidence Index on Jan. 31; and while the metric declined from 109.0 in December (an upward revision) to 107.1 in January, it has bounced off the lows from July 2022.
Please see below:
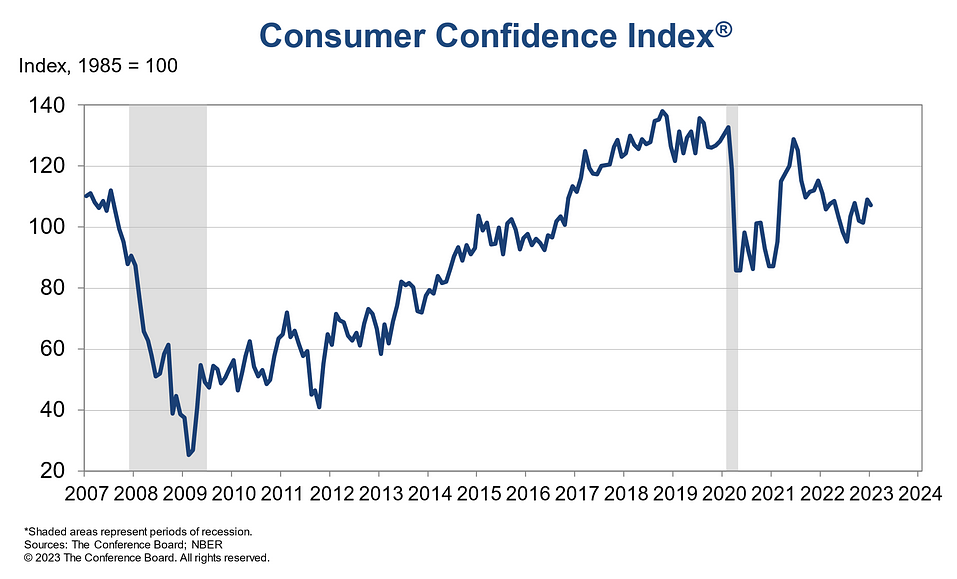 More importantly, the report stated:
“48.2% of consumers said jobs were ‘plentiful,’ up from 46.4%. 11.3% of consumers said jobs were ‘hard to get,’ down from 11.9%.”
Please see below:
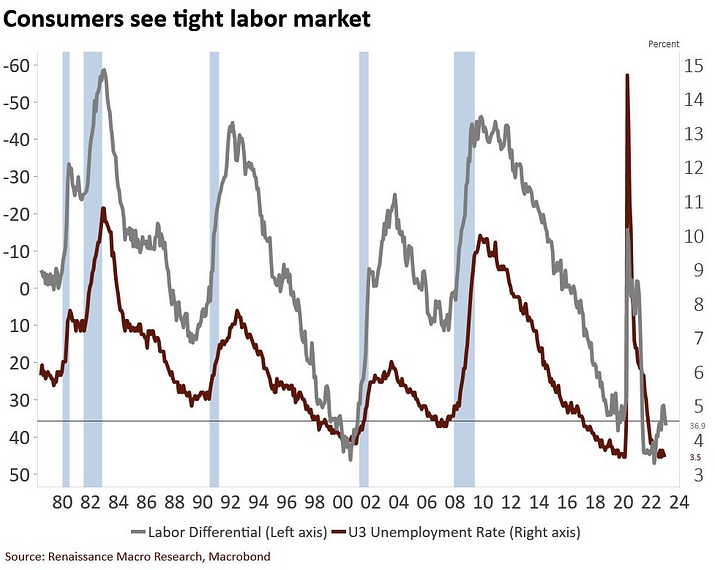 To explain, the red line above tracks the U.S. U3 unemployment rate, while the gray line above tracks The Conference Board’s inverted (down means up) labor differential. For context, the latter is calculated by subtracting the jobs are ‘hard to get’ percentage from the jobs are ‘plentiful’ percentage. In a nutshell: a lower gray line means that Americans are confident about their employment prospects.
If you analyze the right side of the chart, you can see that the labor differential rose to 36.9% in January, its highest level since September. Thus, while the Fed needs to increase the U.S. unemployment rate to suppress wage inflation, the necessary demand destruction is not present.
Speaking of which, the U.S. Employment Cost Index (ECI) increased by 1.03% quarter-over-quarter (QoQ) on Jan. 31, slightly below the consensus estimate of 1.1%. But, the data is still profoundly hawkish from a historical perspective.
Please see below:
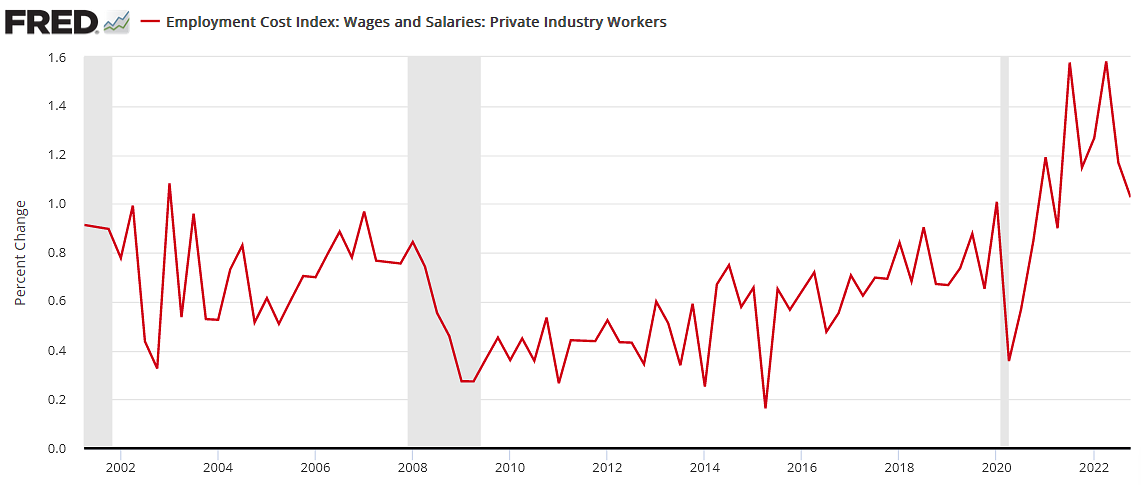 To explain, the red line above tracks the QoQ percentage change in the ECI. If you analyze the movement, you can see that a QoQ rise of 1% or more only occurred two times from 2001 until the pandemic began, though, there were also three others between 0.96% and 0.99% QoQ. In any event, QoQ increases of 1%+ are rare and highlight how wage inflation remains abundant.
In addition, with more earnings releases hitting the wire on Jan. 31, the pricing pressures remain. McDonald’s – the largest restaurant chain in the world – released its fourth-quarter earnings pre-market. CFO Ian Borden said during the Q4 conference call:
“In the U.S., we would say we're past the inflation peak and kind of heading on that downward slope. But certainly, we had high inflation, mid-teens in 2022 from a food and paper perspective. In 2023, we think our food and paper inflation is going to be kind of mid to high single digits. So still obviously very elevated from where it's been for a long time.”
He added:
“If you look at the full year in the U.S., we were up about 10% from an average pricing standpoint.”
So, while McDonald’s inflation has cooled from its peak, “mid to high single digits” still imply inflation of 5% to 9% in 2023. Moreover, the conjecture is profoundly hawkish because it shows that real businesses do not expect a 2% inflation rate anytime soon. Consequently, a higher FFR is needed to revert the cycle back to its pre-pandemic state.
As further evidence, Caterpillar – the world’s largest construction equipment manufacturer – released its fourth-quarter earnings on Jan. 31. CFO Andrew Bonfield said during the Q4 conference call:
“We currently expect to see a moderation of input costs inflation as the year progresses, and a corresponding moderation in price realization as we move through the year. Price, though, should still more than offset manufacturing costs for the year (…).
“We still expect strong price in Q1. It will not be as big as Q4 for the simple reason we are lapping price increases that we put through at the beginning of 2022. So that will be coming down slightly, but we do expect price cost to be favorable for the first half of the year.”
Please see below:
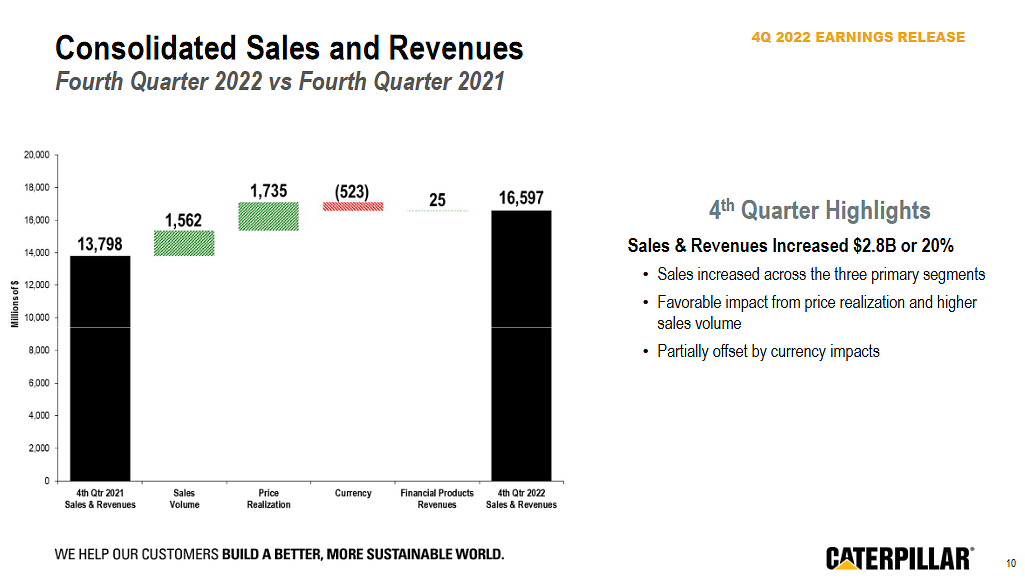 To explain, Caterpillar recorded 20% revenue growth in Q4, but nearly 62% of that was a function of higher prices. This means the company raised its average selling price by more than 12%, and with “strong price in Q1” expected, we’re nowhere near the Fed’s 2% target or a level that would justify a dovish pivot.
Overall, risk assets remain elevated as the crowd underestimates the potential risks; and while it’s a fool’s errand to guess what Powell will or won’t say, please remember that the fundamentals lead the Fed, not the other way around. Therefore, with the medium-term outlooks bullish for the FFR, real yields and the USD Index, interest rates should have more upside before it’s all said and done.
Is FOMC day a ‘sell the news’ event, or will the crowd remain enthusiastic? Why are Americans so optimistic about their job prospects? And if the Fed pauses, why would corporations stop raising their prices?
Should Silver Be Nervous Ahead of the FOMC?
While silver bounced off its 50-day moving average on Jan. 31, we wrote earlier in the day that as time passes and silver stagnates, its 50-day moving average continues to rise. As a result, the white metal needs to rally soon, or a breakdown could occur in the coming days.
Furthermore, while the short-term strength may seem bullish, the walls are quickly closing in. With the 50-day MA ending the Jan. 31 session at $23.25 and silver unable to hold $24, it’s running out of room to trade sideways. Consequently, we should be on breakdown watch in the days ahead.
To that point, while the recent price action across the financial markets may seem optimistic, the reality is that the least sophisticated investors are back buying the dip.
Please see below:
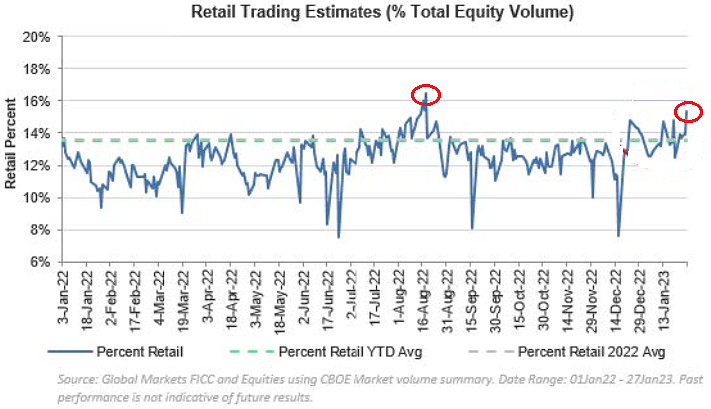 To explain, Goldman Sachs estimates that retail purchases as a percentage of total volume have increased in 2023, as the amateurs attempt to call the bottom once again. However, their relentless bid peaked on Aug. 16, which, unsurprisingly, marked the end of the S&P 500’s bear market rally. Thereafter, the index sunk to new lows.
As it stands, when retail dives in and institutions chase for performance purposes, the implications are bearish. As always, sentiment eventually collides with the technicals and the fundamentals, and the end result is often major drawdowns.
To that point, we warned for months that the recession fears in September and October reduced asset prices and helped depress the headline Consumer Price Index (CPI). But, when the pessimism reverses, higher asset prices have the opposite effect.
Similarly, with January likely far from disinflationary, the ramifications of jumpy inflation should enhance volatility in the weeks and months ahead.
Please see below:
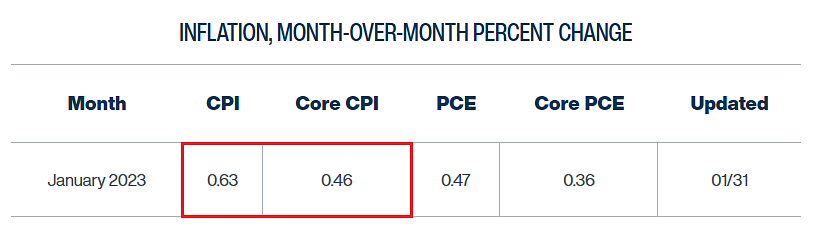 To explain, the Cleveland Fed’s final estimate (updated on Jan. 31) for the month-over-month (MoM) percentage change in the headline CPI is 0.63%, while the core CPI estimate remained constant at 0.46%. As such, the former annualizes to 7.83%, while the latter annualizes to 5.67%. For context, we wrote on Jan. 23:
Analyzing MoM inflation will be useful going forward, as monthly changes allow for annual estimates of where YoY inflation will go if the current trends persist. Therefore, with these MoM figures well beyond what’s needed for the Fed to reach its 2% mandate, the implications are profoundly hawkish.
To put it in context, 2% annual inflation requires MoM prints of less than 0.17%. So, with the current data tracking well above that, a pivot contrasts fundamental logic.
On top of that, Oshkosh Corporation – which designs and builds specialty trucks, military vehicles, truck bodies and more – released its fourth-quarter earnings on Jan. 31. CFO Mike Pack said during the Q4 conference call:
“We certainly don't expect that inflation is going to be lower this year, and certainly, that's reflected in our estimates (…).
“We have more price coming online in 2023, about in line with inflation. We have significant double-digit increases already in backlog beyond the current levels as we get into 2024. So we would expect as supply chains to improve and we get those additional pricing benefits in that business that we'll get back to our typical margins in 2024 and beyond.”
Regarding its Fire & Emergency segment, he added:
“We essentially have a pretty robust backlog for 2024 already; there is significant price increases like double-digit versus where we're sitting today. So we expect as we get into 2024, those margins will return back to normal.”
Please see below:
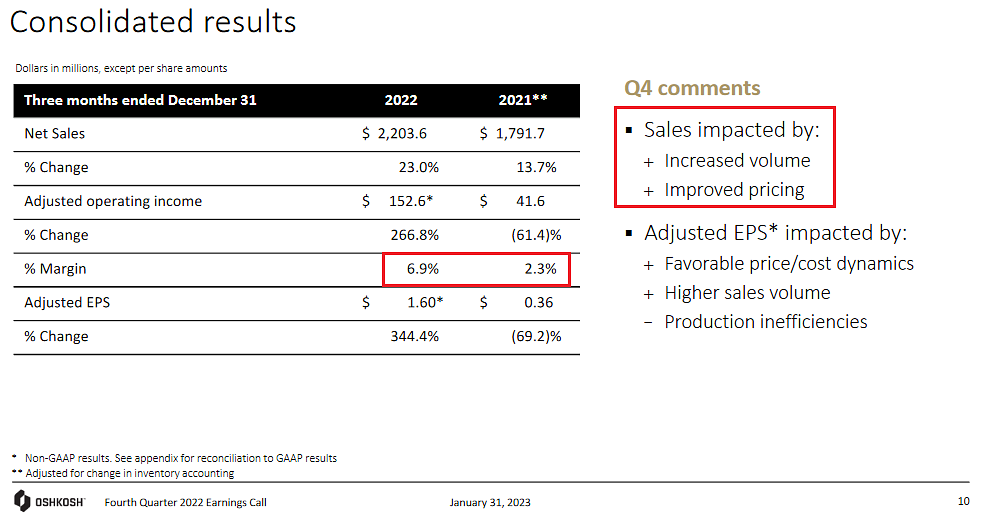 To explain, the company’s adjusted operating margin increased from 2.3% in Q4 2021 to 6.9% in Q4 2022; and remember, that doesn’t happen without price increases or profound changes in cost efficiency.
Overall, we believe that silver has immense long-term potential. But, the fundamentals remain bearish due to the inflation backdrop and the historical implications of where the FFR needs to go to win this war. We’ve been highlighting earnings reports since early 2021, and with each passing quarter, companies continue to raise their prices to protect (or enhance) their profit margins.
As a result, investors are kidding themselves if they think that inflation will dissipate on its own. In reality, as long as corporations are confronted with input pressures, they will continue to raise prices; and please note, real economy companies are more labor intensive, and wage inflation impacts them more.
For example, Caterpillar has a ~$130 billion market cap, while Meta Platforms (Facebook) has a ~$390 billion market cap. Yet, Caterpillar has more than 107,000 employees, while Meta Platforms has roughly 50,000 (and many in foreign jurisdictions). Thus, the revolving door of input and output costs should continue until higher interest rates create demand destruction.
Overall, while the FOMC meeting may be a volatile event, the fundamentals have not deviated from our expectations. Consequently, we still expect silver to take out its 2022 lows before this bear market ends.
How powerful are retail investors in this market? Will they be all in at the top once again? When does the FOMC officially pivot?
The Bottom Line
While earnings optimism helped lift the S&P 500 on Jan. 31, the inflationary impact is underestimated. As long as demand remains resilient, corporations will keep raising their prices. Likewise, as long as optimism reigns, economically-sensitive commodities will catch a bid and further escalate the input-output inflation cycle. As such, Goldilocks is a fairy tale, and the bulls should learn this the hard way over the medium term.
In conclusion, the PMs rallied on Jan. 31, as sentiment swings are expected this week. However, nothing has changed from a medium-term perspective, and we believe this bear market has plenty of room to run.
Overview of the Upcoming Part of the Decline
- It seems to me that the corrective upswing is over (or about to be over) and that the next big move lower is already underway (or that it’s about to start).
- If we see a situation where miners slide in a meaningful and volatile way while silver doesn’t (it just declines moderately), I plan to – once again – switch from short positions in miners to short positions in silver. At this time, it’s too early to say at what price levels this could take place and if we get this kind of opportunity at all – perhaps with gold prices close to $1,500 - $1,550.
- I plan to switch from the short positions in junior mining stocks or silver (whichever I’ll have at that moment) to long positions in junior mining stocks when gold / mining stocks move to their 2020 lows (approximately). While I’m probably not going to write about it at this stage yet, this is when some investors might consider getting back in with their long-term investing capital (or perhaps 1/3 or 1/2 thereof).
- I plan to return to short positions in junior mining stocks after a rebound – and the rebound could take gold from about $1,450 to about $1,550, and it could take the GDXJ from about $20 to about $24. In other words, I’m currently planning to go long when GDXJ is close to $20 (which might take place when gold is close to $1,450), and I’m planning to exit this long position and re-enter the short position once we see a corrective rally to $24 in the GDXJ (which might take place when gold is close to $1,550).
- I plan to exit all remaining short positions once gold shows substantial strength relative to the USD Index while the latter is still rallying. This may be the case with gold prices close to $1,400 and GDXJ close to $15 . This moment (when gold performs very strongly against the rallying USD and miners are strong relative to gold after its substantial decline) is likely to be the best entry point for long-term investments, in my view. This can also happen with gold close to $1,400, but at the moment it’s too early to say with certainty.
- The above is based on the information available today, and it might change in the following days/weeks.
You will find my general overview of the outlook for gold on the chart below:
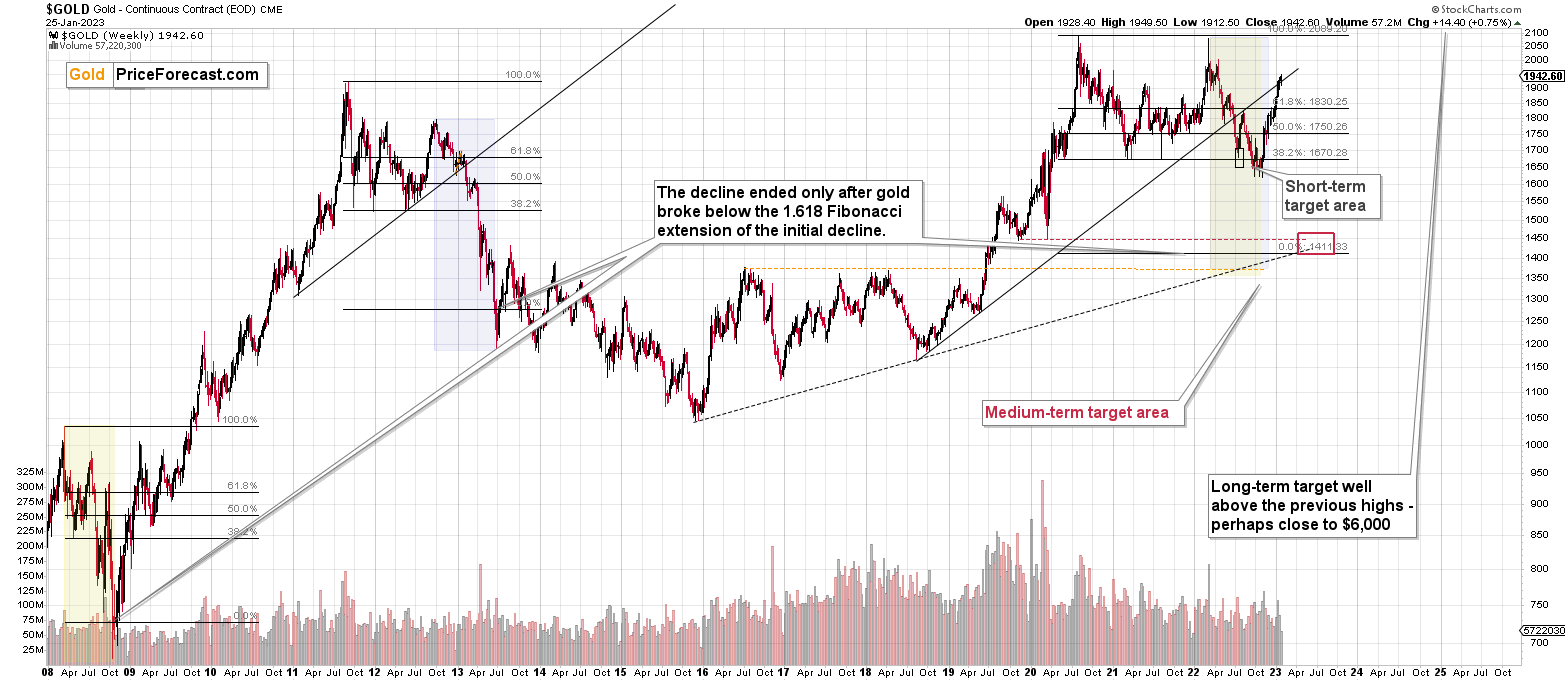
Please note that the above timing details are relatively broad and “for general overview only” – so that you know more or less what I think and how volatile I think the moves are likely to be – on an approximate basis. These time targets are not binding nor clear enough for me to think that they should be used for purchasing options, warrants, or similar instruments.
Letters to the Editor
We received a few messages over e-mail, but as we are moving to our new platform, we will be transferring them below the articles as comments – and that’s where we’ll be replying to them.
Asking your questions below the articles or in the spaces called “Ask the Community” or “Position Sizes” directly will help us deliver a reply sooner. In some cases, someone from the community might reply and help even before we do.
Please remember about the Pillars of our Community, especially about the Kindness of Speech Pillar.
Also, if there’s anything that you’re unhappy with, it’s best to send us a message at [email protected].
Please note that this section is going to go away within the next 1-8 weeks, as you can add comments/questions below the article on Golden Meadow – the platform that we’re using to provide our analyses. Your notification e-mails include an invitation link that allows you to access the “Gold Trading Alerts” space.
Also, if you haven’t had the chance to see the video, in which I’m talking about the new platform and why we essentially moved from Sunshine Profits to Golden Meadow, I strongly encourage you to do so:
Summary
Summing up, it seems that the major bottom in the USD Index is in (or at hand), while the correction in stocks, gold, silver, and mining stocks is over – or very close to being over.
Gold and silver correct about 61.8% of their 2022 decline, while junior miners corrected a bit more than 50% of the decline, but not more than 61.8% thereof. This is exactly how the big 2021 and 2022 declines in junior miners started.
Given the above, gold’s very long-term resistance (the 2011 high!) and the situation in the USD Index, it seems that the next big move lower in the precious metals sector is about to start.
Now, as more investors realize that interest rates will have to rise sooner than expected, the prices of precious metals and mining stocks (as well as other stocks) are likely to fall. In my opinion, the current trading position is going to become profitable in the following weeks, and quite possibly in the following days. And while I can’t promise any kind of performance, I fully expect it to become very profitable before it’s over and to prolong our 2022 winning streak.
After the final sell-off (that takes gold to about $1,350-$1,500), I expect the precious metals to rally significantly. The final part of the decline might take as little as 1-5 weeks, so it's important to stay alert to any changes.
As always, we'll keep you – our subscribers – informed.
To summarize:
Trading capital (supplementary part of the portfolio; our opinion): Full speculative short positions (300% of the full position) in junior mining stocks are justified from the risk to reward point of view with the following binding exit profit-take price levels:
Mining stocks (price levels for the GDXJ ETF): binding profit-take exit price: $20.32; stop-loss: none (the volatility is too big to justify a stop-loss order in case of this particular trade)
Alternatively, if one seeks leverage, we’re providing the binding profit-take levels for the JDST (2x leveraged). The binding profit-take level for the JDST: $22.87; stop-loss for the JDST: none (the volatility is too big to justify a SL order in case of this particular trade).
For-your-information targets (our opinion; we continue to think that mining stocks are the preferred way of taking advantage of the upcoming price move, but if for whatever reason one wants / has to use silver or gold for this trade, we are providing the details anyway.):
Silver futures downside profit-take exit price: $14.32
SLV profit-take exit price: $13.42
ZSL profit-take exit price: $48.87
Gold futures downside profit-take exit price: $1,504
HGD.TO – alternative (Canadian) 2x inverse leveraged gold stocks ETF – the upside profit-take exit price: $16.47
HZD.TO – alternative (Canadian) 2x inverse leveraged silver ETF – the upside profit-take exit price: $36.87
Long-term capital (core part of the portfolio; our opinion): No positions (in other words: cash)
Insurance capital (core part of the portfolio; our opinion): Full position
Whether you’ve already subscribed or not, we encourage you to find out how to make the most of our alerts and read our replies to the most common alert-and-gold-trading-related-questions.
Please note that we describe the situation for the day that the alert is posted in the trading section. In other words, if we are writing about a speculative position, it means that it is up-to-date on the day it was posted. We are also featuring the initial target prices to decide whether keeping a position on a given day is in tune with your approach (some moves are too small for medium-term traders, and some might appear too big for day-traders).
Additionally, you might want to read why our stop-loss orders are usually relatively far from the current price.
Please note that a full position doesn't mean using all of the capital for a given trade. You will find details on our thoughts on gold portfolio structuring in the Key Insights section on our website.
As a reminder - "initial target price" means exactly that - an "initial" one. It's not a price level at which we suggest closing positions. If this becomes the case (as it did in the previous trade), we will refer to these levels as levels of exit orders (exactly as we've done previously). Stop-loss levels, however, are naturally not "initial", but something that, in our opinion, might be entered as an order.
Since it is impossible to synchronize target prices and stop-loss levels for all the ETFs and ETNs with the main markets that we provide these levels for (gold, silver and mining stocks - the GDX ETF), the stop-loss levels and target prices for other ETNs and ETF (among other: UGL, GLL, AGQ, ZSL, NUGT, DUST, JNUG, JDST) are provided as supplementary, and not as "final". This means that if a stop-loss or a target level is reached for any of the "additional instruments" (GLL for instance), but not for the "main instrument" (gold in this case), we will view positions in both gold and GLL as still open and the stop-loss for GLL would have to be moved lower. On the other hand, if gold moves to a stop-loss level but GLL doesn't, then we will view both positions (in gold and GLL) as closed. In other words, since it's not possible to be 100% certain that each related instrument moves to a given level when the underlying instrument does, we can't provide levels that would be binding. The levels that we do provide are our best estimate of the levels that will correspond to the levels in the underlying assets, but it will be the underlying assets that one will need to focus on regarding the signs pointing to closing a given position or keeping it open. We might adjust the levels in the "additional instruments" without adjusting the levels in the "main instruments", which will simply mean that we have improved our estimation of these levels, not that we changed our outlook on the markets. We are already working on a tool that would update these levels daily for the most popular ETFs, ETNs and individual mining stocks.
Our preferred ways to invest in and to trade gold along with the reasoning can be found in the how to buy gold section. Furthermore, our preferred ETFs and ETNs can be found in our Gold & Silver ETF Ranking.
As a reminder, Gold & Silver Trading Alerts are posted before or on each trading day (we usually post them before the opening bell, but we don't promise doing that each day). If there's anything urgent, we will send you an additional small alert before posting the main one.
Thank you.
Przemyslaw K. Radomski, CFA
Founder, Editor-in-chief

