
Briefly: In our opinion (full) speculative short positions in gold, silver and mining stocks are currently justified from the risk/reward perspective.
Gold, silver and mining stocks ended the last week by plunging significantly and on huge volume. Naturally, this is a bearish sign, especially given the limited size of Friday’s rally in the USD Index. Is the next big slide in the precious metals underway?
In short – the above seems probable in our opinion. We use the following charts to explain why. Let’s start with the USD Index (charts courtesy of http://stockcharts.com).
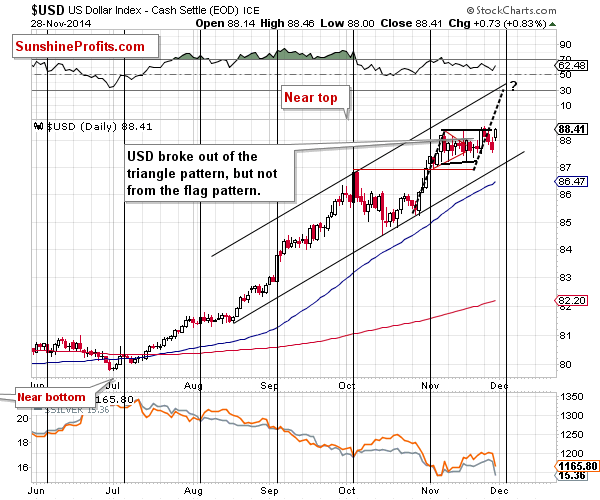
In general, since there was no breakout above the flag pattern, our previous comments remain up-to-date. We have something to add, though, and we will do so after quoting the previous alert:
The USD Index moved visibly higher [last] Friday, breaking out of the triangle pattern. The implications are bullish but not strongly bullish, as the pattern started to resemble more of a flag than a triangle. Since the flag pattern was not broken, many traders probably thought that the situation hadn’t changed. This could explain the lack of response in the precious metals market. If we saw a strong breakout and metals didn’t react, then it would definitely be a sign of strength, but at this time, it could be the case that the market participants are still not viewing the dollar’s move as something real.
(…)
The downside is limited in case of a breakdown, and the upside is visibly higher in case of a breakout. If we see a move similar to the one that preceded the recent consolidation, then we could see a move close to the 89 level that would materialize in the first part of December. This scenario seems quite likely also given the resistance line that would be reached (it would simply “fit”) and the cyclical turning point – we are likely to see at least a local top close to it.
We could see a small move lower before the rally starts, though. This means that the above doesn’t invalidate our previous outlook and price targets for the precious metals sector.
We indeed saw a small move lower, but it was after the USD moved to the upper border of the flag pattern. It was also a pullback after the breakout from the triangle pattern. It seems that it was the strength in the USD Index that followed the pullback that got the attention of precious metals traders. They seem to have “believed” that the USD could actually move even higher in the coming weeks. The move above the upper border of the flag pattern is something that could definitely cause an additional significant decline in the precious metals sector.
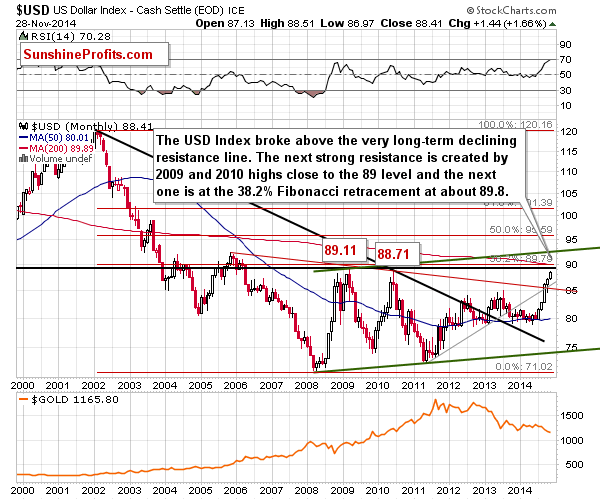
As we have mentioned previously, the USD Index could rally to 90 or so before the rally ends or pauses for longer. There are a few resistance levels ahead: the 2010 and 2009 highs at 88.71 and 89.11, and there’s also the 38.2% Fibonacci retracement level right below the 90 level. This means that we could see another over-one-index-point rally in the USD Index shortly.
This means that gold and the rest of the precious metals sector could have another big reason to decline very soon.
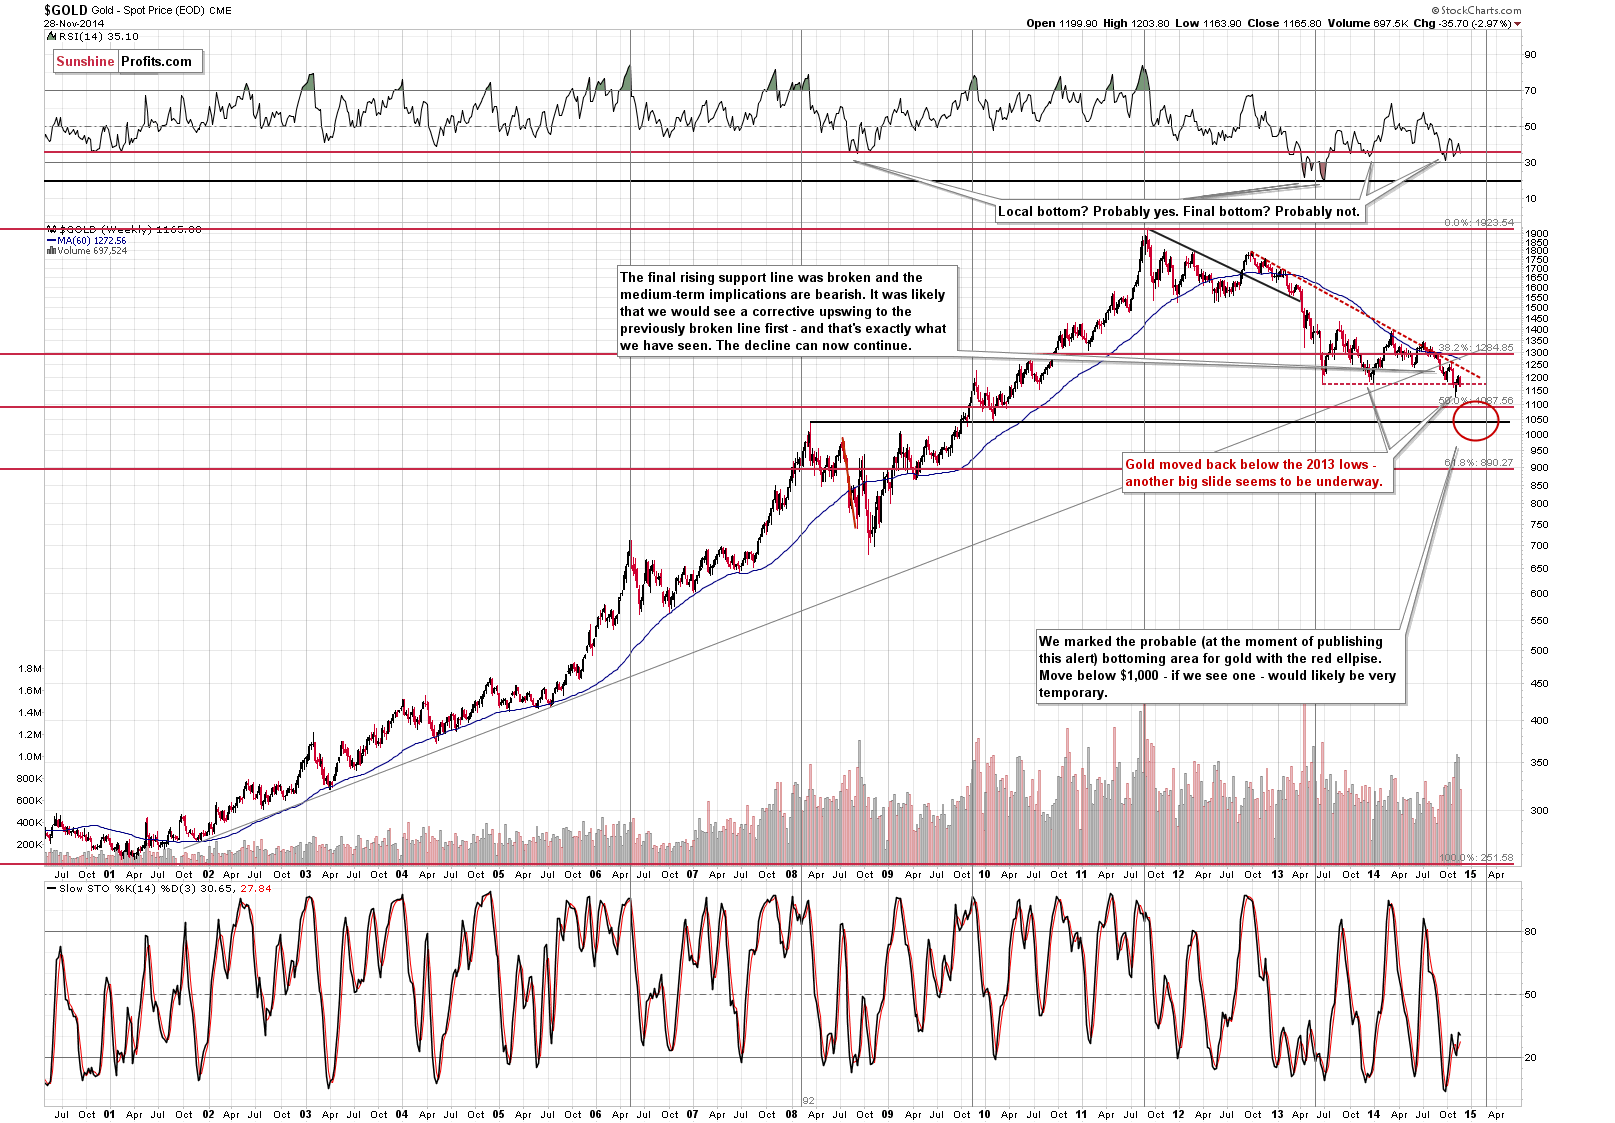
The 2013 low was once again broken to the downside and the implications are bearish. As you can see on the above chart, gold is heading to our target area, but it’s not in it yet. It seems to us that it has further to decline and the breakdown serves as a confirmation.
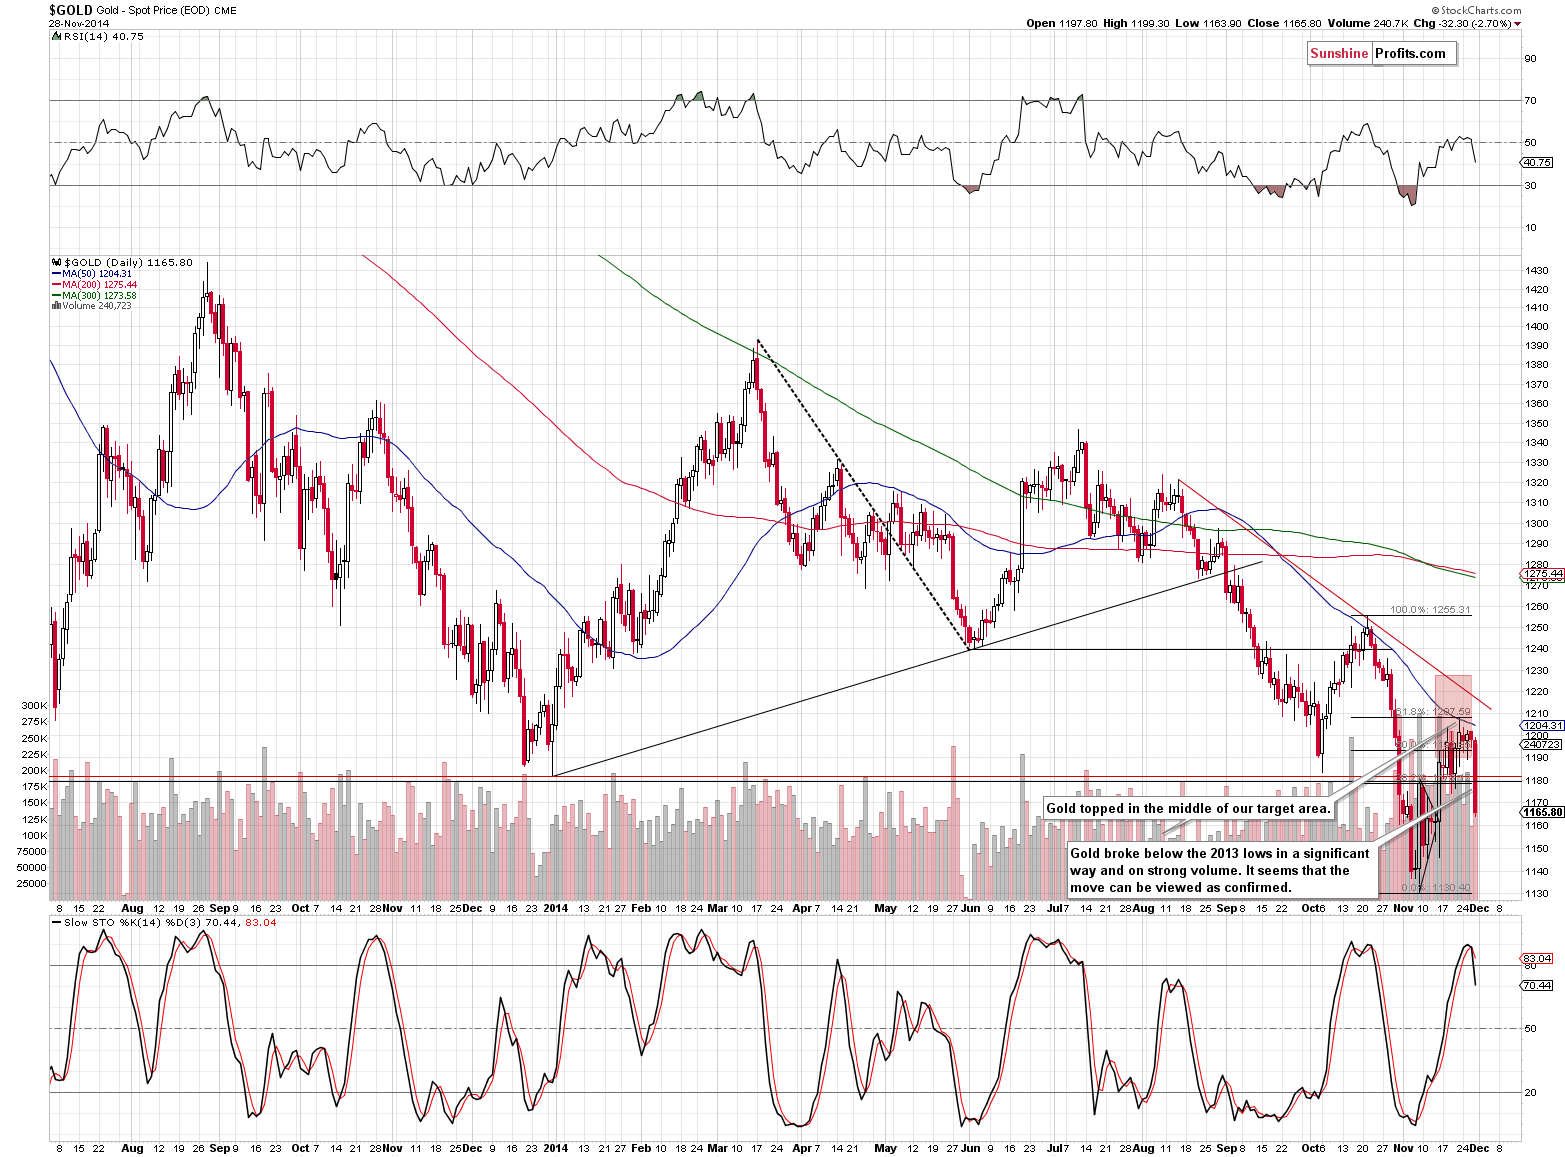
The breakdown is more visible from the short-term perspective. We also see that the move materialized on big volume. We normally wait for 3 consecutive closes below a given level to say that a breakdown is confirmed, but given the volume and the size of the move, this type of confirmation is not necessary to say that the implications are already very bearish.
How low can gold move? Most likely at least (!) to the November low, but it’s quite likely that it moves even lower.
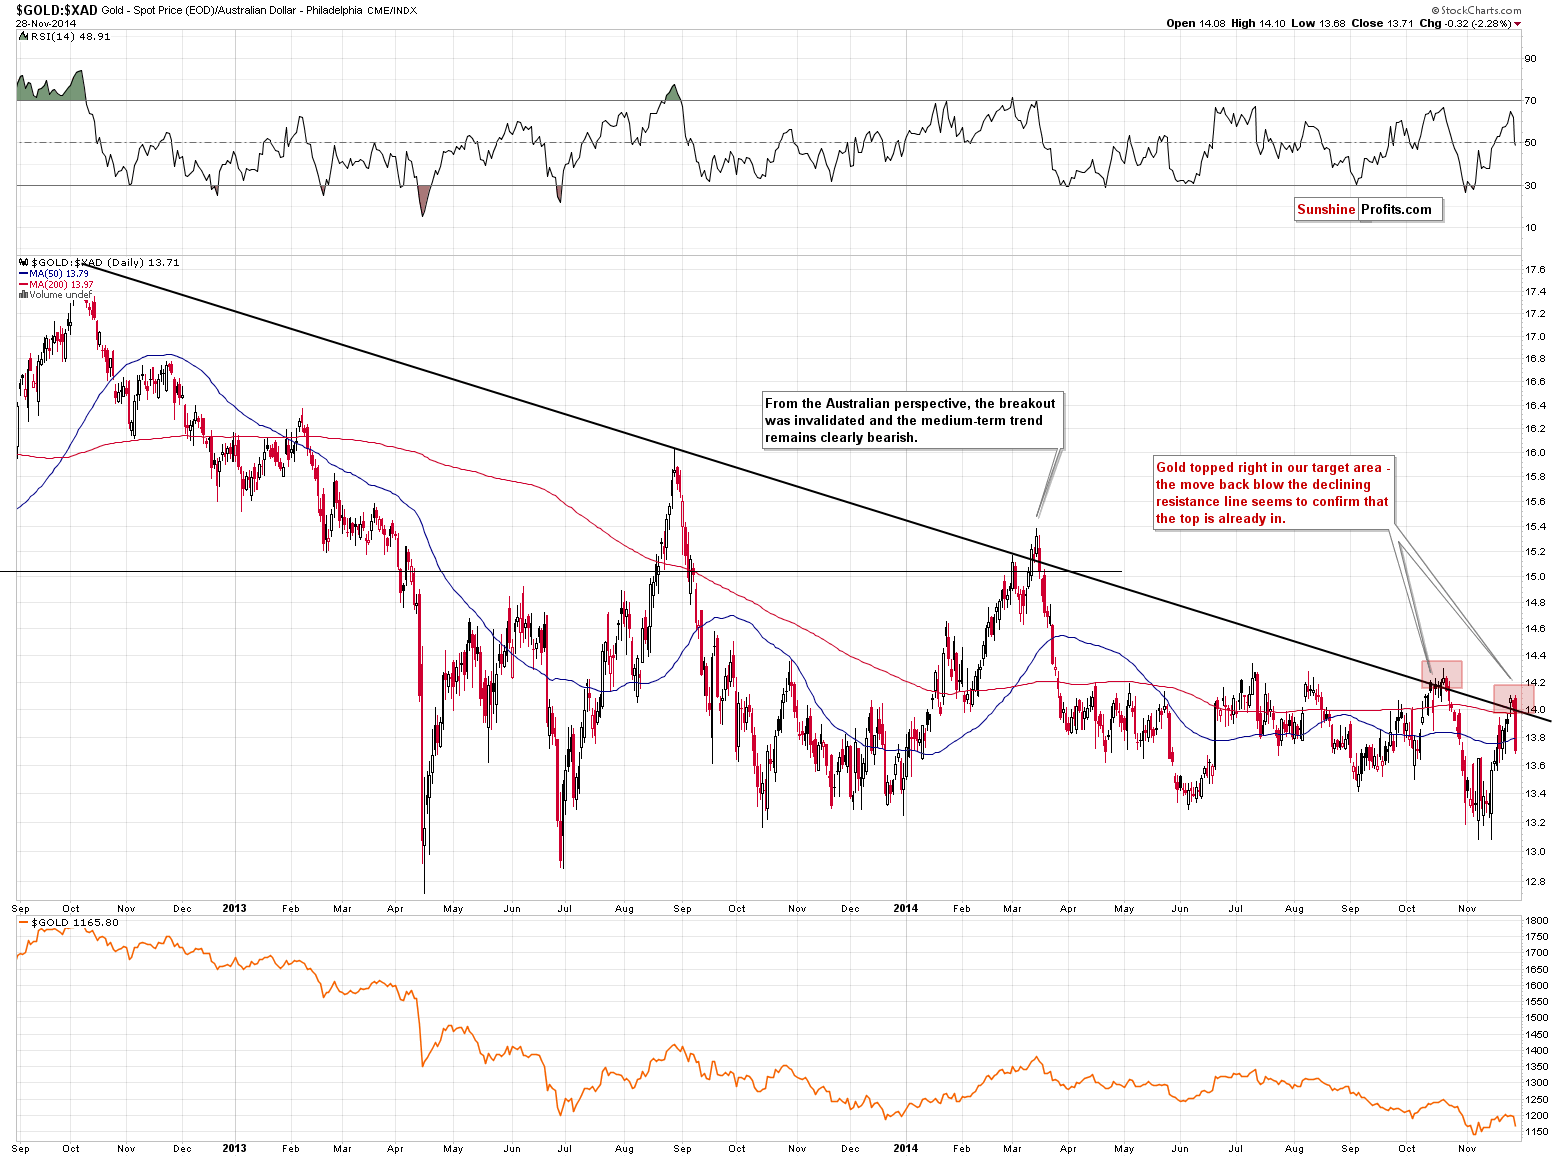
We have previously commented on gold’s performance from the Australian dollar perspective in the following way:
We’ve seen a more interesting development in gold from the Australian perspective. Gold priced in the Australian dollar moved above the declining medium-term resistance line. Even though the breakout seems to be a bullish factor, it really isn’t as the previous 2 “breakouts” turned out to be fakeouts and they both marked major tops in gold also from the USD perspective. The implications, therefore, are bearish.
The history repeated itself once again and those who blindly follow the general rules regarding technical developments such as breakouts without taking a second thought and verifying if a given technique has worked in a particular market were very surprised by Friday’s decline. You knew that the breakout was suspicious to say the least and actually bearish to be more precise.
The decline that we saw on Friday serves as a bearish confirmation and a sign that we are quite likely to see another big decline in the precious metals sector – given what followed the previous 2 “fakeouts” that we saw this year.
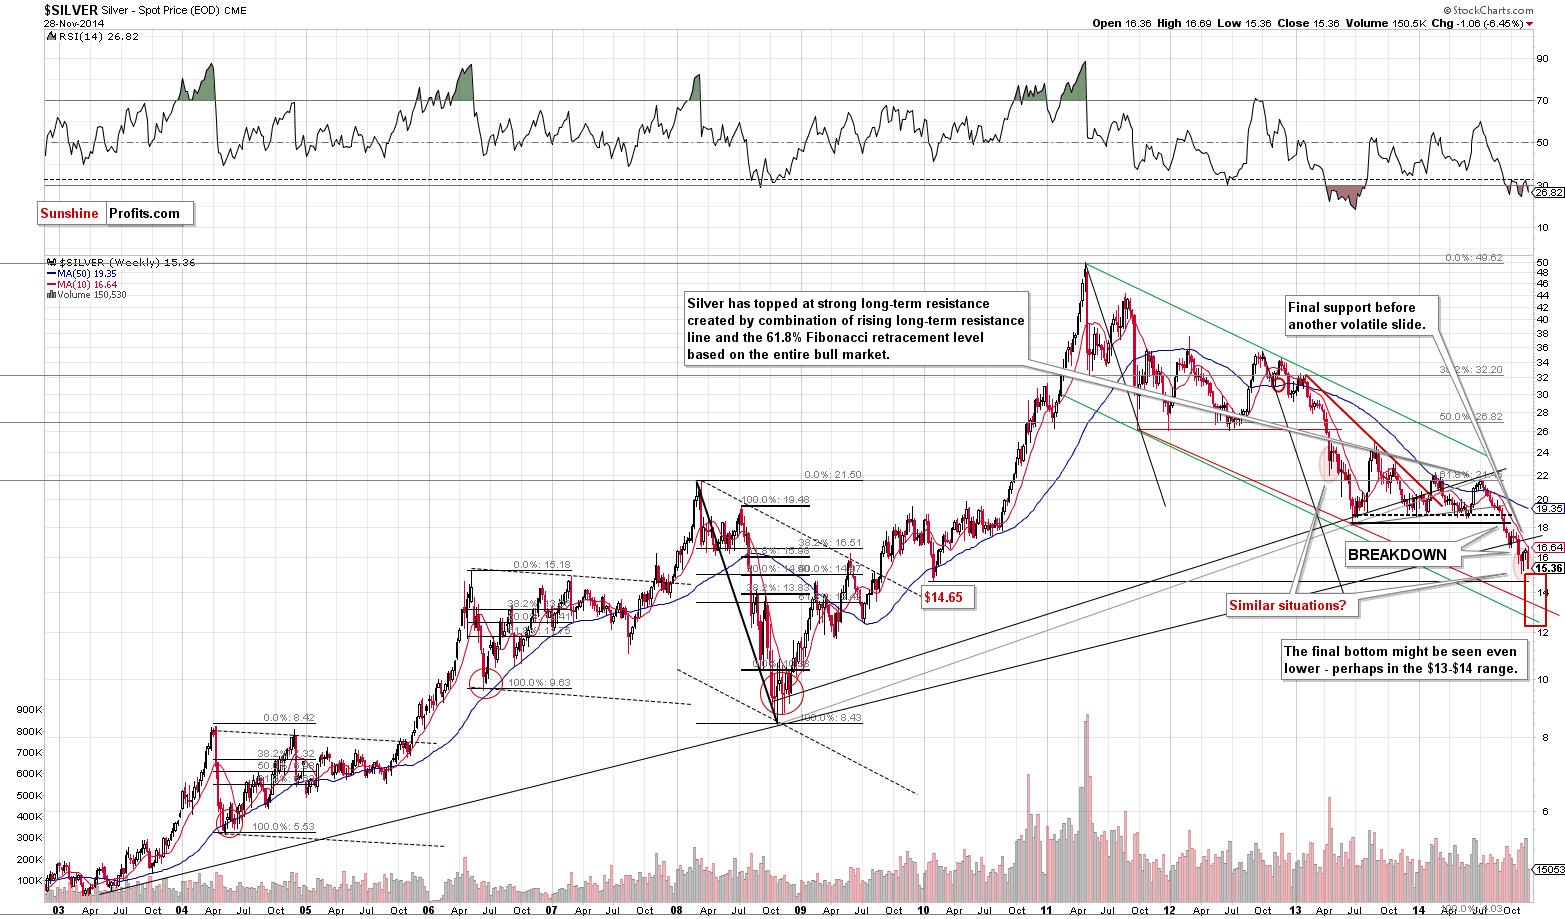
In the previous alert we wrote the following regarding silver:
From the long-term perspective, the recent move higher still seems to be nothing more than a correction. The thing that we would like to emphasize today is that back in 2008, during the previous big slide, silver corrected approximately to its 10-week moving average and this is more or less where silver moved yesterday. Consequently, it might be the case the next local top is very close.
It seems that the local top has just formed. In both 2008 and 2013, when silver declined after the pause, it didn’t move back up until another big slide took place. Moreover, in both cases the pause analogous to this one took place just a little after the half of the last big decline. If history repeats itself, we could see another few-dollar decline in the white metal – which is in tune with our target area. Yes, silver below $13 at the bottom is possible.
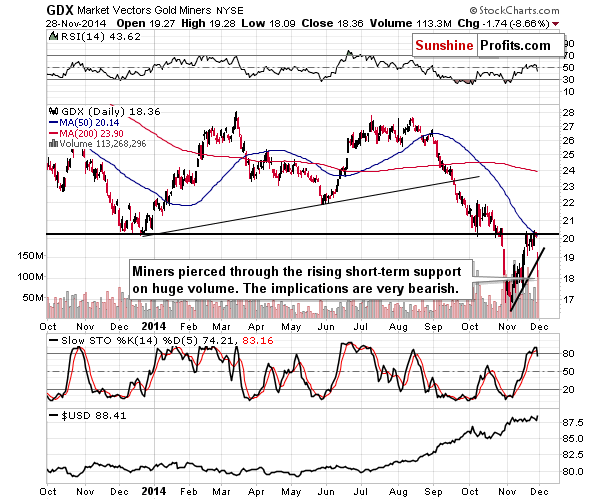
Mining stocks broke below their rising support line, which is a bearish sign. The fact that makes it a very bearish sign is the volume. It was huge. Just like it is the case with gold, in our opinion the size of the move and the accompanying volume are enough to make us view this breakdown as confirmed. A confirmed breakdown below a short-term support line is a very bearish development. It basically cancels the bullish implications of the miners’ previous outperformance of gold.
Before we summarize, we would like to remind one of the medium-term factors that we commented on a week ago.
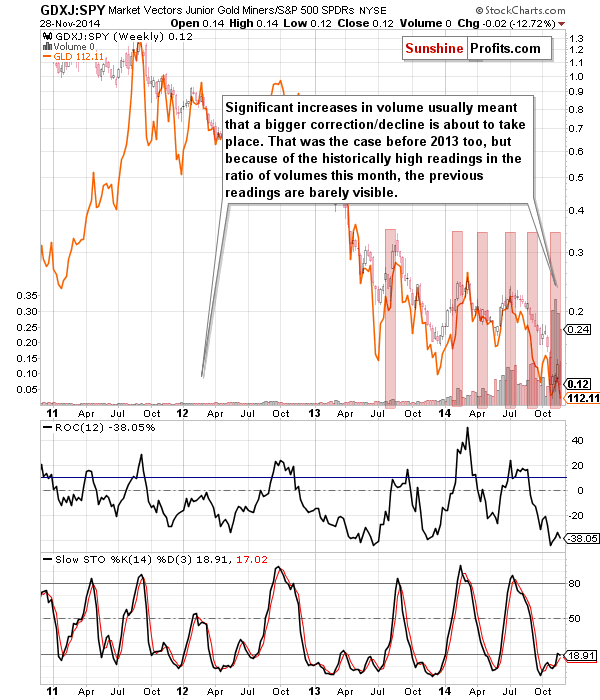
We wrote the following:
The above chart features the GDXJ to SPY ratio, which means that it will move higher when juniors rally faster than the general stock market. The volume is actually the ratio of volumes. The things that are particularly interesting are situations when we see sudden spikes in the volume (a ratio of volumes). This is when juniors are a particularly “hot topic” – of course on a relative basis. The useful tendency is that these times very often precede or mark important price tops in the precious metals sector. The spikes that we saw in the last 2 weeks were historically high. They were so huge that they made the spikes seen before 2013 barely visible on the above chart. Consequently, the bearish medium-term implications are clearly in place and based on them we could expect another downswing soon, but not necessarily right away. This is in tune with what we concluded based on the analysis of the previous charts.
We indeed didn’t see the downswing right away – neither on Monday, nor Tuesday, nor Wednesday – but we saw it soon after the above was posted – on Friday. Consequently, the ratio of volumes of the GDXJ and SPY worked once again and it remains to be one of the very useful (yet little known) indicators for the precious metals market.
Summing up, the negative price action that we saw on Friday in the precious metals market seems to be a confirmation that we had been waiting to see in order to say that it was very probable that the next big move was about to take place or was already underway. The USD Index can move higher and there are signs suggesting that it will. The breakdown below 2013 low in gold, the breakdown below the support line in mining stocks and the decline in tune with previous patterns in the case of silver all provide bearish implications. Given the above, and other medium-term bearish signals that we commented on in the previous alerts, it seems that the next short-term direction in which the precious metals market will move is down and we think that short positions (full) are now justified from the risk/reward perspective.
As always, we will continue to monitor the situation and report to you – our subscribers – accordingly.
To summarize:
Trading capital (our opinion):
It seems that having speculative (full) short positions in gold, silver and mining stocks is a good idea:
- Gold: stop-loss: $1,193; initial target price: $1,056, stop-loss for the DGLD ETN $77.27; initial target price: $107.21
- Silver: stop-loss: $16.33; initial target price $13.62; stop-loss for the DSLV ETN: $68.77; initial target price for the DSLV ETN: $113.69
- Mining stocks (price levels for the GDX ETF): stop-loss: $19.63; initial target price: $15.32, stop-loss for the DUST ETN $23.90; initial target price for the DUST ETN: $45.14
In case one wants to bet on lower junior mining stocks' prices, here are the stop-loss details and initial target prices:
- GDXJ: stop-loss: $28.12; initial target price: $19.15
- JDST: stop-loss: $13.26; initial target price: $34.96
Long-term capital (our opinion): No positions
Insurance capital (our opinion): Full position
Please note that a full position doesn’t mean using all of the capital for a given trade. You will find details on our thoughts on gold portfolio structuring in the Key Insights section on our website.
As a reminder – “initial target price” means exactly that – an “initial” one, it’s not a price level at which we suggest closing positions. If this becomes the case (like it did in the previous trade) we will refer to these levels as levels of exit orders (exactly as we’ve done previously). Stop-loss levels, however, are naturally not “initial”, but something that, in our opinion, might be entered as an order.
Since it is impossible to synchronize target prices and stop-loss levels for all the ETFs and ETNs with the main markets that we provide these levels for (gold, silver and mining stocks – the GDX ETF), the stop-loss levels and target prices for other ETNs and ETF (among other: UGLD, DGLD, USLV, DSLV, NUGT, DUST, JNUG, JDST) are provided as supplementary, and not as “final”. This means that if a stop-loss or a target level is reached for any of the “additional instruments” (DGLD for instance), but not for the “main instrument” (gold in this case), we will view positions in both gold and DGLD as still open and the stop-loss for DGLD would have to be moved lower. On the other hand, if gold moves to a stop-loss level but DGLD doesn’t, then we will view both positions (in gold and DGLD) as closed. In other words, since it’s not possible to be 100% certain that each related instrument moves to a given level when the underlying instrument does, we can’t provide levels that would be binding. The levels that we do provide are our best estimate of the levels that will correspond to the levels in the underlying assets, but it will be the underlying assets that one will need to focus on regarding the sings pointing to closing a given position or keeping it open. We might adjust the levels in the “additional instruments” without adjusting the levels in the “main instruments”, which will simply mean that we have improved our estimation of these levels, not that we changed our outlook on the markets. We are already working on a tool that would update these levels on a daily basis for the most popular ETFs, ETNs and individual mining stocks.
Our preferred ways to invest in and to trade gold along with the reasoning can be found in the how to buy gold section. Additionally, our preferred ETFs and ETNs can be found in our Gold & Silver ETF Ranking.
As always, we'll keep you - our subscribers - updated should our views on the market change. We will continue to send out Gold & Silver Trading Alerts on each trading day and we will send additional Alerts whenever appropriate.
The trading position presented above is the netted version of positions based on subjective signals (opinion) from your Editor, and the automated tools (SP Indicators and the upcoming self-similarity-based tool).
As a reminder, Gold & Silver Trading Alerts are posted before or on each trading day (we usually post them before the opening bell, but we don't promise doing that each day). If there's anything urgent, we will send you an additional small alert before posting the main one.
=====
Latest Free Trading Alerts:
S&P 500 index remains close to all-time high. There is some uncertainty ahead of a holiday-shortened trading session.
Stock Trading Alert: Stocks Fluctuate Following Recent Move Up – Will Uptrend Extend Even Further?
There was visible downward pressure yesterday. The currency fell and the volume was still significant. Is it possible that we saw a local top on Tuesday?
Bitcoin Trading Alert: Did We Just See a Local Top?
=====
Hand-picked precious-metals-related links:
Swiss Voters Reject Measure Forcing SNB to Acquire More Gold
Gold tumbles after Swiss referendum, oil hits five-year low
=====
In other news:
Fed rattled by elusive inflation, but loath to sound alarm yet
Moody's downgrades Japan as concerns grow
=====
Thank you.
Sincerely,
Przemyslaw Radomski, CFA
Founder, Editor-in-chief
Gold & Silver Trading Alerts
Forex Trading Alerts
Oil Investment Updates
Oil Trading Alerts

