
Briefly: In our opinion no speculative positions in gold, silver and mining stocks are justified from the risk/reward perspective. In other words, we think that closing the short positions and taking profits off the table is appropriate at this time.
What a difference one day can make! Gold, silver and mining stocks didn’t move much on Friday (if we focus on the daily closing prices), and the same is the case for the USD Index, but the “little” things that happened between them and the weekly closes make this session very significant. Let’s take a closer look (charts courtesy of http://stockcharts.com.)
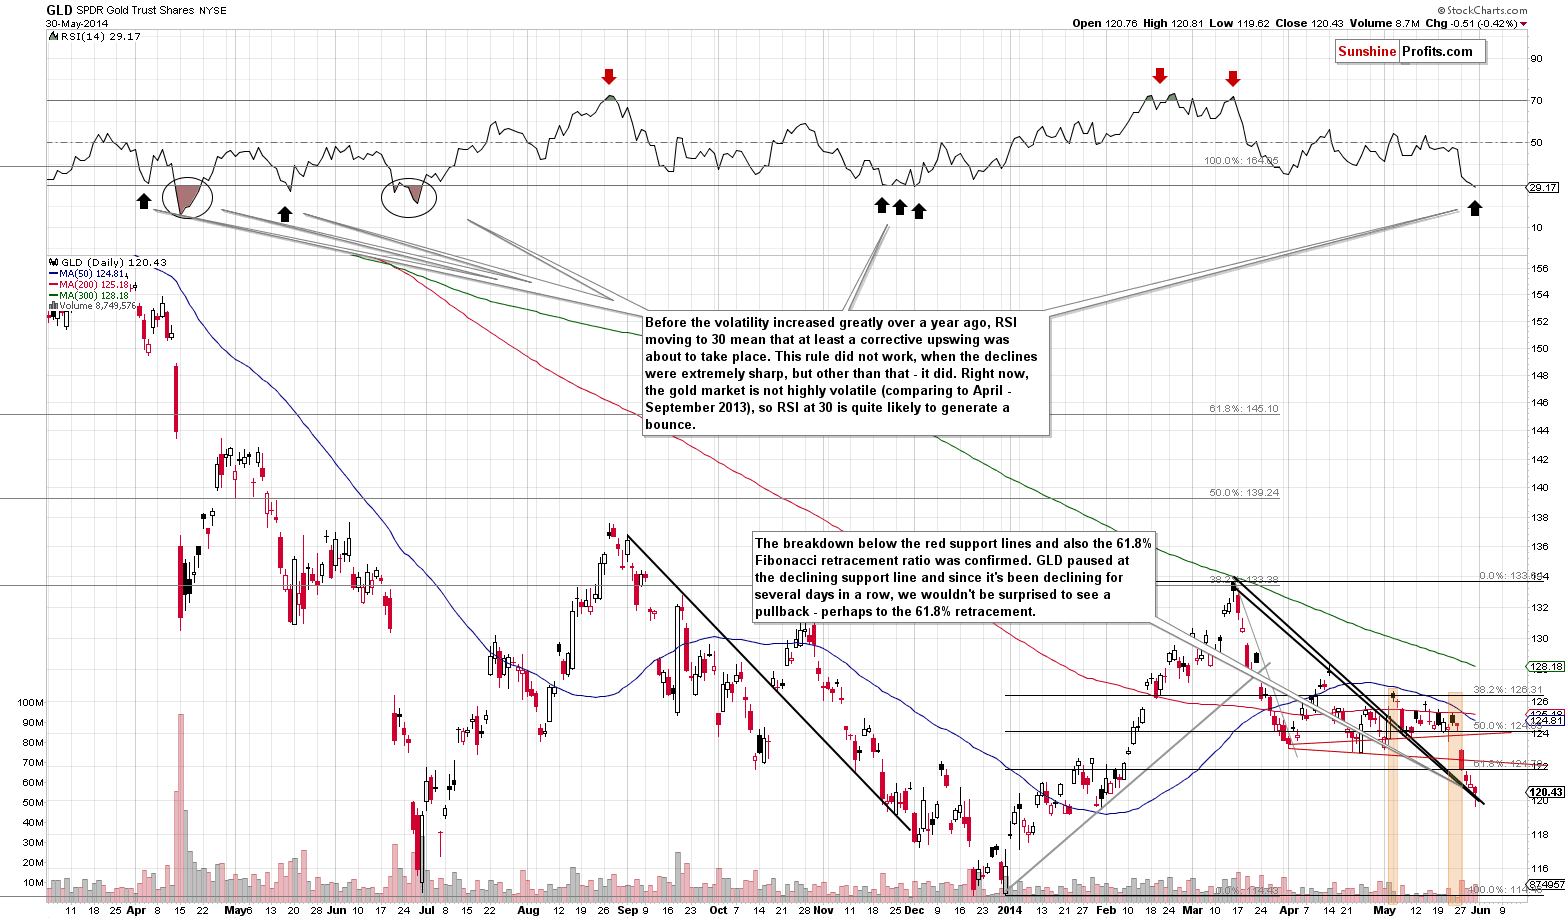
The GLD ETF moved to its declining support line, and managed to move back up before the end of the session – not the entire decline was erased, but still, we saw a sign of short-term strength.
The RSI indicator flashed a buy signal for the first time in many months by moving to the 30 level. This signal had worked well when there was no significant volatility in the gold market – which means that it’s likely to work now. The way it worked in the past was that we saw some short-term strength, either in the form of a rally, or a pause within the decline. Right now we have gold after a breakdown below support lines and below the 61.8% Fibonacci retracement level, so we have good reasons to believe that the decline will continue, but at the same time we are quite likely to see a correction up to the previously broken level – either the 61.8% retracement or the support/resistance lines.
Once the pause has played out, we still expect gold to move to $1,200 initially, and then to new lows – perhaps to $1,000 or so. As far as timing is concerned, in our opinion the odds are (based on the data available today) that the move lower will take place within the next several months and that we will see the final bottom for this lengthy decline this year.
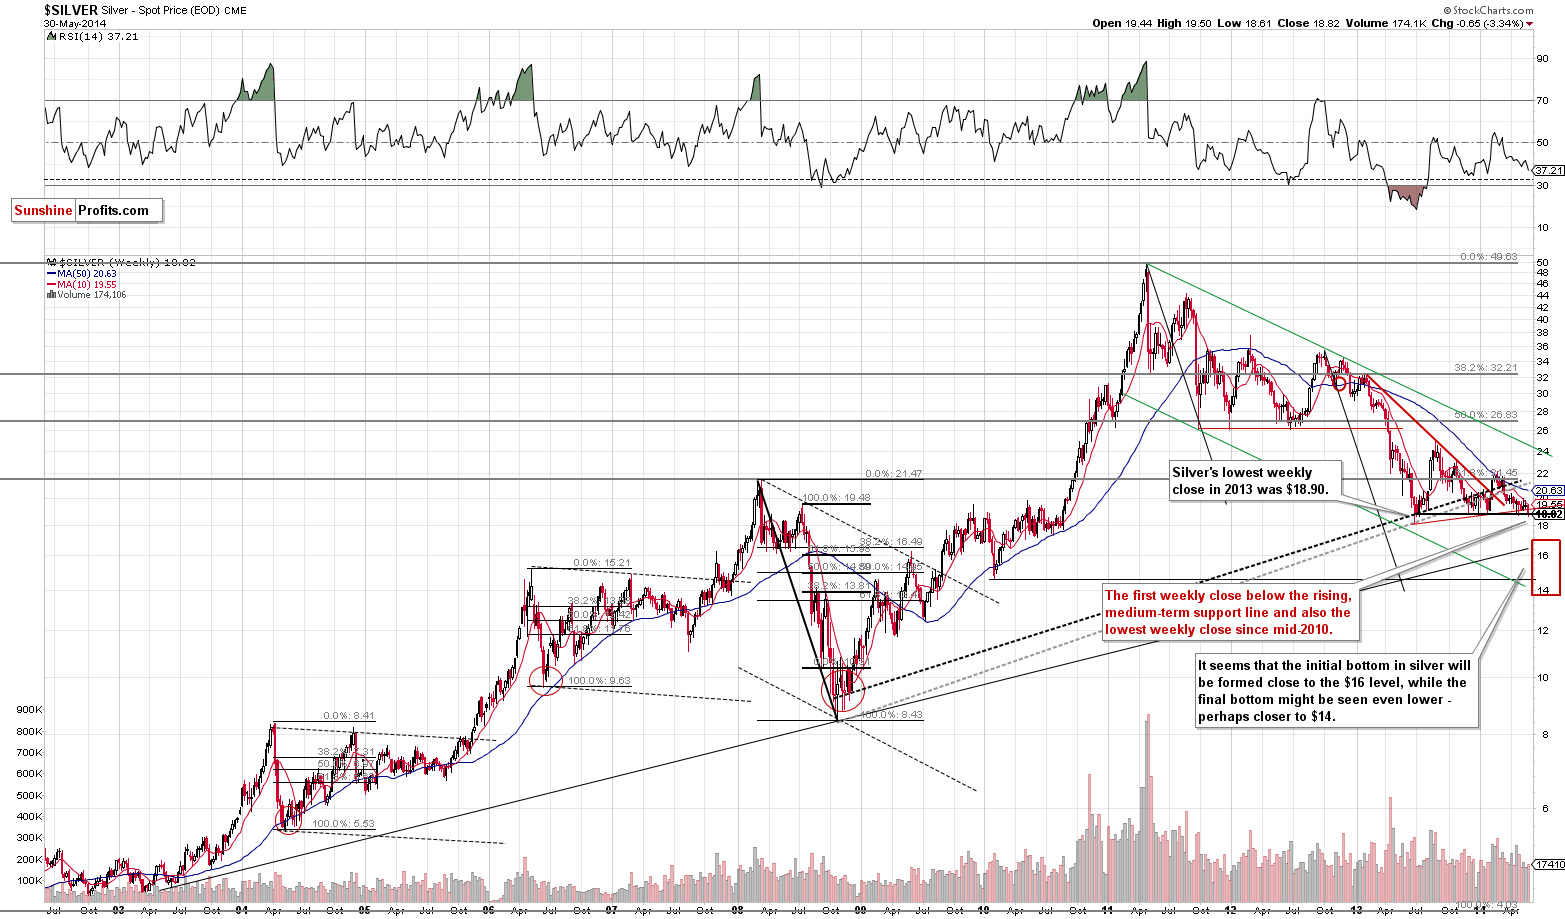
Friday’s session was very specific in the case of silver, because it was bullish and bearish at the same time. It was bearish because from the long-term perspective we saw an important breakdown. Silver closed 8 cents below the lowest weekly close of 2013 – not a clear, major breakdown, but still. It also closed below the support line created by connecting the 2013 lows. This is also a bearish piece of information. The important thing to keep in mind is that while the implications are bearish, they are medium-term in nature – we don’t have to see a move lower immediately. We are just likely to see it soon – perhaps within a week or two.
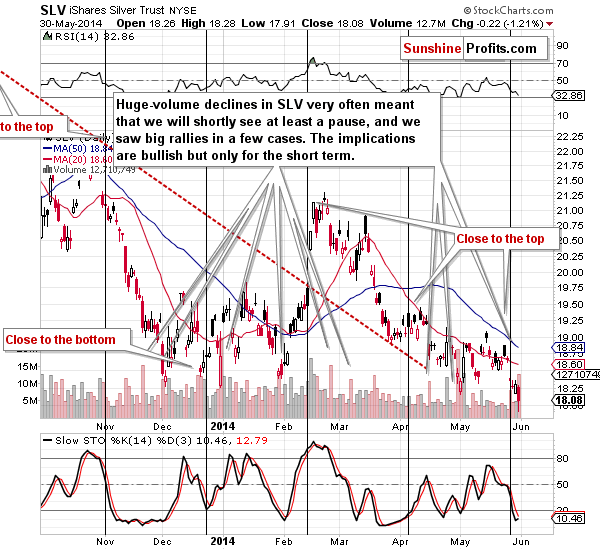
However, on a short-term basis, Friday’s decline and reversal that took place on huge volume have bullish implications. It was very often the case that after such sessions, silver moved higher, either very temporarily, or it started a more visible rally. Either way, the short-term implications are bullish.
What about mining stocks?
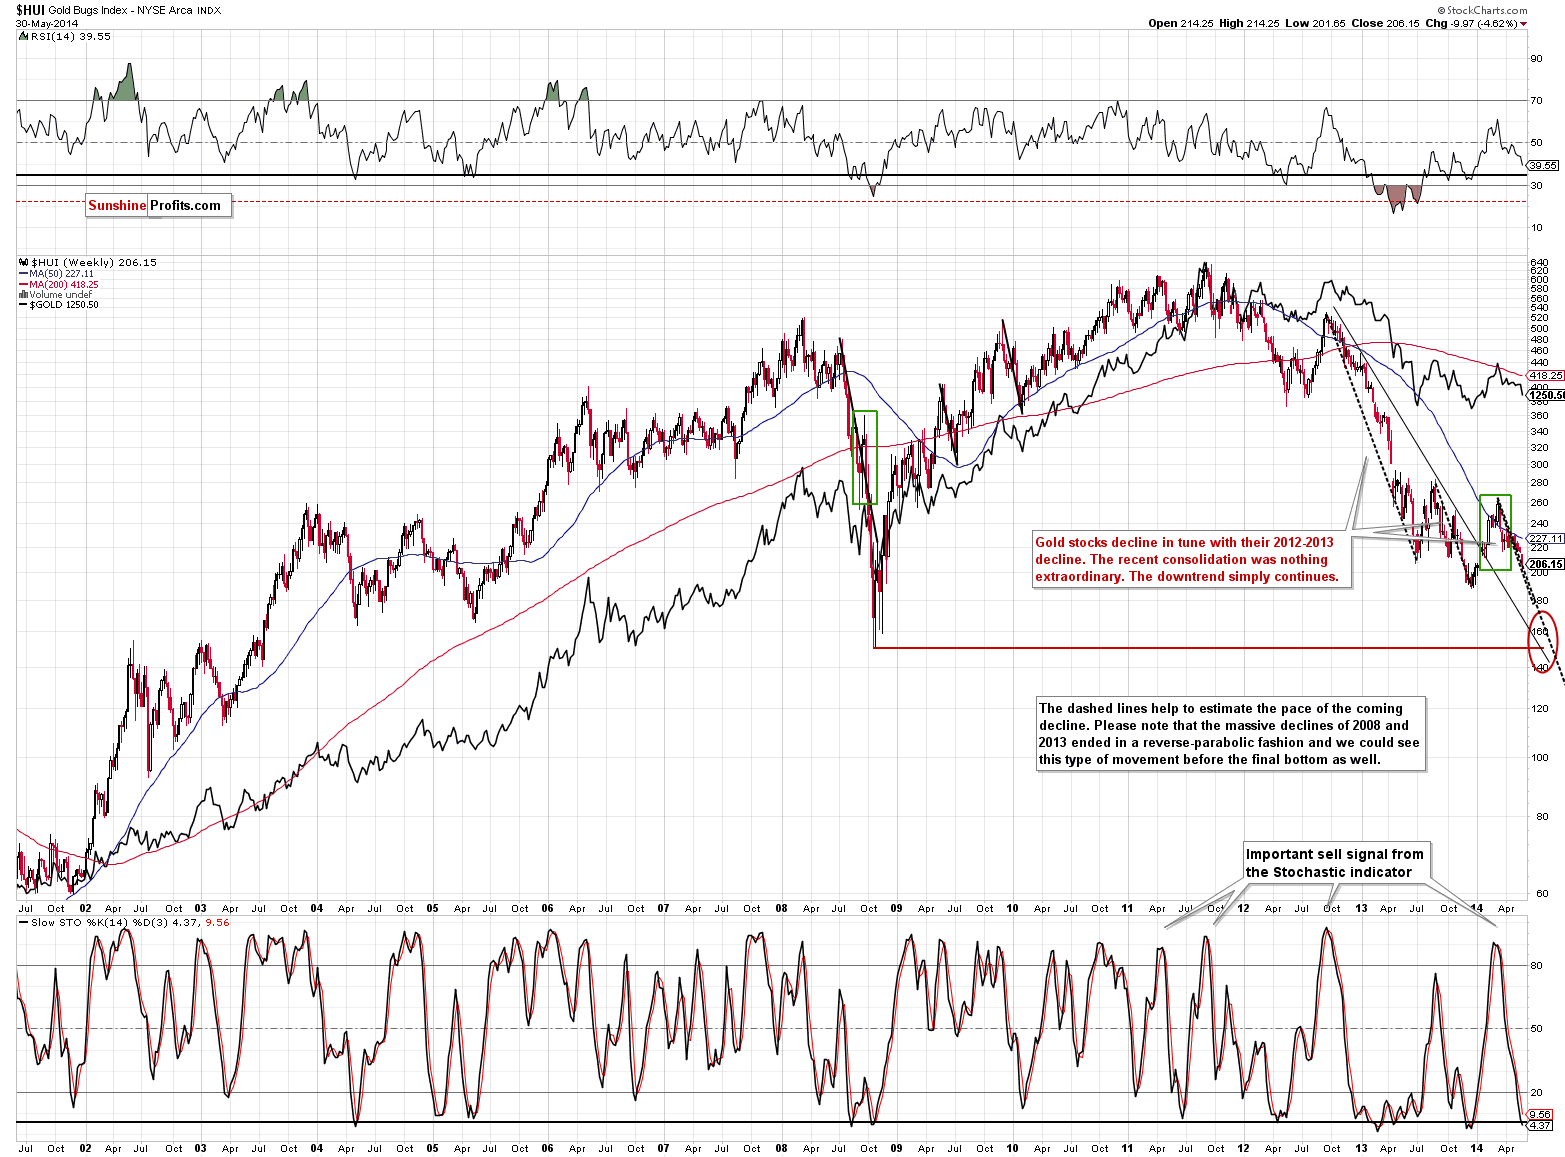
From the medium-term perspective, the decline simply continues at the expected pace. A short-term upswing would not invalidate it, and the same goes for the lack of a corrective upswing. The long-term chart simply doesn’t tell us if the short-term move up is likely to happen or not. It just suggests that the decline is not completely over just yet.
Why not? We have recently received a question (thank you) about the expected length of the decline. Specifically, we were asked why we didn’t think the decline would end sooner – say at 190 in the HUI Index. There are several reasons:
- Mining stocks are not showing strength in the long- and medium-term yet (thus, the final bottom is likely not behind us / close)
- There has been no extreme underperformance of silver (relative to gold) and that’s something that we expect to see as a confirmation that the bottom in the entire precious metals sector is in
- The size of the move preceding a consolidation is often quite similar to the one that follows the consolidation. On the above chart you can see that the late-2012 – mid-2013 decline is much smaller than the decline that started in March 2014. Now, a complete similarity would mean the HUI Index moving well below the 2008 low, but we think it might be an exaggeration to project a move this big, given that the 2008 low provides very strong support. That’s why we’re not projecting it to be even lower.
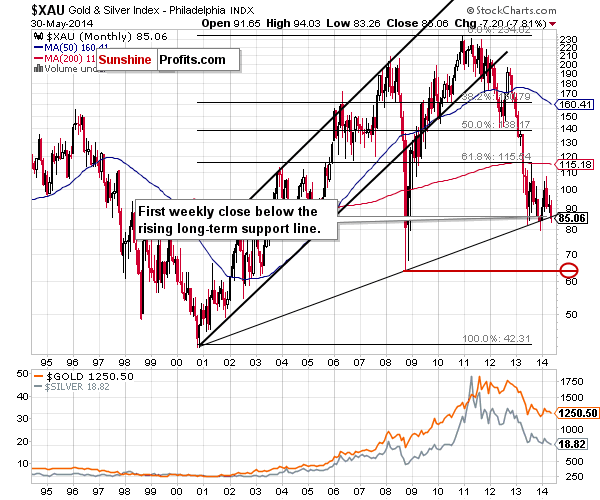
- The XAU Index, which will very probably bottom at the same time as the HUI Index (after all, they are very similar in nature, as they are both proxies for the mining stocks sector) and the technical situation in the XAU are quite clear from the long-term perspective. Once the rising, long-term support is broken (and it was just broken, but the breakdown is not confirmed), the next support is at the previous low (again, too close for the decline to be over in our view) and the next one is all the way down at the 2008 low as well. The two pictures seem to confirm each other. This reasoning is weaker than the other points mentioned as it could be the case that the two indices bottom at the 2013 lows, but again, based on the size of the preceding downswing, it’s not likely to happen.
- Gold, and the rest of the precious metals sector is not extremely hated in the public media – when prices drop low enough the mainstream media will display headlines like “gold is over”, “gold – just how safe a $200 can be?”, “gold – the worst performing asset of the year” and so on. This will probably convince the final part of investors to sell… And that’s when the final bottom will form.
- We have not seen major support levels being reached in several precious-metals-related ratios. Say, the HUI:gold ratio moved quite close to its major (!) 2000 low in the late 2013, but not right to it.
On a short-term basis, mining stocks (GDX ETF) have shown strength but refused to follow gold lower and this phenomenon has been in place for 2 days now.
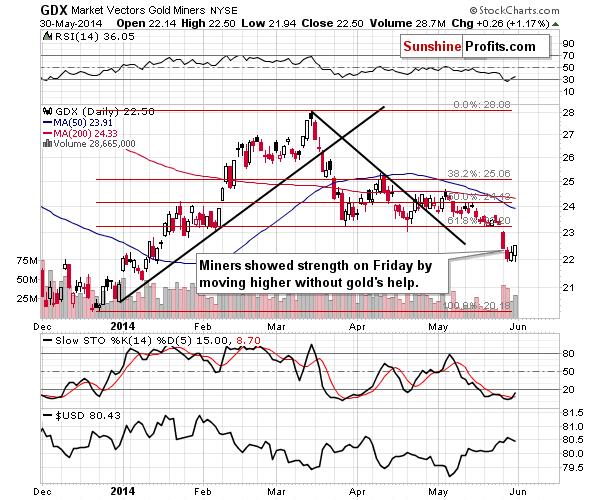
The breakdown in the GDX ETF below the previous lows and the 61.8% Fibonacci retracement level was strong and miners dropped quite far. Perhaps too far for just 2 trading days, so the corrective upswing that we saw on Thursday and Friday is not that odd. It doesn’t have to be a sign of strength (as the previous move lower was so sharp), but it could be. Overall, the short-term picture for the GDX ETF looks unclear.
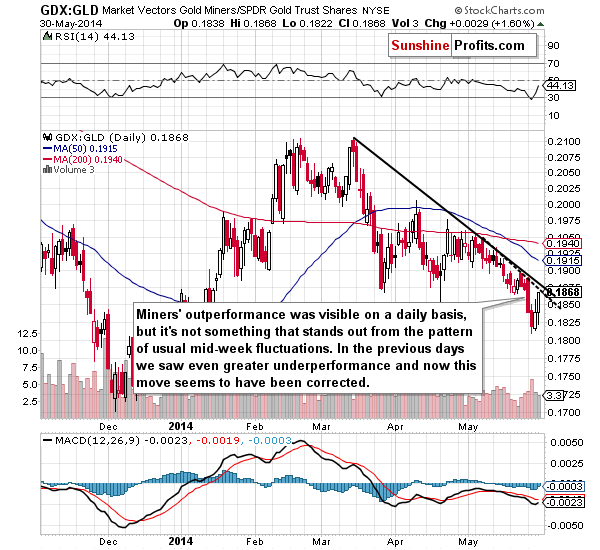
Speaking of the mining stocks performance relative to gold – the move higher in the GDX to GLD ratio was significant on a short-term basis, but it hasn’t done anything to change the current trend, which remains down. In fact, even the very short-term resistance line (dashed line based on May highs) has not been touched, let alone broken. At the same time, the rally was enough to move the RSI indicator much above the 30 level. Some sort of upswing was likely based on it, but perhaps it had already been seen.
Consequently, the miners’ strong performance relative to gold doesn’t have to be viewed as a bullish sign. Precisely, it’s more bullish than not on a short-term basis, but without bullish implications for the medium and long term.
Speaking of the medium and long term, we saw a major signal based on the last week in case of the junior sector.
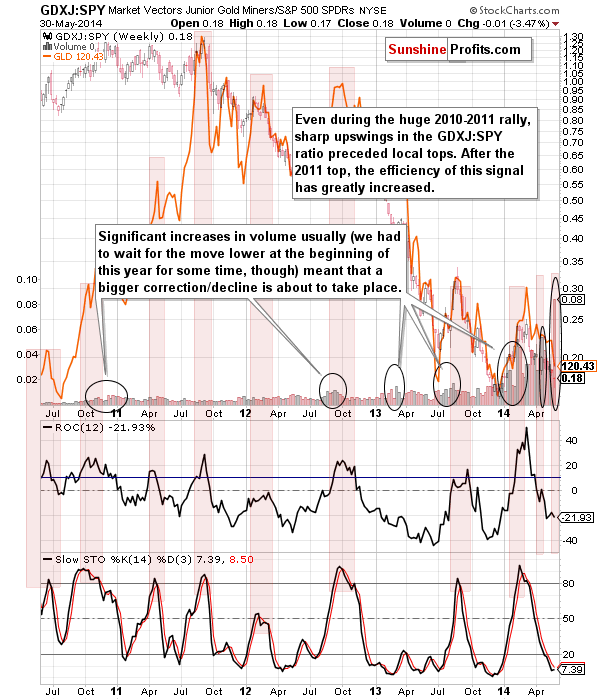
To be more precise, we saw a signal from the ratio of juniors and the general stock market. To be even more precise, we saw the signal from the ratio of their volumes. Whenever the volume on which the juniors move is much higher than the volume for the stock market it means that some kind of move lower is likely to be seen within the next week or a few of them. It’s not a very short-term sign, but it’s quite reliable.
Last week we saw a record ratio of weekly volume levels and it suggests that we should prepare ourselves for a bigger move lower. We are prepared as we remain out of the market with the long-term investment capital.
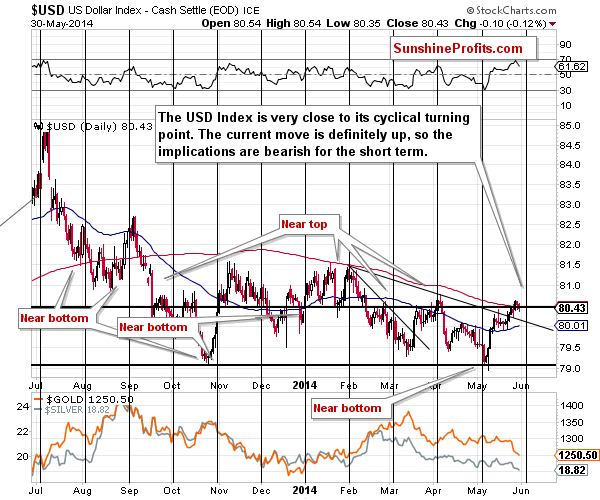
Finally, let’s take a look at what happened on the USD Index chart. There was no significant price move, but the important thing here is that the dollar is now closer – in fact, very close - to the cyclical turning point at that it hasn’t declined recently. This means that the most recent price move before the turning point is up, and thus that the turning point has bearish implications. Consequently, we might see some kind of reversal and a pullback in the coming days – perhaps to the 80 level or so. The implications for the precious metals market are bullish for the short term but bearish for the medium term, as the USD Index is already after a breakout and once the correction is over it’s likely to continue its upward march.
Summing up, the medium-term trend in the precious metals remains down, however, there are signs that suggest that will we will see a short-term correction to the upside. Consequently, it seems that cashing out of our profitable short positions in gold, silver, and mining stocks is a good idea. We will monitor the market for an opportunity to re-enter the short positions – please be prepared to re-enter them shortly (perhaps as early as this week). The upswing will likely be a small one, so we don’t suggest making any changes in case of the long-term investment part of the portfolio (no positions).
To summarize:
Trading capital (our opinion): No positions
Long-term capital: No positions
Insurance capital: Full position
| Portfolio's Part | Position | Stop-loss / Expiry Date |
|---|---|---|
| Trading: Mining stocks | None | - |
| Trading: Gold | None | - |
| Trading: Silver | None | - |
| Long-term investments: Gold | None | - |
| Long-term investments: Silver | None | - |
| Long-term investments: Platinum | None | - |
| Long-term investments: Mining Stocks | None | - |
Please note that a full position doesn’t mean using all of the capital for a given trade. You will find details on our thoughts on gold portfolio structuring in the Key Insights section on our website.
As always, we'll keep you - our subscribers - updated should our views on the market change. We will continue to send out Gold & Silver Trading Alerts on each trading day and we will send additional Alerts whenever appropriate.
The trading position presented above is the netted version of positions based on subjective signals (opinion) from your Editor, and the automated tools (SP Indicators and the upcoming self-similarity-based tool).
As a reminder, Gold & Silver Trading Alerts are posted before or on each trading day (we usually post them before the opening bell, but we don't promise doing that each day). If there's anything urgent, we will send you an additional small alert before posting the main one.
Thank you.
Sincerely,
Przemyslaw Radomski, CFA
Founder, Editor-in-chief
Gold & Silver Trading Alerts
Forex Trading Alerts
Oil Investment Updates
Oil Trading Alerts

