
Briefly: In our opinion no speculative short positions in gold, silver and mining stocks are currently justified from the risk/reward perspective.
Not much happened in the precious metals market yesterday, but the session was more interesting in the case of the currency market. Since the moves in the USD Index are something that can greatly influence the moves in gold and the rest of the precious metals sector, monitoring changes in the index could be just as important as monitoring the precious metals market itself. In today’s alert we’ll comment on changes in both of them.
Since basically nothing changed in the case of silver and mining stocks yesterday, in today’s alert we’ll focus on the analysis of gold and the USD Index along with 2 gold ratios.
Let’s start with the USD Index (charts courtesy of http://stockcharts.com).
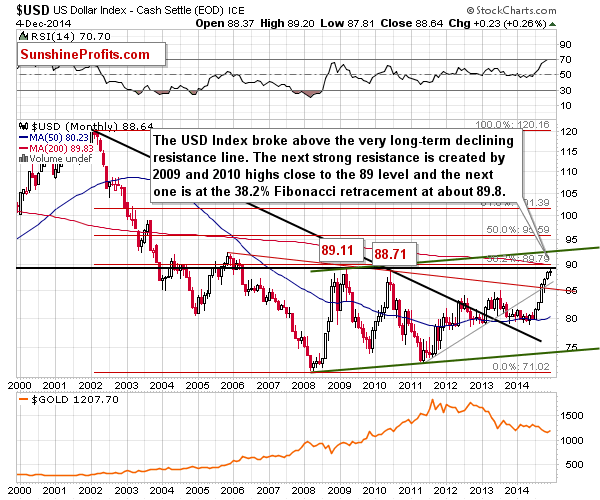
The long-term picture is the key thing to keep in mind at this time, as it is the long-term resistance level that was just reached. This week, the USD Index moved above both the 2010 high and the 2009 high, which means that there are good reasons for the index to decline sooner rather than later. We saw a decline just yesterday, but at this time it’s not completely clear that the top is already in. We could still see a move to the 38.2% Fibonacci retracement level based on the entire 2002 – 2008 decline. This means that we are likely to see a corrective downswing relatively soon, but not necessarily right away.
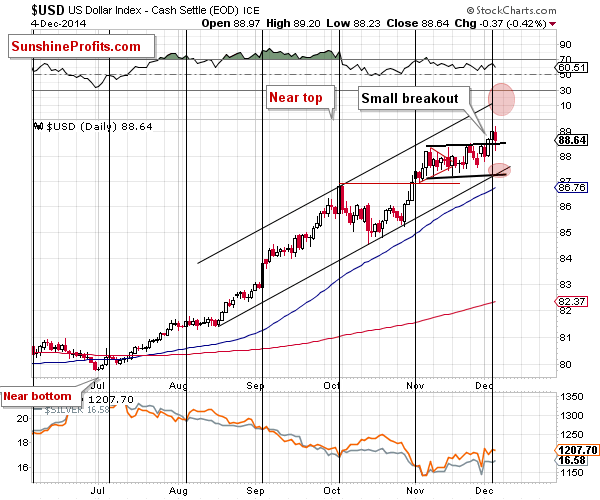
The reason for which we think that the short-term rally might not be over yet is that we have just seen a confirmation of the breakout from the flag pattern. The USD Index closed for a third consecutive day above the upper border of the pattern, which means that the move higher has just become much more probable. Please note that the cyclical turning point has indeed generated a short-term (a daily one so far) decline, but overall the USD closed above the flag pattern. Consequently (given the 3rd close and the ability to hold above the pattern even taking into account the bearish influence of the turning point), the breakout seems to be verified.
Yesterday, we wrote the following:
Overall, it still seems likely that we will see high volatility, but (unfortunately, there’s not much that can be done about it) it’s not clear which short-term direction is more likely. If we see a continuation of the rally here, then we will likely see a corrective downswing sooner, and if the USD Index corrects to 87 or so before moving higher, then the corrective downswing (from the long-term resistance line) will be seen later on, but not much later.
At this time, it seems that the scenario in which the USD Index moves even higher in the short run is more probable.
The key question is how gold will react to such a move.
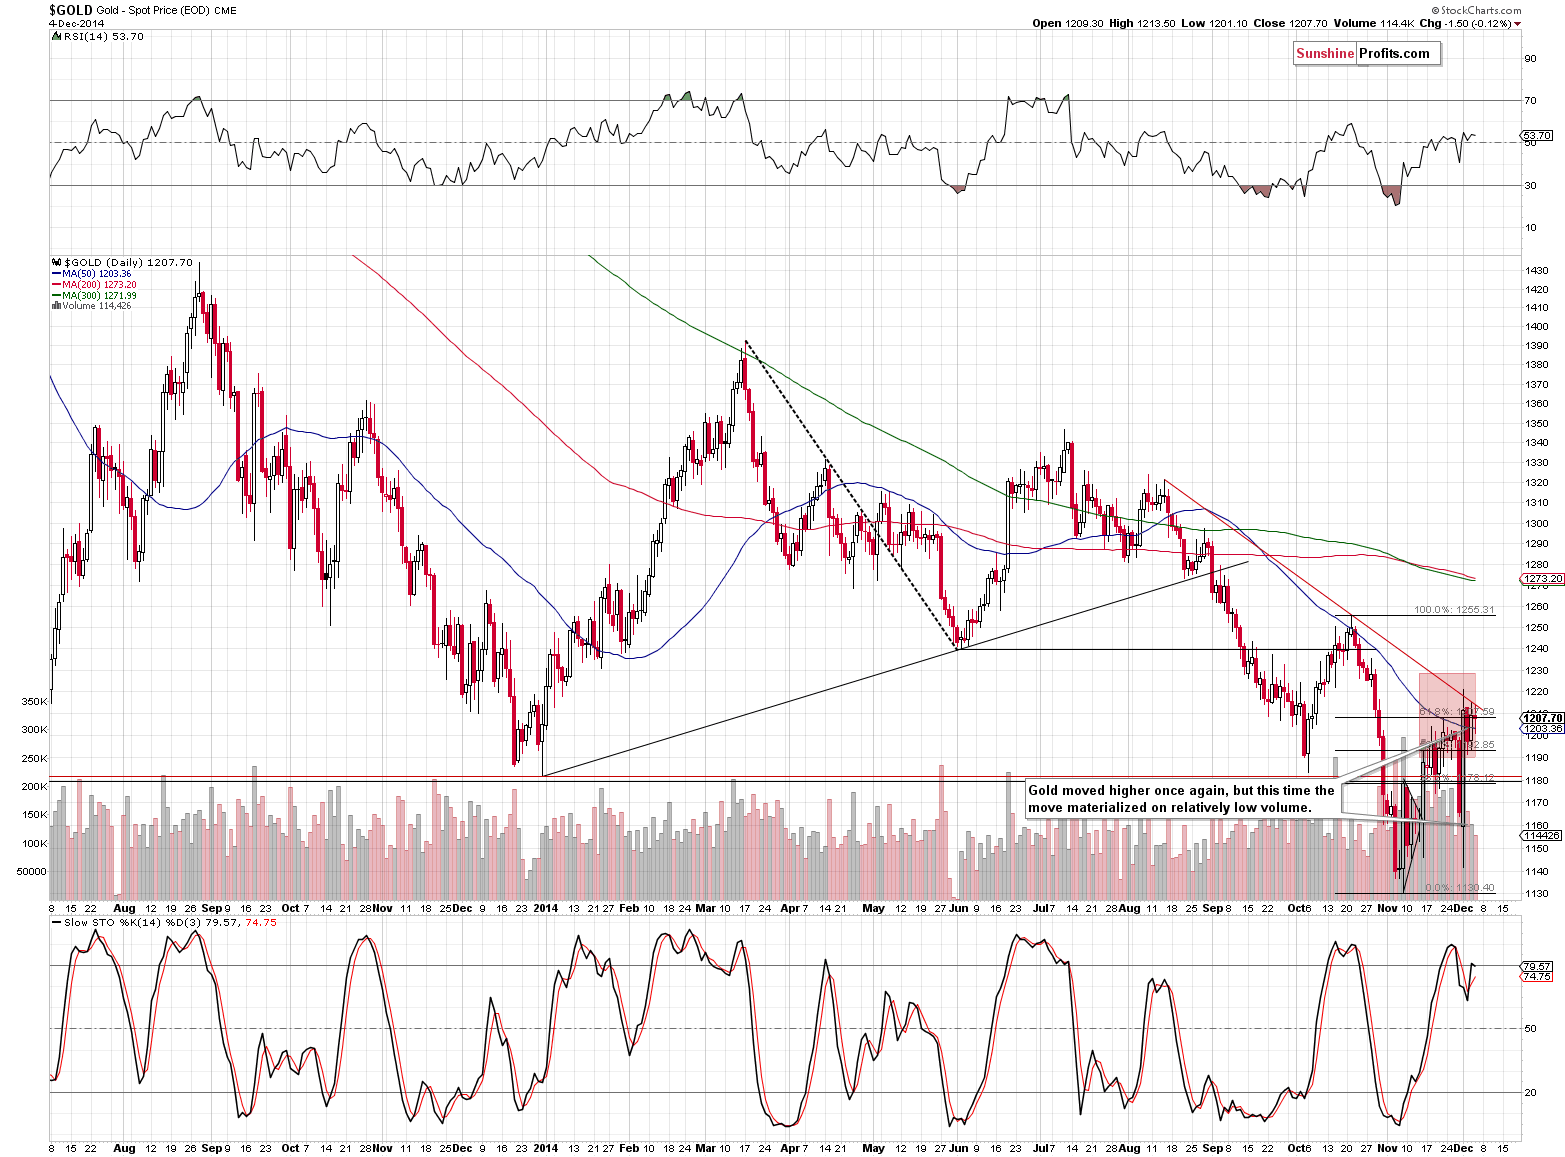
Gold remains at the combination of 2 resistance levels: we see intra-day moves to the declining resistance line and closing prices at the 61.8% Fibonacci retracement level. Without a breakdown, the trend remains down and the next move is likely to be to the downside.
However, if the USD Index rallies and the decline in gold is shallow (or nonexistent), the odds will be that a breakout and a more sizable move (say, to $1,250 or so) will be to the upside. At this time – before we see gold’s reaction to the dollar’s move higher – the situation is too unclear to say that one short-term direction is more probable than the other. From the medium-term perspective, the trend remains down (and the savings made by staying on the sidelines with one’s long-term investment capital in the previous months are likely to become even bigger in the coming weeks or months), but as far as the next very short-term move is concerned, the outlook is unclear at this time.
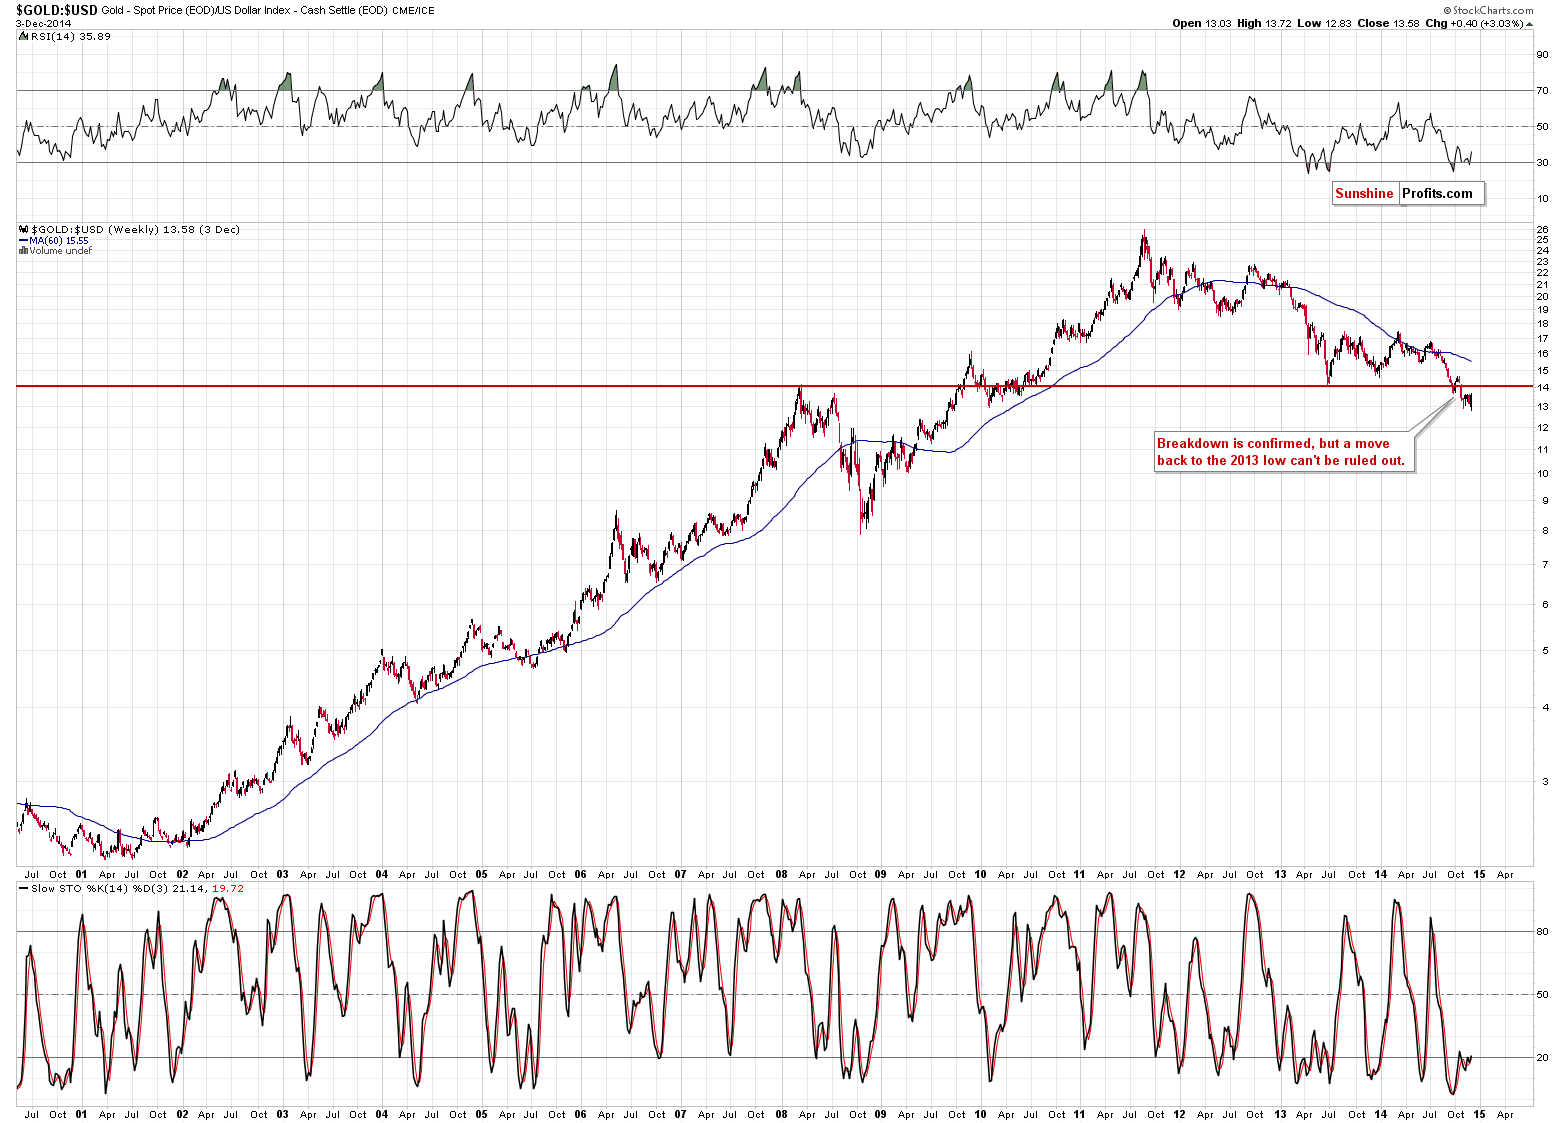
The gold to USD Index ratio still points to the possibility of a short-term upswing and it still implies that such an upswing would not have meaningful bullish implications for the medium term as long as it doesn’t take the ratio back above the 2008 high and 2013 low.
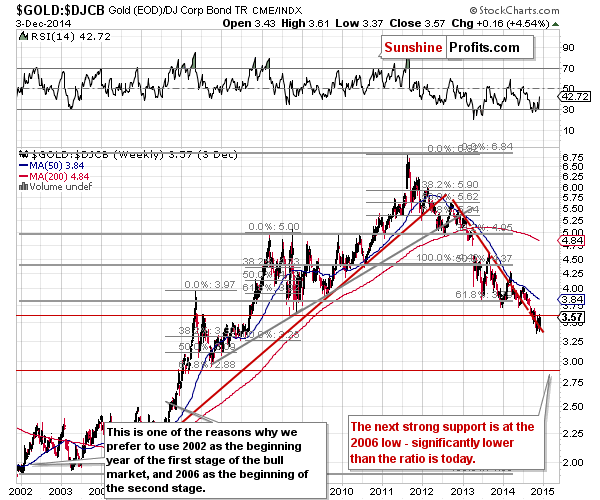
Moreover, the gold to bonds ratio continues to confirm that the main trend is indeed down. This ratio generally does a good job in filtering out the short-term price swings, which helps to determine the medium- and long-term trends. At this time, the implications are bearish for the ratio and for gold itself.
Summing up, the medium-term outlook for gold remains bearish, but we have indications that the next short-term move might be up. At this time, however, the indications are not very strong (there was not breakout in gold and silver and mining stocks are at their rising support line and are vulnerable to a breakdown) and there are also signs pointing to lower prices in the short term (the miners’ recent underperformance).
We will be looking for confirmations of both the bullish and bearish case for the short term and when one of them becomes much more likely we will let you – our subscribers – know. One of the things that could change is that miners could start to outperform gold again, or we could see gold starting to react to the dollar’s strength once again. There could also be other signs, but it’s not possible to list all of them here. Overall, it seems that the next short-term move in the precious metals sector will be to the upside, but, in our opinion, it’s not likely enough to justify opening a speculative long position from the risk/reward perspective. We’ll keep you informed.
To summarize:
Trading capital (our opinion): No positions
Long-term capital (our opinion): No positions
Insurance capital (our opinion): Full position
Please note that a full position doesn’t mean using all of the capital for a given trade. You will find details on our thoughts on gold portfolio structuring in the Key Insights section on our website.
As a reminder – “initial target price” means exactly that – an “initial” one, it’s not a price level at which we suggest closing positions. If this becomes the case (like it did in the previous trade) we will refer to these levels as levels of exit orders (exactly as we’ve done previously). Stop-loss levels, however, are naturally not “initial”, but something that, in our opinion, might be entered as an order.
Since it is impossible to synchronize target prices and stop-loss levels for all the ETFs and ETNs with the main markets that we provide these levels for (gold, silver and mining stocks – the GDX ETF), the stop-loss levels and target prices for other ETNs and ETF (among other: UGLD, DGLD, USLV, DSLV, NUGT, DUST, JNUG, JDST) are provided as supplementary, and not as “final”. This means that if a stop-loss or a target level is reached for any of the “additional instruments” (DGLD for instance), but not for the “main instrument” (gold in this case), we will view positions in both gold and DGLD as still open and the stop-loss for DGLD would have to be moved lower. On the other hand, if gold moves to a stop-loss level but DGLD doesn’t, then we will view both positions (in gold and DGLD) as closed. In other words, since it’s not possible to be 100% certain that each related instrument moves to a given level when the underlying instrument does, we can’t provide levels that would be binding. The levels that we do provide are our best estimate of the levels that will correspond to the levels in the underlying assets, but it will be the underlying assets that one will need to focus on regarding the sings pointing to closing a given position or keeping it open. We might adjust the levels in the “additional instruments” without adjusting the levels in the “main instruments”, which will simply mean that we have improved our estimation of these levels, not that we changed our outlook on the markets. We are already working on a tool that would update these levels on a daily basis for the most popular ETFs, ETNs and individual mining stocks.
Our preferred ways to invest in and to trade gold along with the reasoning can be found in the how to buy gold section. Additionally, our preferred ETFs and ETNs can be found in our Gold & Silver ETF Ranking.
As always, we'll keep you - our subscribers - updated should our views on the market change. We will continue to send out Gold & Silver Trading Alerts on each trading day and we will send additional Alerts whenever appropriate.
The trading position presented above is the netted version of positions based on subjective signals (opinion) from your Editor, and the automated tools (SP Indicators and the upcoming self-similarity-based tool).
As a reminder, Gold & Silver Trading Alerts are posted before or on each trading day (we usually post them before the opening bell, but we don't promise doing that each day). If there's anything urgent, we will send you an additional small alert before posting the main one.
=====
Latest Free Trading Alerts:
S&P 500 index reached new all-time high yesterday. Will uptrend continue despite some overbought conditions?
Stock Trading Alert: New Record High As Stocks Slightly Extended Their Uptrend
=====
Hand-picked precious-metals-related links:
Russia Might Implement Gold Standard to Boost Economy: Expert
Jim Grant is (still) bullish on Russia, gold and private equity
China’s central bank drafts plans to open up gold trade
Credit Suisse sells $24m of notes linked to gold miners
Is Indian gold turnaround a game changer for prices?
=====
In other news:
Roubini: We're in an asset bubble and it won't pop until 2016
=====
Thank you.
Sincerely,
Przemyslaw Radomski, CFA
Founder, Editor-in-chief
Gold & Silver Trading Alerts
Forex Trading Alerts
Oil Investment Updates
Oil Trading Alerts

