
In short: In our opinion, no positions are currently justified from the risk/reward perspective.
We’ll begin today’s alert with the analysis of two markets that changed the most yesterday. Surprisingly, we don’t mean gold charts (charts courtesy of http://stockcharts.com.)
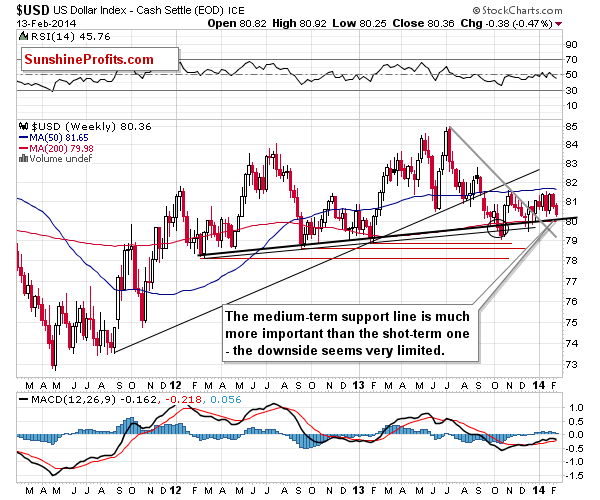
The USD index declined strongly in the first part of yesterday’s session. This move was rather unlikely because of the short-term breakout from the falling wedge pattern. Still, it happened and we need to take the information that the market gives us instead of telling it what to do. The dollar declined to the January 2014 low and moved very close to the rising medium-term support line. If the USD is to move even lower soon, then it’s likely to at least correct to the upside shortly.
However, since we are after a long-term breakout, a move higher is to be expected.
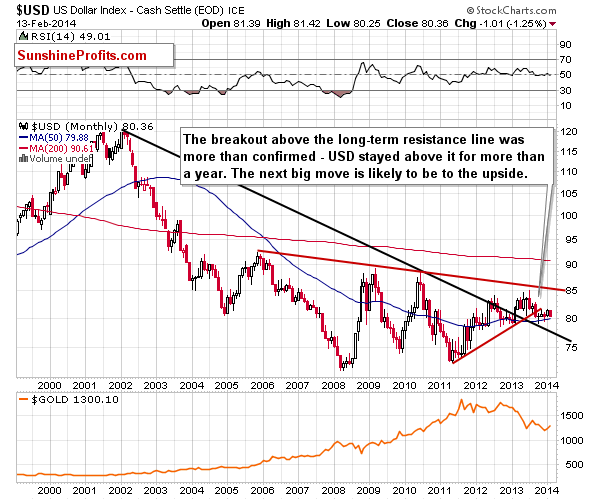
It’s been over a year now since the USD Index broke above the long-term resistance line, which is now support. The index is therefore likely to move much higher, probably to the 85 level. The last time we saw a rally of similar magnitude was in the first half of 2013, which is also when the precious metals sector plunged.
On the previous chart, we see that the rally could begin shortly and on the above chart we see that when it really starts, it can be quite significant.
The impact on the precious metals market is likely to be major and negative, unless metals and miners prove – and do so for more than a week or two – that they can rally along with the dollar’s upswing (like it was the case in early 2010).
The second chart that includes an important change is the one featuring the SLV ETF.
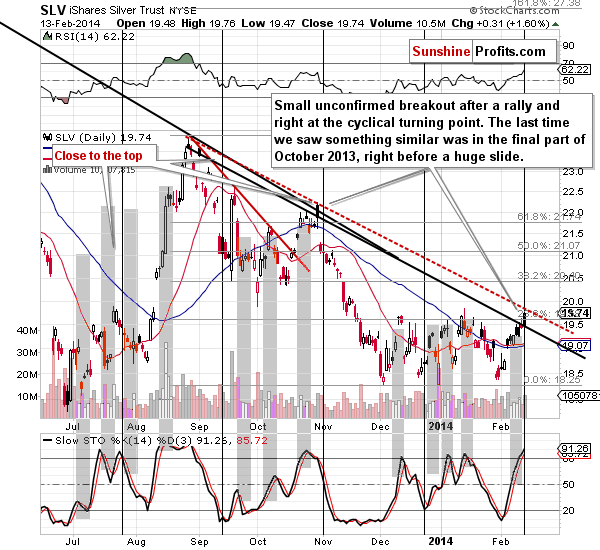
Silver moved higher, above the declining short-term support line based on the daily closing prices but didn’t move above the one based on intra-day highs. However, this is not the most important issue at this time. The key thing here is the fact that silver moved consequently higher this month and is now right at the cyclical turning point.
The last time that silver was close to the turning point, it was after a short-term decline and rallied, and the previous 3 cases were followed by visible moves as well – silver moved in the opposite way to the previous short-term trend. In July it declined (it rallied a week thereafter, but declined right after the turning point), in September it rallied (helped by the comments from the Fed) and in late October silver started a major decline right after the turning point.
Out of these 4 cases, the late October one is most similar to what we see today. Silver was rallying for about 2 weeks with a small consolidation within the rally. It moved above moving averages and was looking like it was about to take off, but it reversed right after the turning point and declined well below the previous low.
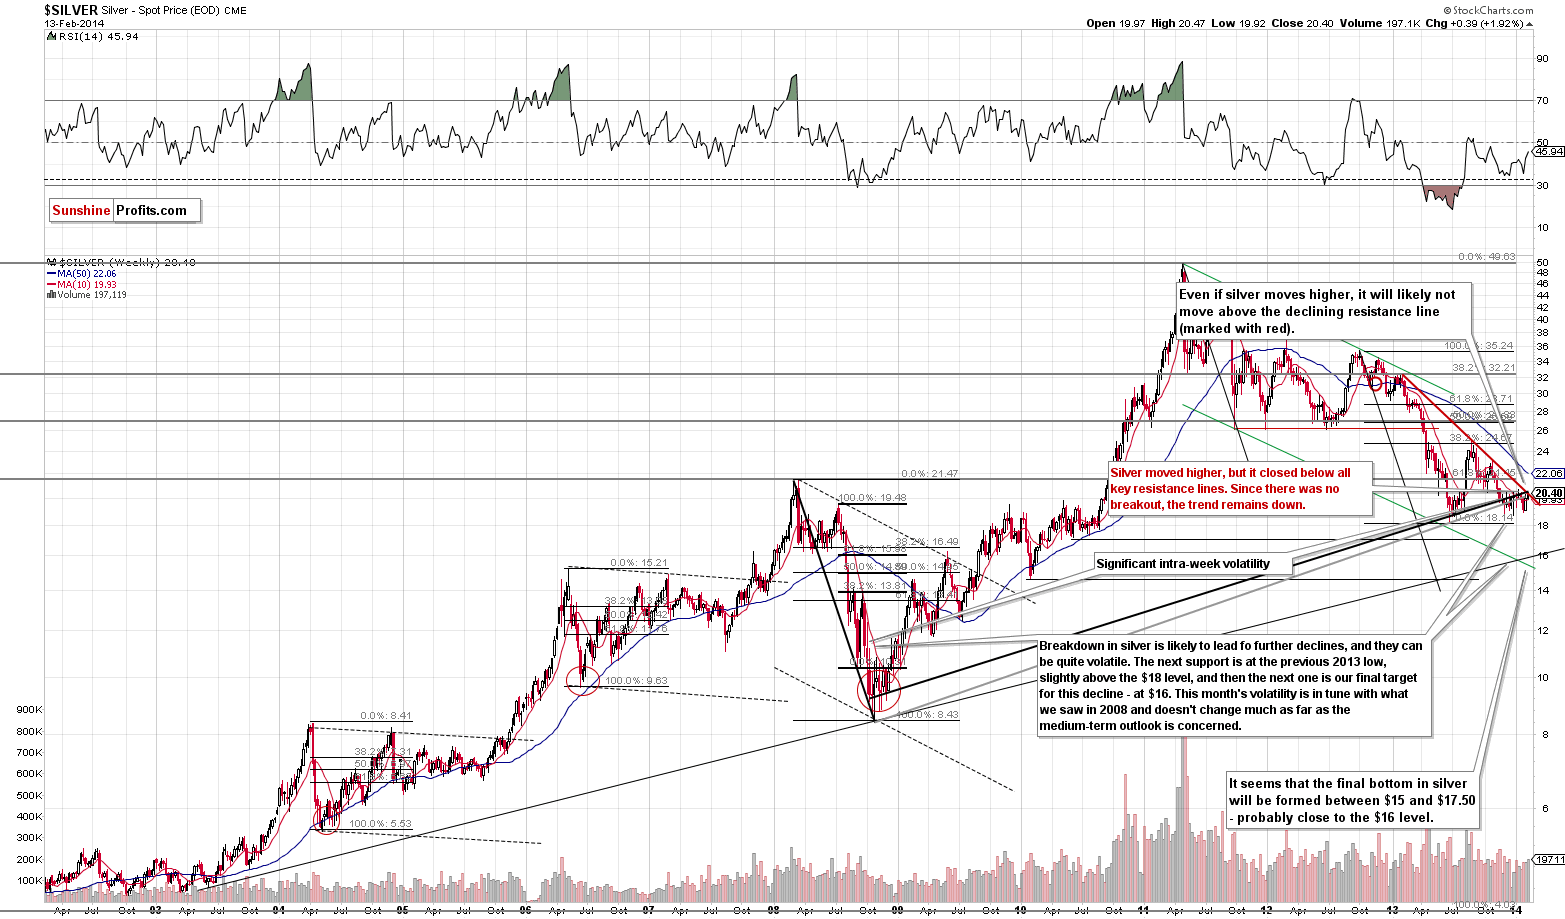
From the long-term perspective, there was no breakout and consequently, the trend remains down.
Silver is at the long-term resistance line, the white metal moved above only one of the short-term ones and it is right at the cyclical turning point after a rally – it’s simply a very bearish combination.
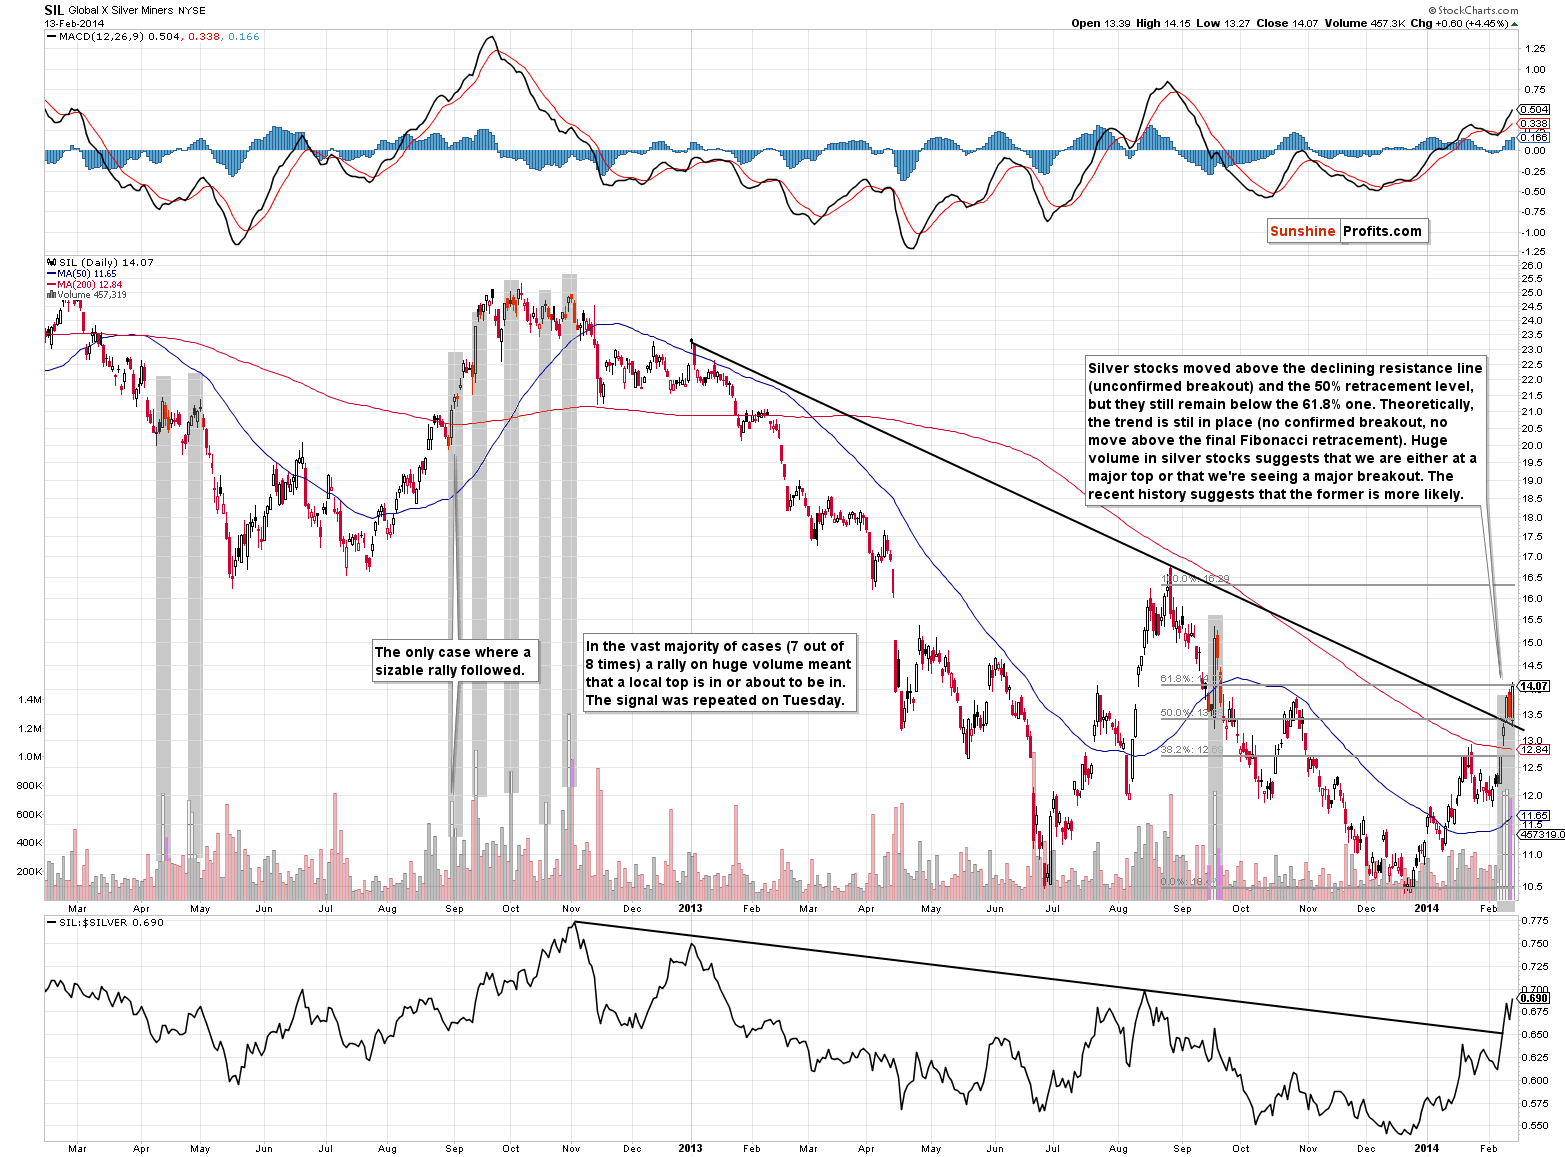
Silver stocks moved to the 61.8% Fibonacci retracement level without a breakout. Silver miners continue to trade on huge volume, which suggests that we are at a critical time in the sector (and we are). However, in the vast majority of cases huge volume in silver stocks meant that a local top was either in or about to be seen, so it’s not as bullish as it seems at the first sight.
Meanwhile, we have mining stocks after a visible breakout.
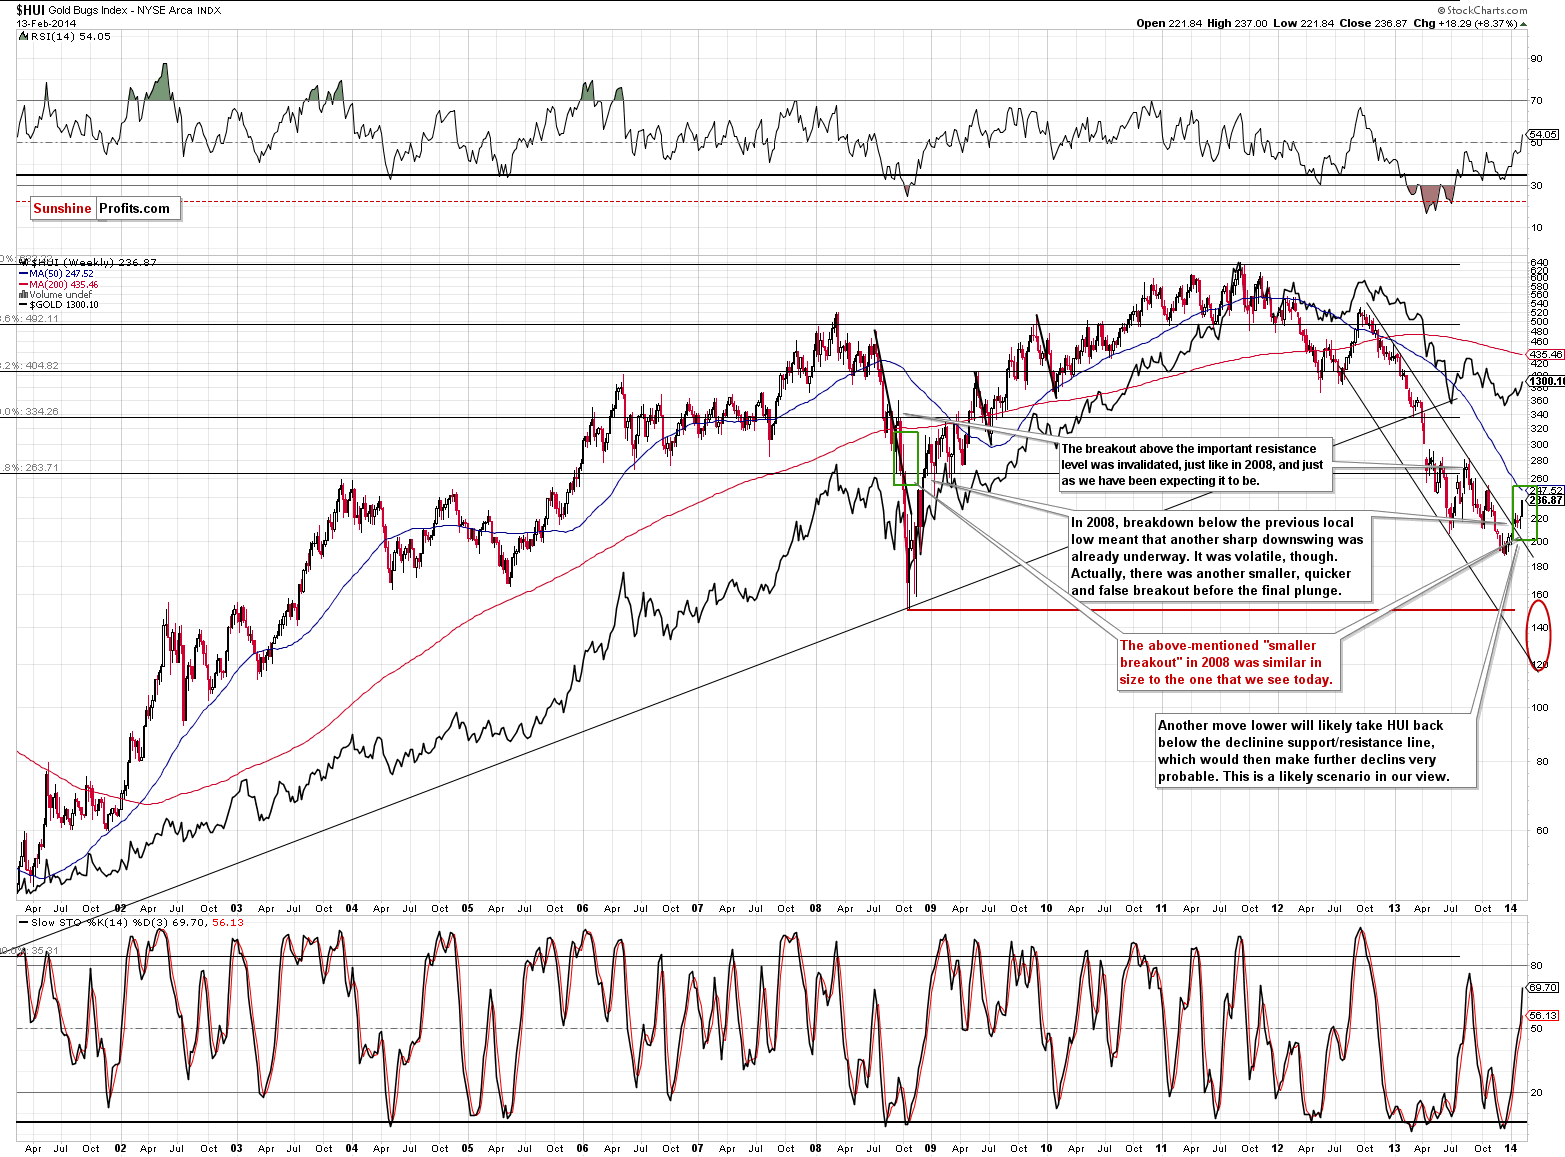
Gold stocks moved higher – visibly higher from the short-term perspective – and the question is how significant this move is. Is it still in tune with what we saw in 2008? It is. The move above the declining resistance line seems significant, but gold miners were already in this position – and still declined significantly shortly thereafter. “This time is different” is a dangerous phrase for traders and investors.
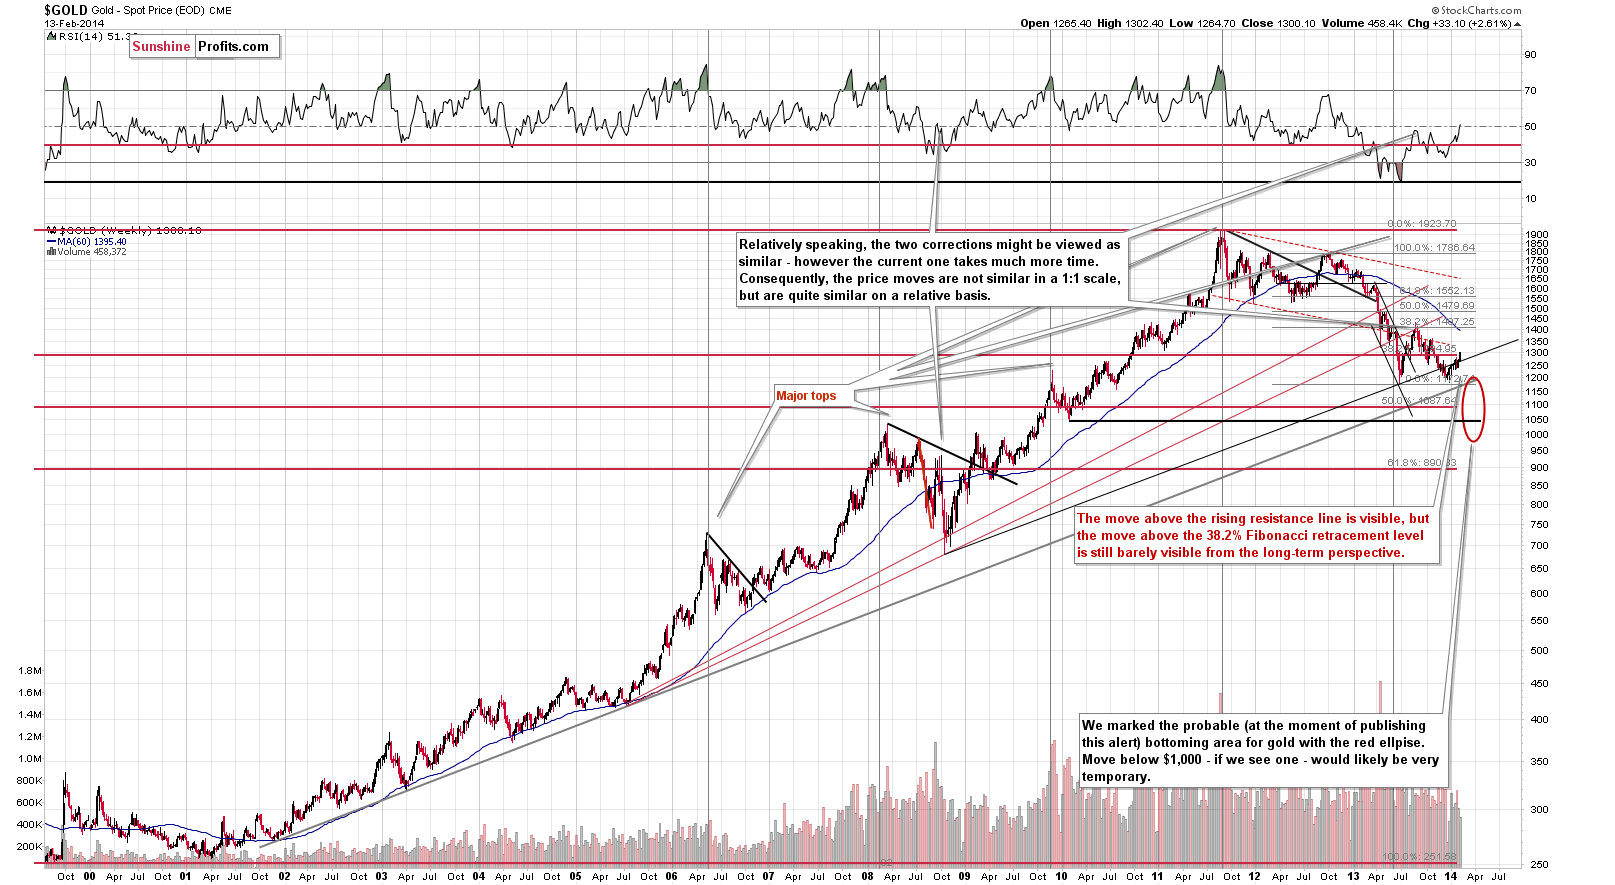
Gold moved higher, but the move above the 38.2% Fibonacci retracement is still relatively small on the above chart. The move above the rising resistance/support line is more visible, and the outlook for gold has improved.
From the long-term perspective, the move to the upside has not been that significant. The “problem” with gold’s rally is that it is very unlikely to continue unless the USD Index gives in and declines below the medium-term line. We already saw a move very close to it yesterday and in today’s pre-market action. The USD is after a long-term breakout, and at medium-term support, which is a powerful bullish combination for the coming weeks.
If the USD Index breaks lower or it rallies strongly (not a daily rally, but at least a weekly one) and gold refuses to decline, then we will have a good indication that it’s safe to jump back into the precious metals market. At this time, we have an encouraging rally, but we also see a major threat (the USD is likely to start a significant rally) that is just waiting to impact the market.
- Gold's breakout? Encouraging, but relatively small.
- Silver's breakout? Not present unless you count today’s pre-market move (and we don’t think it’s meaningful) plus we’re right at the cyclical turning point which overall has bearish consequences.
- Mining stocks' breakout? The one in gold stocks is similar to the one seen in 2008 and if history rhymes, we can see a significant decline shortly (it’s bullish but not strongly bullish). The one in silver stocks is accompanied by huge volume, which has been a bearish signal so many times in the past that we can’t view it as bullish now.
If the USD rallies – and it seems likely that it will relatively soon – we will quite likely see invalidations of breakouts and subsequent plunges. This will be likely until either the USD breaks below the medium-term support or precious metals prove that the dollar’s substantial rally is not a major threat. That’s why we’re still not ready to suggest moving back to the long side of the precious metals market with long-term investment capital.
In speculative terms, the stop-loss orders were reached for gold at $1,307 and based on this, in our opinion even a small short position in the precious metals sector (also in silver and mining stocks) is not worth keeping. We were waiting for a bearish confirmation to increase the size of the position, but never received it. However, if we now see one (and we could see one as soon as today), we will have an even better risk/reward ratio than we had with the previous position with the profit potential greater than a few previous trades combined. As we have previously mentioned, we are aiming to catch a big decline (probably triggered by a significant rally in the USD Index), not a small one here, and we will be monitoring the market for either a confirmation or an invalidation of this possibility. As always, we’ll keep you – our subscribers – updated.
We have also received a question from one of our readers and would like to share the answer with all of you.
Q: Would you like to comment on this article? I trust your analysis more than these guys.
A: Based on the resemblance featured in the article, it does seem a bit more likely that a bigger downturn in the stock market will be seen. However, it's far from being a sure bet.
The reason is that it's just one similar situation. We have investigated the self-similar patterns and their efficiency increases greatly if there are multiple similar patterns that are followed by analogous price action. There's only one such case here. Sure, the fact that the pattern has continued since it was discovered makes it more reliable, but on the other hand this could be just an accident. The article doesn't say if there were no other similar patterns between 1930's and today. Maybe there were other 5 similar cases or so and each of them was followed by a rally? This would dramatically change the interpretation.
On a side note, we wouldn't call these two patterns correlated - they are simply similar or we could say that we can see self-similarity.
To summarize:
Trading capital: No positions.
Long-term capital: No positions.
As always, we'll keep you - our subscribers - updated should our views on the market change. We will continue to send out Gold & Silver Trading Alerts on each trading day and we will send additional Alerts whenever appropriate.
The trading position presented above is the netted version of positions based on subjective signals (opinion) from your Editor, and the automated tools (SP Indicators and the upcoming self-similarity-based tool).
As a reminder, Gold & Silver Trading Alerts are posted before or on each trading day (we usually post them before the opening bell, but we don't promise doing that each day). If there's anything urgent, we will send you an additional small alert before posting the main one.
Thank you.
Sincerely,
Przemyslaw Radomski, CFA

