

Briefly: In our opinion, long (full) speculative positions in gold, silver and mining stocks are justified from the risk/reward point of view.
Silver soared yesterday and while this signal can be viewed as bearish when it’s accompanied by mining stocks’ underperformance, we didn’t see the latter during yesterday’s session. Instead, miners rallied as well and they did so on strong volume. Is a major rally just around the corner?
Well, we wouldn’t call it major, but it seems that we’ll see some more strength before we see much lower prices and the odds for such a rally increased based on yesterday’s price / volume action. Let’s take a look at the charts (charts courtesy of http://stockcharts.com).
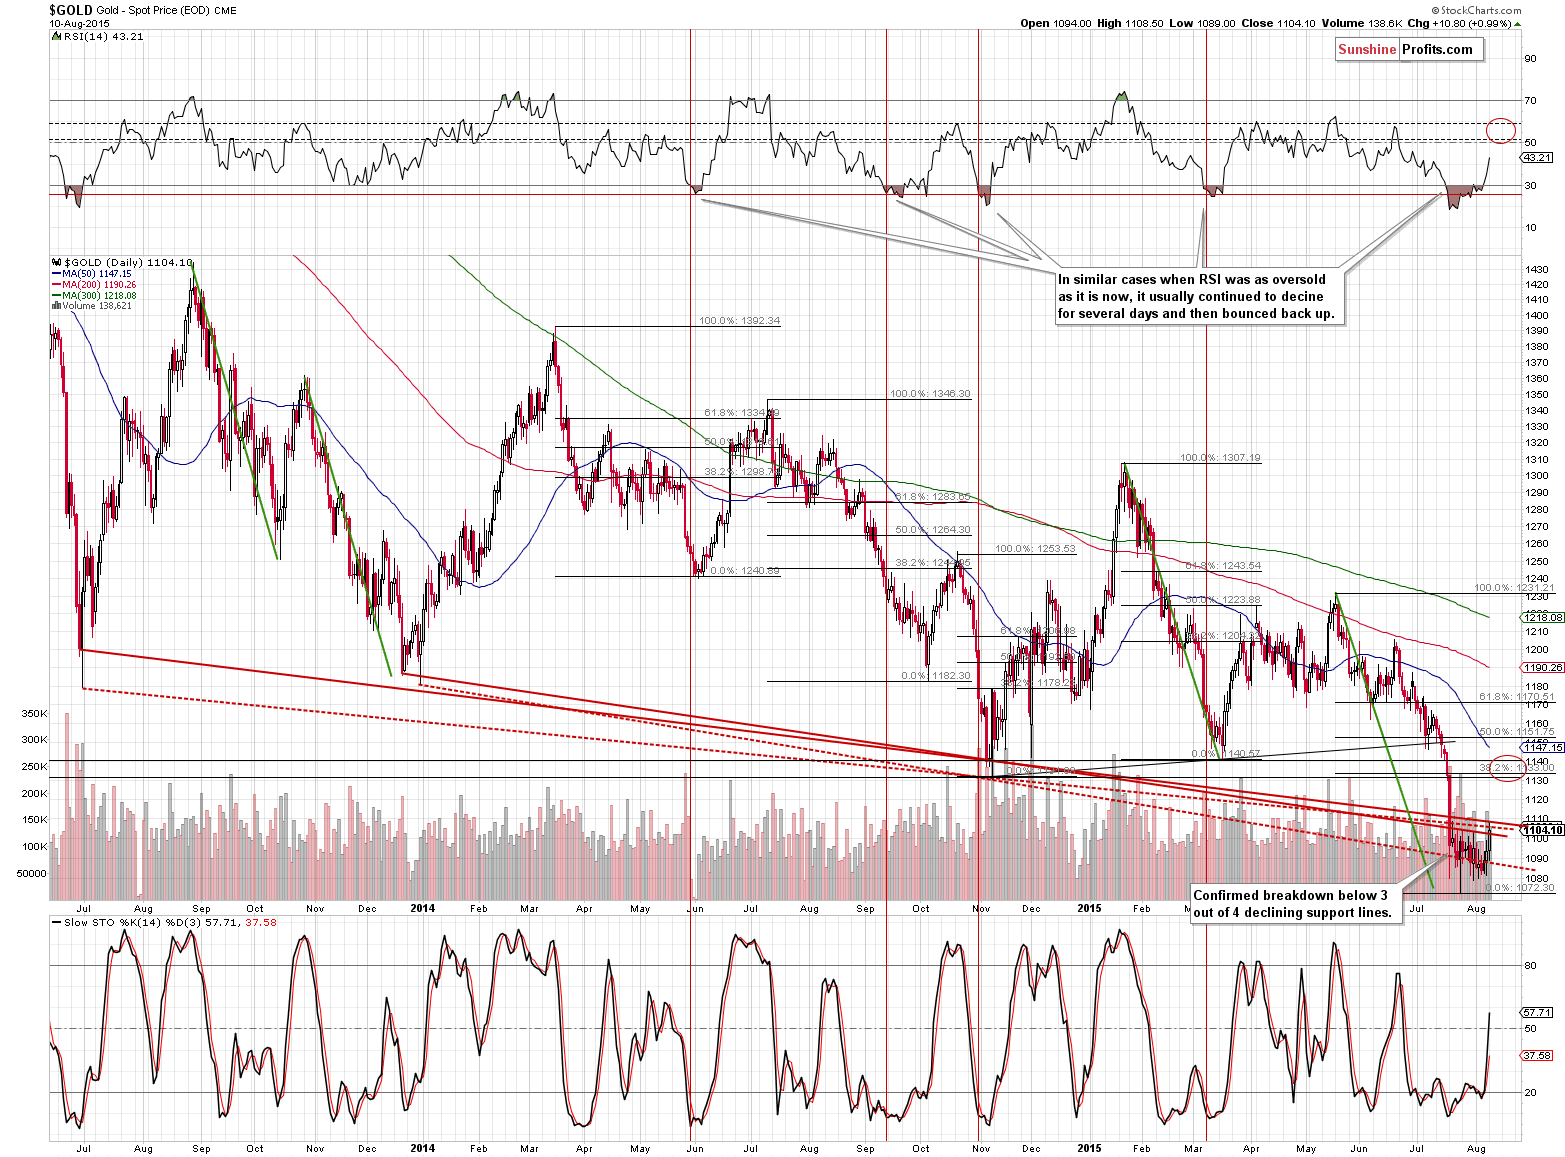
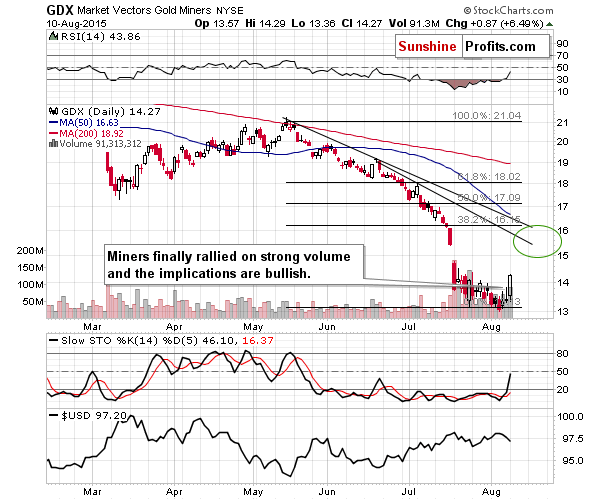
Gold rallied quite visibly yesterday and it finally closed below the July 20 close – something that they yellow metal didn’t manage to do since that day. There was no move back above the 3 declining resistance lines, but the size of the volume during the upswing makes the above chart more bullish than it was previously.
Another thing that has bullish implications (but not extremely bullish) is the RSI indicator. As you can see in the upper part of the above chart, when the RSI (and gold) moved higher from oversold levels, the rally very often took place until RSI moved to the 50 - 60 range (marked with dashed lines on the above chart). This tells us that gold is likely to move somewhat higher but not significantly (at least that’s not what we can infer from the previous oversold situations).
Considering how low the RSI was, where it is today, and how high it could go, and translating it to where gold was and currently is gives us a very rough estimation of $1,125 – 1,145 as a target price. Naturally, the RSI alone is not enough to provide a reliable target price or area.
However, if we apply other analogies, we also end up with more or less the same target area.
The 50-day moving average is currently at $1,147.15, but given the pace at which it has been declining, it seems likely that it could meet gold right in the mentioned target area.
Moreover, this area includes the Nov. 2014 low, which was a major support and now serves as a major resistance.
Finally, if we consider the sizes of corrective upswings after situations when the RSI was similarly oversold as it has been recently, we see that gold usually corrected between 38.2% and 61.8% of the preceding decline (or close to these levels). The mentioned area is mostly within the 38.2% - 61.8% range, which serves as another confirmation that this target area is likely to include the next local top.
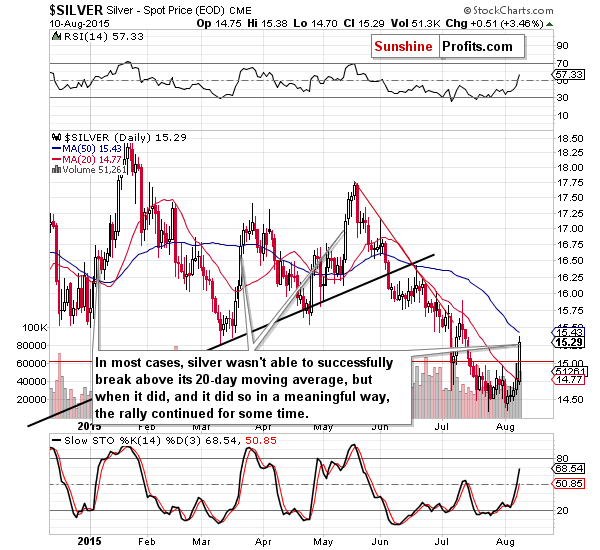
In yesterday’s alert we commented on the above chart in the following way:
Silver moved higher, but the rally was in tune with previous daily patterns that were followed by lower prices. Silver moved above the 20-day moving average on an intra-day basis only to decline later during the day and close right at it. The implications “should” be bullish based on the classic way technical analysis is usually applied, but based on our experience with the white metal, we view the implications of the above chart as unclear, not bullish.
In light of yesterday’s rally, we continue to think that caution was justified – there are too many cases when silver’s outperformance is quickly invalidated. We saw a rally and now silver is well above its 20-day moving average. Is the breakout meaningful? Actually, it likely is. It doesn’t necessarily imply that silver will soar much (several dollars) further, but it does tell us that silver’s rally is likely not over just yet. The reason is silver’s performance after similar price moves and breakouts. As you can see on the above chart, silver tends to continue to rally for a short period and then tops after such breakouts.
How high is silver likely to go?
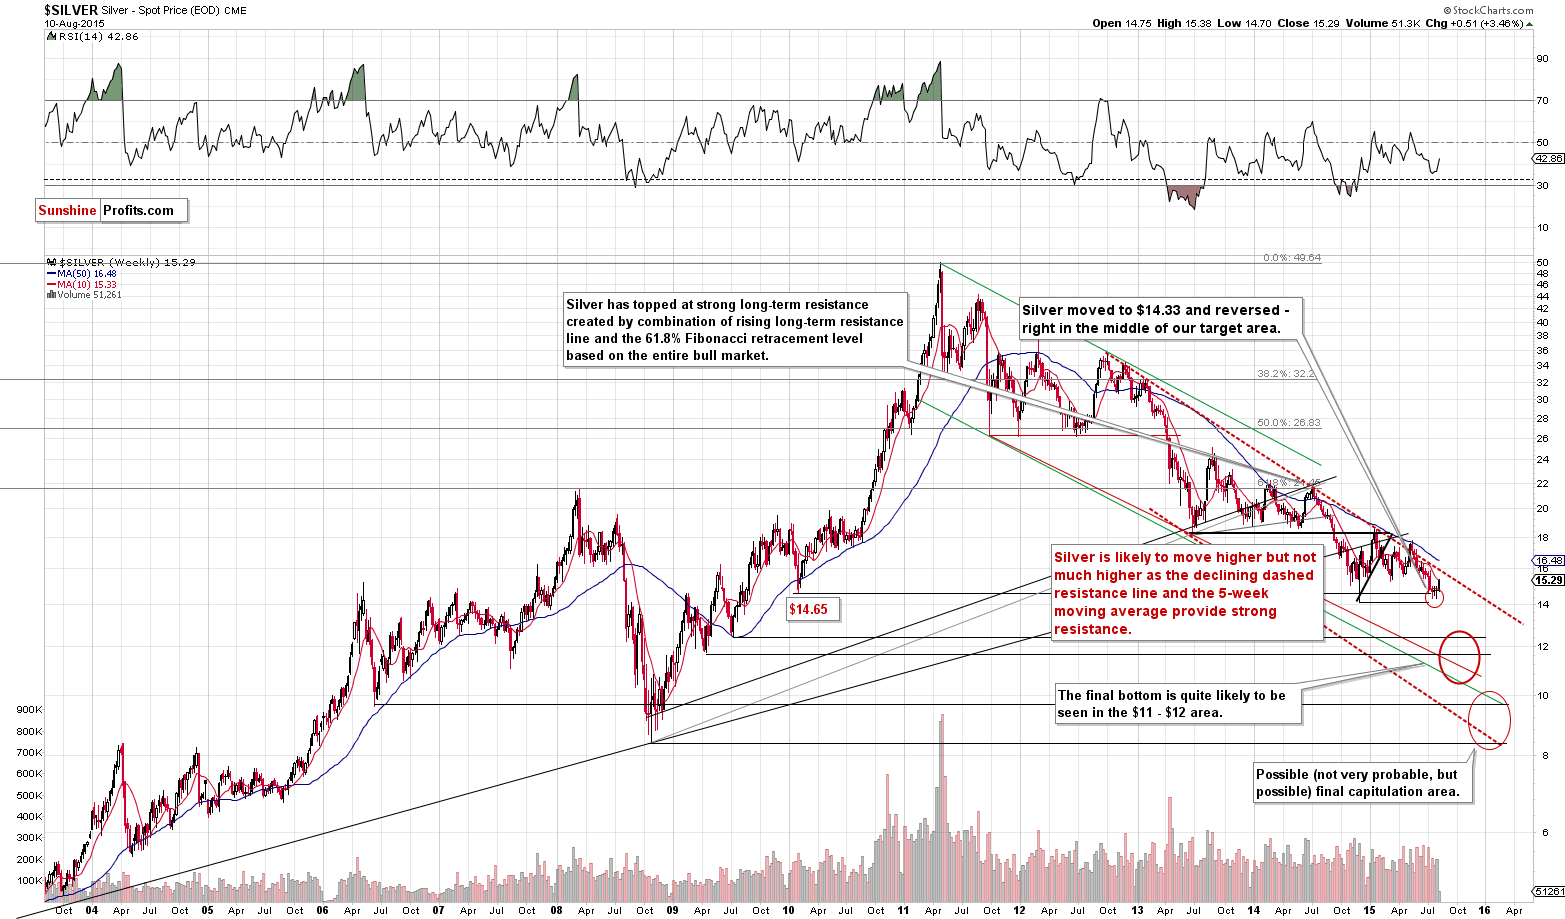
Higher, but not much higher. There is significant long-term resistance relatively close to where silver currently is. The declining dashed resistance line and the 50-week moving average provide resistance close to the $16 level. It’s unclear whether silver’s next local top is more likely to take place a bit below or above this level, but it seems likely that we will get confirmation from another market (gold or mining stocks) once silver moves close to this area.
Speaking of mining stocks, we are finally seeing bullish action in this part of the precious metals sector.
In the previous alert we wrote the following:
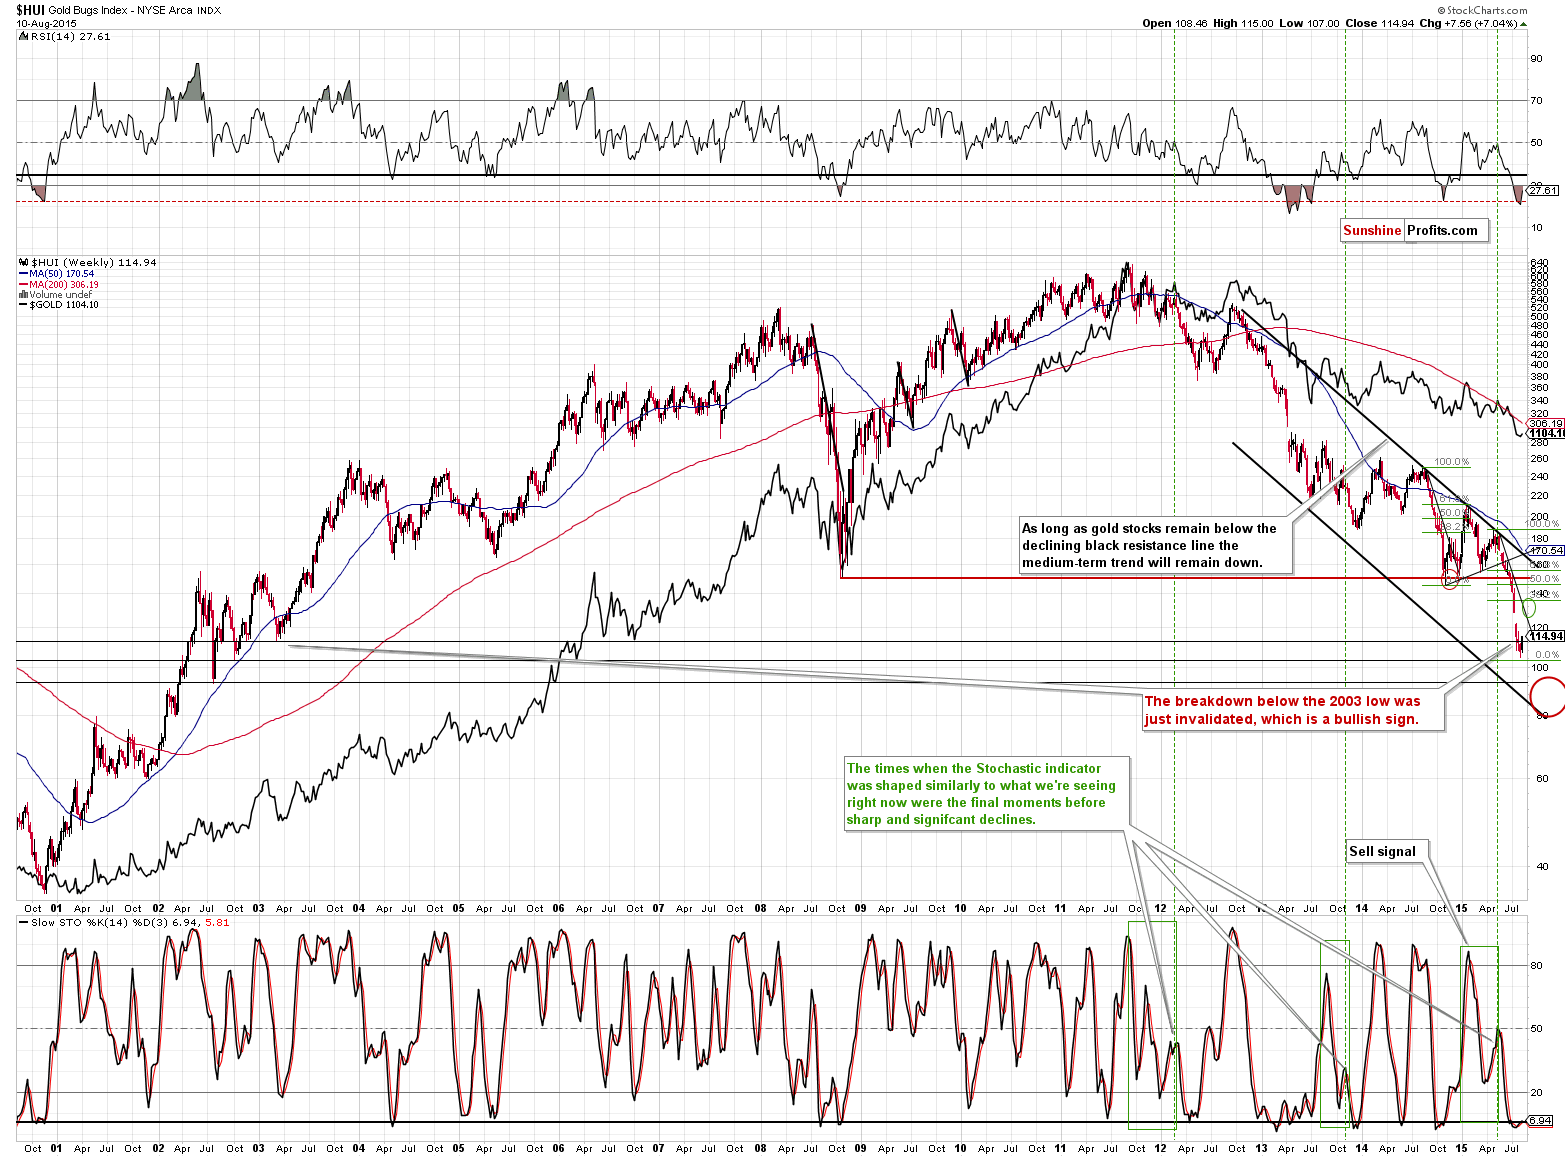
Miners didn’t plunge and they indeed formed a bullish reversal candlestick. This has bullish implications for the next few weeks, and we can say the same about the buy signal from the weekly Stochastic indicator.
The bullish signal was indeed followed by more bullish action and this week’s invalidation of the breakdown below the 2003 low is yet another bullish factor. The situation improved and our target area (marked with green) remains up-to-date.
Friday’s intra-day reversal seemed bearish at the first sight, but we commented that it had little, if any implications and it seems that our interpretation was correct:
It was not particularly bearish either because gold moved only a little higher, so the fact that miners didn’t rally is not really concerning. If we had seen this kind of action during gold’s $20 rally, that would have been a very bearish phenomenon, but gold moved higher by only $4.30, so there are little implications, if any.
The situation improved significantly on Monday from the short-term perspective as the GDX rallied on strong volume by more than 6%. Our target area (marked in green) remains up-to-date also on the above chart. It seems that the GDX will move to the $15 - $16 range before topping once again.
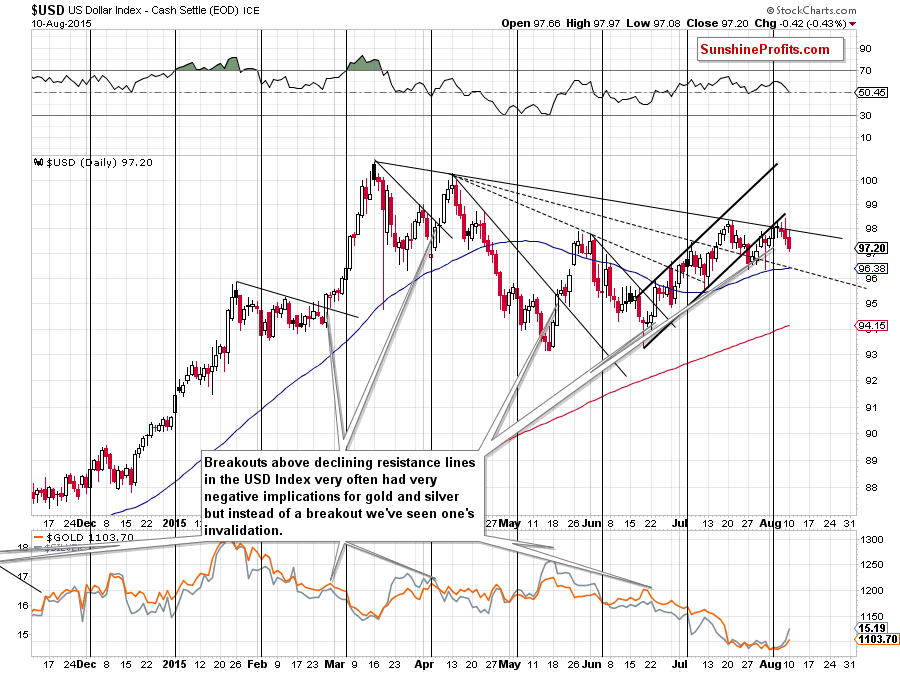
Meanwhile, the situation in the USD Index developed exactly as we had expected it to and the PM sector also reacted as we had expected. Yesterday we wrote the following:
The thing that could trigger higher prices of precious metals in the near term is the USD Index, which seems likely to correct in the near future. The USD declined after the initial breakout above the declining resistance line, thus invalidating it – which is a bearish sign for the USD. Moreover, the cyclical turning point for the USD was just seen and the previous move was to the upside, so the odds are the USD index will decline sooner rather than later. This is likely to have bullish implications for the precious metals sector as both sectors are negatively correlated.
The above remains up-to-date – the USD Index is still likely to contribute to higher PM prices.
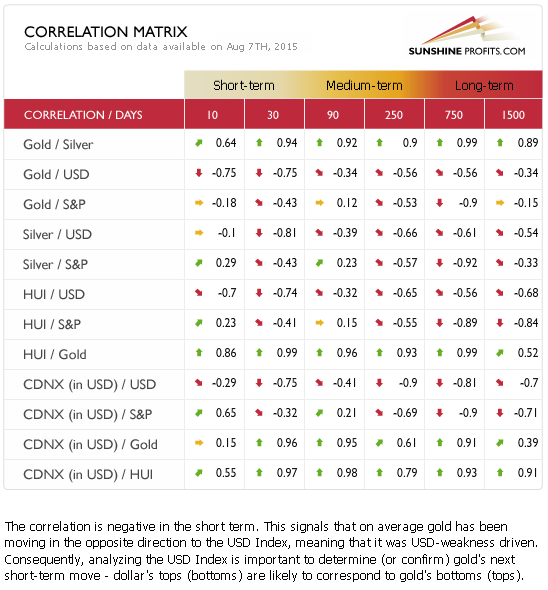
The 30-day correlation between gold and the USD Index is still below -0.7, which means that the correlation is negative and relatively strong. The implications are bearish for the precious metals sector.
Summing up, from the medium-term perspective nothing changed in the precious metals market recently as the situation was and still is bearish (we don’t think the final bottom for this decline is in yet), but it seems very likely that we will see a corrective rally before the decline continues (and we continue to think that taking profits off the table and closing our previous short position when silver moved to $14.33 was a good idea).
There are more bullish factors than bearish ones (the bearishness in the mainstream media being the most significant bullish factor), and the situation has actually become much more bullish because of yesterday’s price-volume action. The outlook improved only slightly in the case of gold, but it improved significantly in the case of silver and mining stocks and since the entire PM sector is likely to move in the same direction in the short term, we believe that it’s currently justified from the risk/reward perspective to double the size of the profitable speculative long position in the precious metals sector. It seems quite likely that our profits on this trade will become even bigger.
We will keep you – our subscribers – updated.
To summarize:
Trading capital (our opinion): Long position (full) position in gold, silver and mining stocks is justified from the risk/reward perspective with the following stop-loss orders and initial (! – this means that reaching them doesn’t automatically close the position) target prices:
- Gold: initial target price: $1,130; stop-loss: $1,063, initial target price for the UGLD ETN: $9.24; stop loss for the UGLD ETN $7.69
- Silver: initial target price: $15.20; stop-loss: $14.12, initial target price for the USLV ETN: $14.40; stop loss for USLV ETN $11.51
- Mining stocks (price levels for the GDX ETN): initial target price: $15.87; stop-loss: $12.37, initial target price for the NUGT ETN: $5.17; stop loss for the NUGT ETN $2.46
In case one wants to bet on junior mining stocks' prices (we do not suggest doing so – we think senior mining stocks are more predictable in the case of short-term trades – if one wants to do it anyway, we provide the details), here are the stop-loss details and initial target prices:
- GDXJ: initial target price: $21.78; stop-loss: $17.67
- JNUG: initial target price: $12.01; stop-loss: $6.39
Long-term capital (our opinion): No positions
Insurance capital (our opinion): Full position
Please note that a full position doesn’t mean using all of the capital for a given trade. You will find details on our thoughts on gold portfolio structuring in the Key Insights section on our website.
As a reminder – “initial target price” means exactly that – an “initial” one, it’s not a price level at which we suggest closing positions. If this becomes the case (like it did in the previous trade) we will refer to these levels as levels of exit orders (exactly as we’ve done previously). Stop-loss levels, however, are naturally not “initial”, but something that, in our opinion, might be entered as an order.
Since it is impossible to synchronize target prices and stop-loss levels for all the ETFs and ETNs with the main markets that we provide these levels for (gold, silver and mining stocks – the GDX ETF), the stop-loss levels and target prices for other ETNs and ETF (among other: UGLD, DGLD, USLV, DSLV, NUGT, DUST, JNUG, JDST) are provided as supplementary, and not as “final”. This means that if a stop-loss or a target level is reached for any of the “additional instruments” (DGLD for instance), but not for the “main instrument” (gold in this case), we will view positions in both gold and DGLD as still open and the stop-loss for DGLD would have to be moved lower. On the other hand, if gold moves to a stop-loss level but DGLD doesn’t, then we will view both positions (in gold and DGLD) as closed. In other words, since it’s not possible to be 100% certain that each related instrument moves to a given level when the underlying instrument does, we can’t provide levels that would be binding. The levels that we do provide are our best estimate of the levels that will correspond to the levels in the underlying assets, but it will be the underlying assets that one will need to focus on regarding the sings pointing to closing a given position or keeping it open. We might adjust the levels in the “additional instruments” without adjusting the levels in the “main instruments”, which will simply mean that we have improved our estimation of these levels, not that we changed our outlook on the markets. We are already working on a tool that would update these levels on a daily basis for the most popular ETFs, ETNs and individual mining stocks.
Our preferred ways to invest in and to trade gold along with the reasoning can be found in the how to buy gold section. Additionally, our preferred ETFs and ETNs can be found in our Gold & Silver ETF Ranking.
As always, we'll keep you - our subscribers - updated should our views on the market change. We will continue to send out Gold & Silver Trading Alerts on each trading day and we will send additional Alerts whenever appropriate.
The trading position presented above is the netted version of positions based on subjective signals (opinion) from your Editor, and the Tools and Indicators.
As a reminder, Gold & Silver Trading Alerts are posted before or on each trading day (we usually post them before the opening bell, but we don't promise doing that each day). If there's anything urgent, we will send you an additional small alert before posting the main one.
=====
Latest Free Trading Alerts:
On July 28, the Thomson Reuters published the GFMS Gold Survey: Q2 2015 Update and Outlook. What can we learn from this publication?
=====
Hand-picked precious-metals-related links:
UBS cuts one-month gold price forecast 13% on possible US rate hike
Potential NUM Strike on the Cards
Harmony Gold: Spanner in the works
=====
In other news:
China devalues yuan after poor economic data
Greece clinches third bailout: Officials
Yuan in biggest fall since 1994 after surprise devaluation
=====
Thank you.
Sincerely,
Przemyslaw Radomski, CFA
Founder, Editor-in-chief
Gold & Silver Trading Alerts
Forex Trading Alerts
Oil Investment Updates
Oil Trading Alerts

