
Briefly: In our opinion no speculative positions in gold, silver and mining stocks are now justified from the risk/reward perspective. However, day-traders might consider a small speculative long position in silver.
Last week was full of important events for the precious metals investors. Gold broke below the medium-term rising support line, silver moved below its previous short-term bottom, miners broke below their declining support line, USD index soared and all of the above was accompanied by the European QE announcement. In light of the above events, what’s likely to happen to gold and the rest of the sector this week?
In short, the precious metals sector is still likely to correct even though the medium-term trend remains bearish. Since not much happened on Friday, our most recent comments remain up-to-date to large extent.
Let’s examine the charts for details (charts courtesy of http://stockcharts.com.)
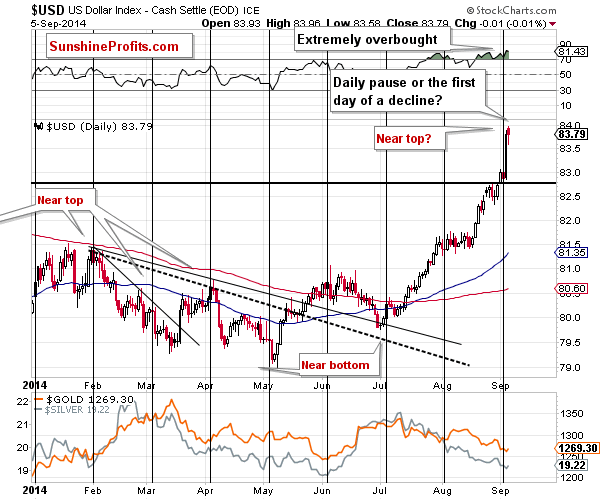
As you know, the USD Index is right at the cyclical turning point (or slightly behind it, which doesn’t change anything), so it’s likely to change its direction.
We saw a small reversal on Friday, but it’s unclear whether it was just a pause within a rally, or a true reversal. Since the medium-term resistance line was just reached and the USD Index is still very close to the turning point, it seems that we will see a reversal – at least a temporary one – relatively soon. Before we can say that the decline in the precious metals sector is very likely to continue, we would first have to see how the sector reacts to dollar’s weakness. It seems likely to us that we will see a correction also in case of gold, silver and mining stocks and that PMs’ and miners’ reaction will be smaller and smaller as USD continues to move temporarily lower. This would likely create a great opportunity to enter short positions. For now, however, the situation seems rather unclear in this regard.
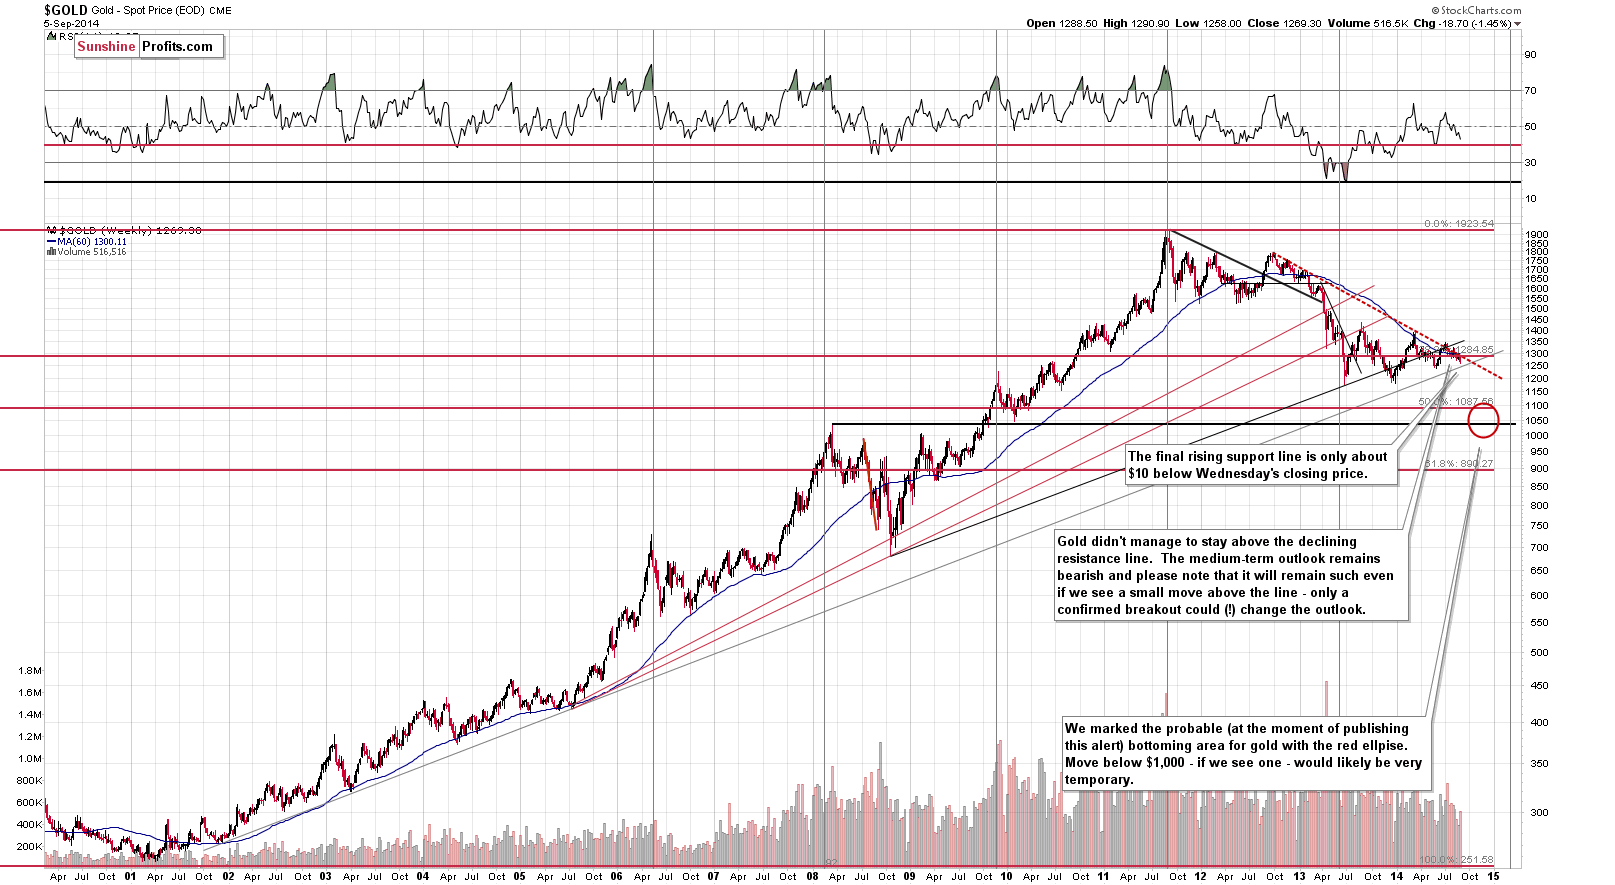
The long-term gold chart features a visible medium-term downtrend, but at the same time it also shows that the long-term support is relatively close. This means that we could see some kind of a pause even if gold is to move a bit lower in the short term. The support is currently [close to] $1,250.
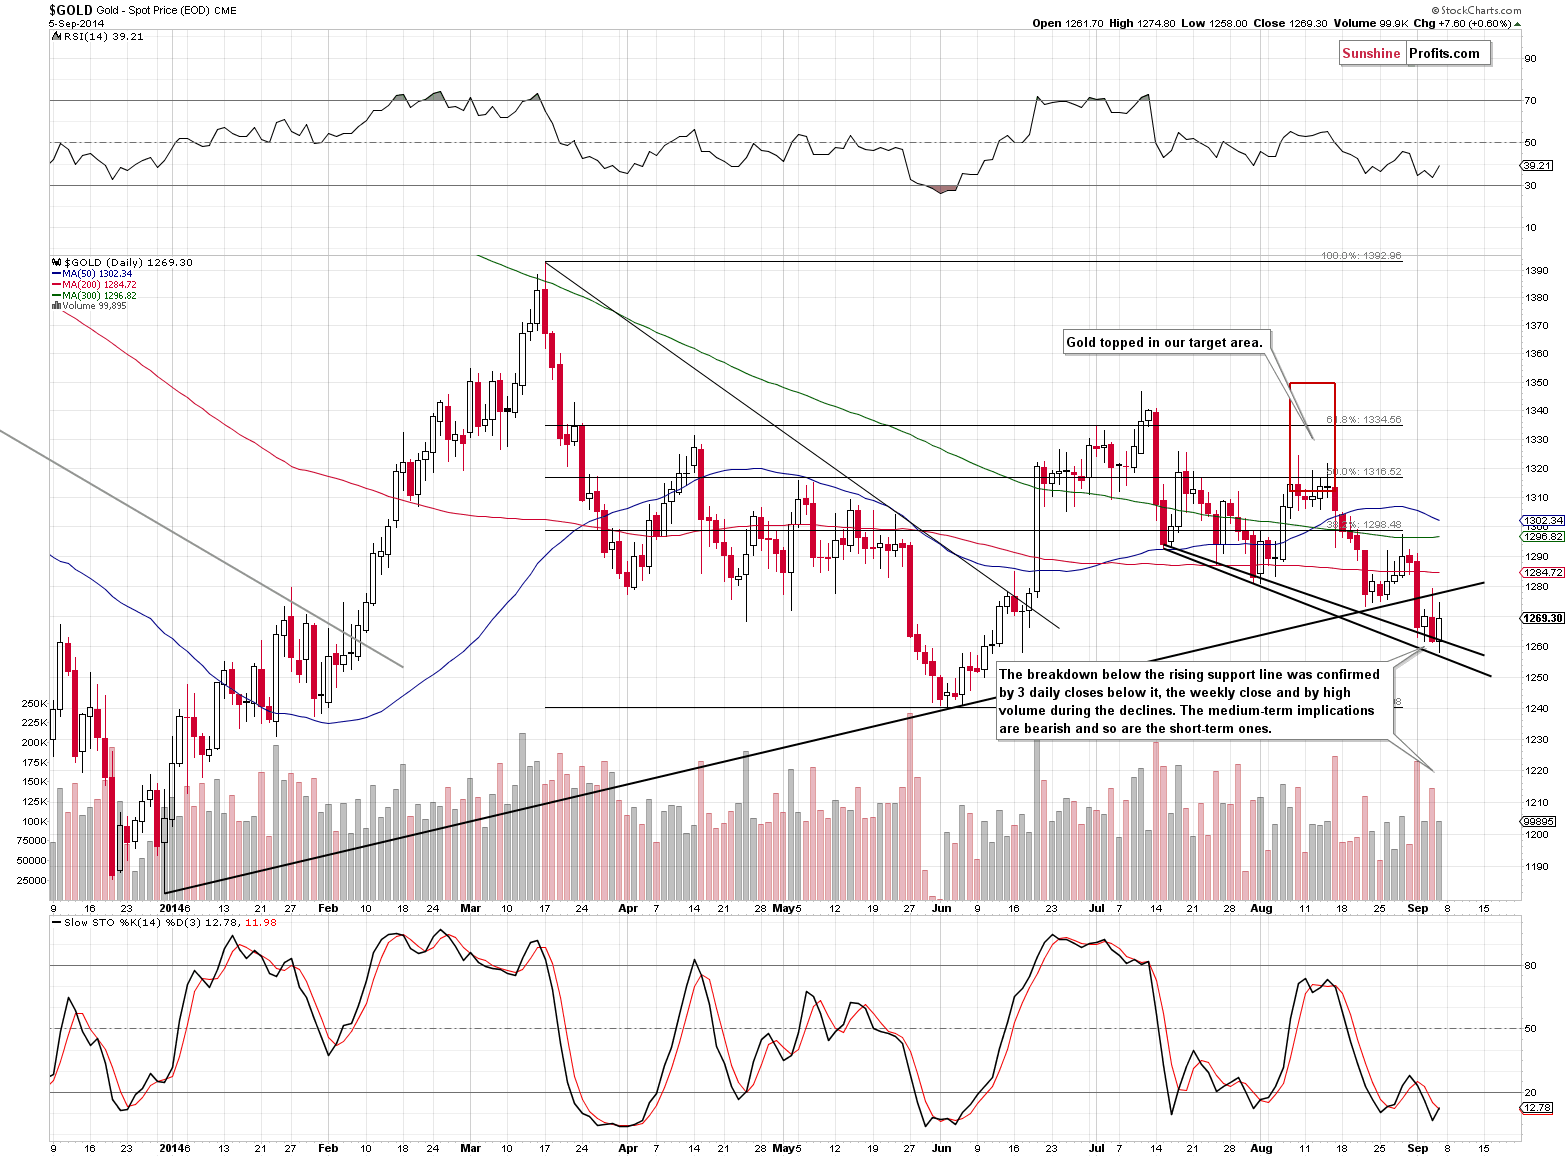
On the short-term chart we see that the breakdown was confirmed. The breakdown was additionally confirmed by a weekly close below the broken line. The implications are bearish, but given the support present on the long-term chart and the proximity of the June low, we might see only a temporary move lower before another pause.
Since the size of the uncertain (given the situation in the USD Index) decline is not that significant and the chance of a corrective upswing is relatively high (again, because of the USD), it seems better to stay on the sidelines for a few more days. We will know much more once we see how gold reacts to the dollar’s weakness.
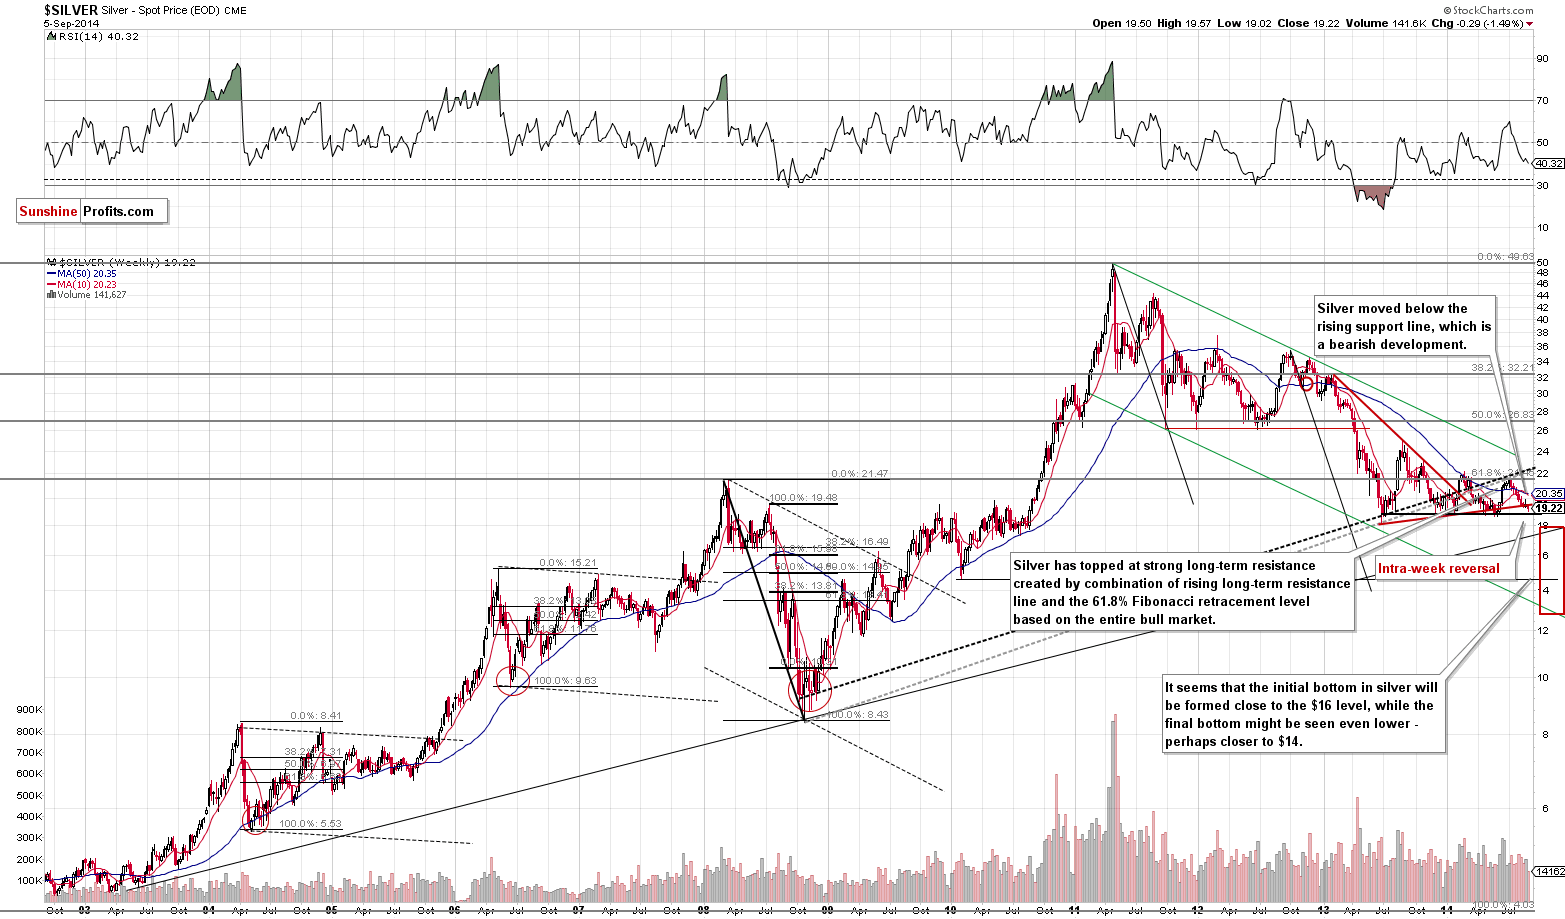
The situation in the silver market is twice as interesting and critical as in the gold market. The white metal has been consolidating for about a year and the move preceding the consolidation was a sharp and big decline. Once silver breaks below the previous lows, it could drop very far. The support is strong and perhaps that’s why silver is currently more reluctant to decline – it has moved less than gold [last] week.
From the weekly perspective we can see that there was a slight reversal right before the week ended – the price of the white metal turned up. Perhaps that’s the very early part of the corrective upswing that we have mentioned previously, but it’s too early to know for certain or with huge probability.
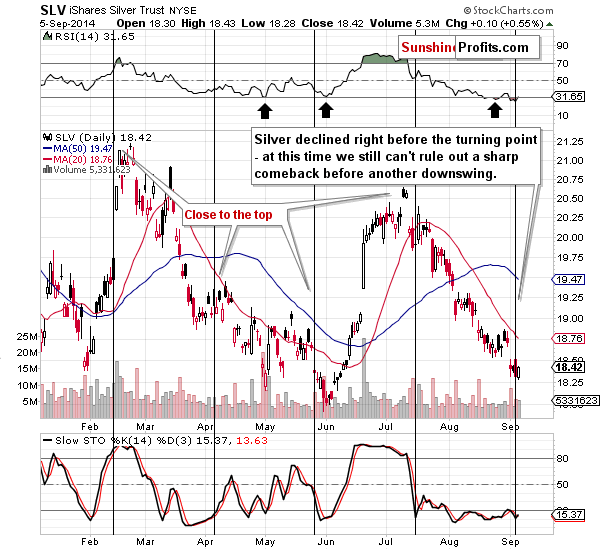
The short-term chart still suggests a turnaround – the white metal is right at its cyclical turning point and is strongly oversold on a short-term basis. Even if we are to see much lower silver prices in the coming weeks (which is likely in our view), the white metal might need to correct – and rally – first.
The above chart shows that we have indeed seen some strength on Friday even better than the previous one.
What about mining stocks?
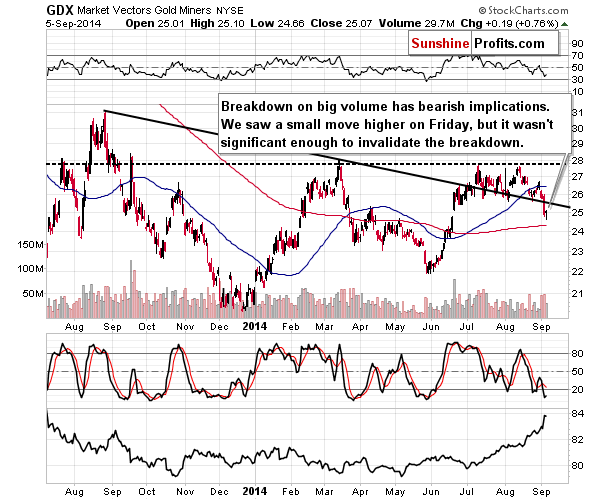
Thursday’s breakdown materialized on high volume, which is a bearish sign. Friday’s small turnaround took place on relatively low volume and didn’t take miners back above the previously broken line. The breakdown is almost confirmed, so the situation deteriorated further for the following weeks, but based on the small sign of strength that we saw on Friday, we could see another move higher before the bigger plunge – especially given the situation in the USD Index.
Before summarizing, let’s examine the situation in the junior mining stocks.
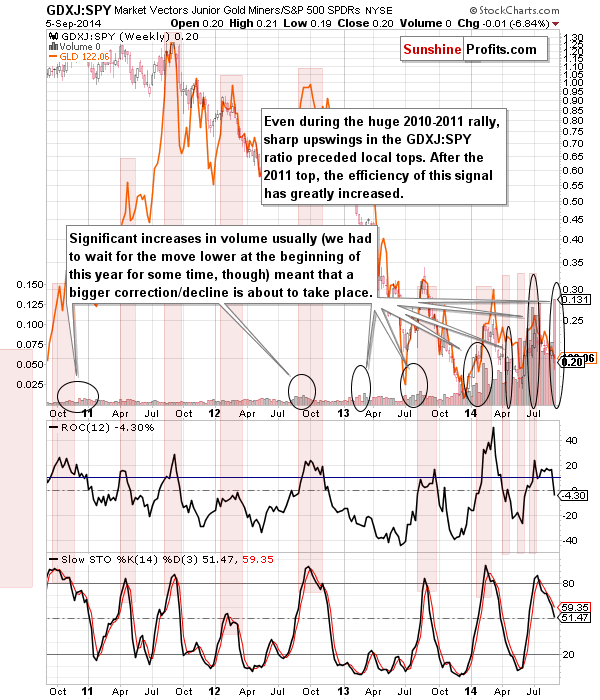
We have previously emphasized that when we compare the performance of the junior mining stocks to performance of other stocks (the general stock market) and focus on the ratio of volumes, we can get very useful medium-term signs. These signs are not useful in the short term, but have been effective when one focuses on performance of the precious metals sector in terms of weeks.
The volume on which juniors moved last week was extremely high when compared to the volume on which the SPY ETF moved (proxy for the general stock market), which is a bearish sign. We are likely to see another sizable move lower in the coming weeks, but not necessarily right away. This sign is in tune with what we can infer based on other charts.
Summing up, the situation in the precious metals market is very tense. The medium-term trend remains down and we saw breakdowns in gold, silver and mining stocks, but at the same time the situation in the USD Index (which has been a major factor in determining the PMs’ and miners’ price swings) suggests that we could see a corrective upswing.
The most important thing is that the situation doesn’t really impact the medium-term outlook (after all, long-term investments are usually the biggest part of one’s portfolio), which remains bearish. The situation is only very tense for the short term. In this case, it seems that waiting on the sidelines is still appropriate – when in doubt, stay out.
To summarize:
Trading capital (our opinion): No positions
Long-term capital (our opinion): No positions
Insurance capital (our opinion): Full position
Please note that a full position doesn’t mean using all of the capital for a given trade. You will find details on our thoughts on gold portfolio structuring in the Key Insights section on our website.
Our preferred ways to invest in and to trade gold along with the reasoning can be found in the how to buy gold section. Additionally, our preferred ETFs and ETNs can be found in our Gold & Silver ETF Ranking.
As always, we'll keep you - our subscribers - updated should our views on the market change. We will continue to send out Gold & Silver Trading Alerts on each trading day and we will send additional Alerts whenever appropriate.
The trading position presented above is the netted version of positions based on subjective signals (opinion) from your Editor, and the automated tools (SP Indicators and the upcoming self-similarity-based tool).
As a reminder, Gold & Silver Trading Alerts are posted before or on each trading day (we usually post them before the opening bell, but we don't promise doing that each day). If there's anything urgent, we will send you an additional small alert before posting the main one.
Thank you.
Sincerely,
Przemyslaw Radomski, CFA
Founder, Editor-in-chief
Gold & Silver Trading Alerts
Forex Trading Alerts
Oil Investment Updates
Oil Trading Alerts

