
Briefly: In our opinion no positions are justified from the risk/reward perspective.
The precious metals sector rallied significantly yesterday, there’s no doubt about that. The key question is how much this rally changes. In today’s alert we’ll strive to provide the answer.
Let’s start with the gold chart (charts courtesy of http://stockcharts.com.)
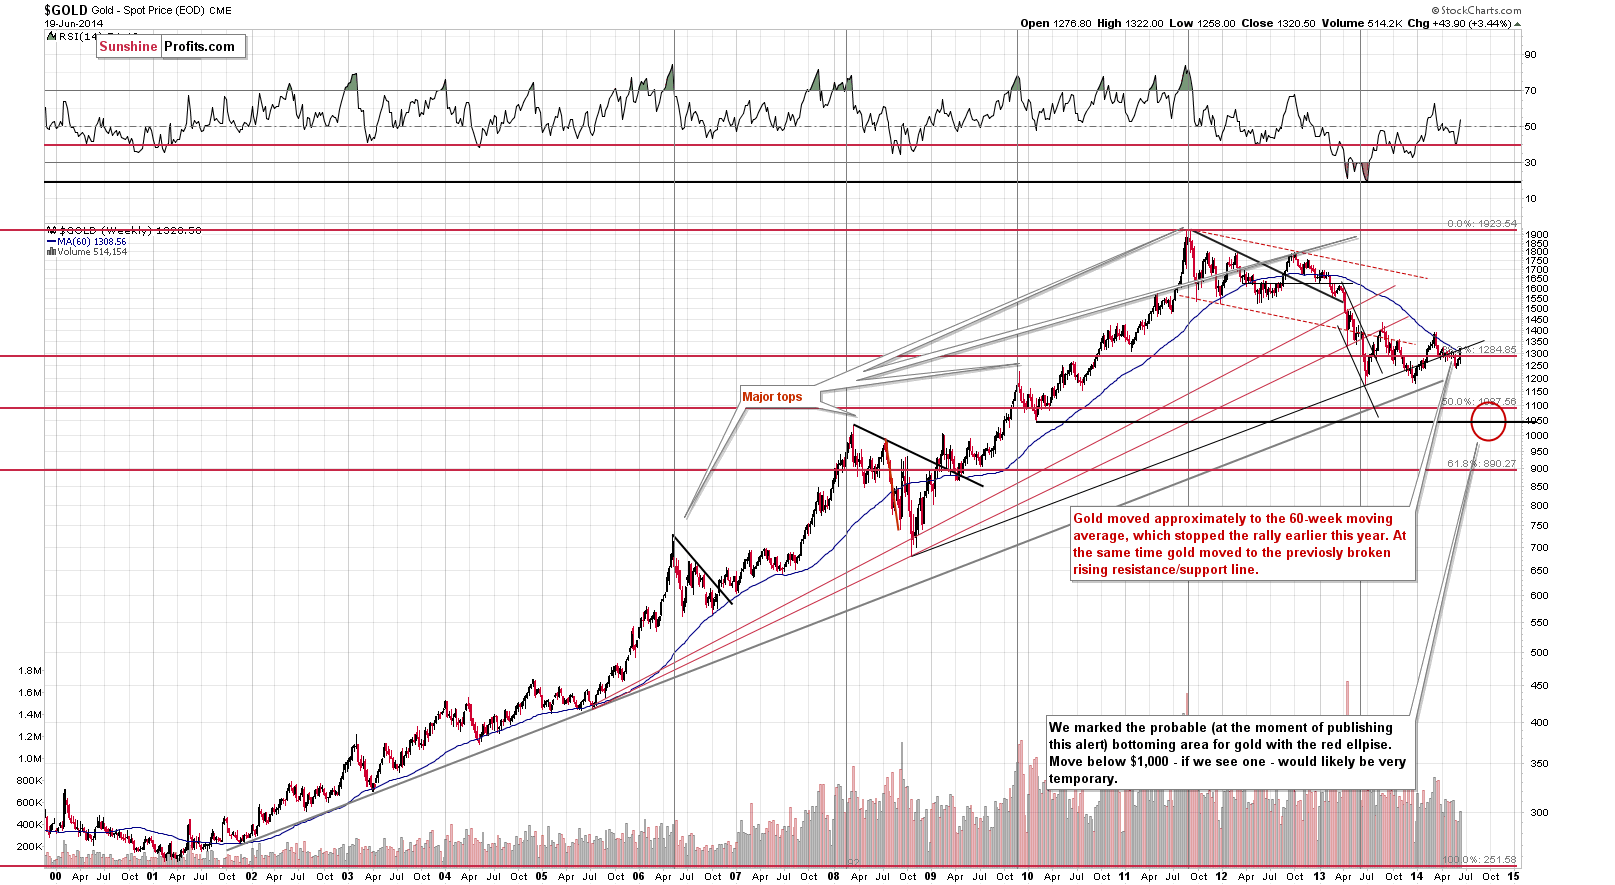
Gold rallied significantly, but a glance at the long-term chart reveals that what we’ve seen so far is yet another correction within a downtrend. Gold is not even close to reaching previous local highs, and it stopped its rally close to the 60-week moving average. That’s what stopped the rally earlier this year, so we could be looking at another local top here.
Additionally, gold has moved to the rising support/resistance line, which also makes it quite likely that the rally is over or close to being over.
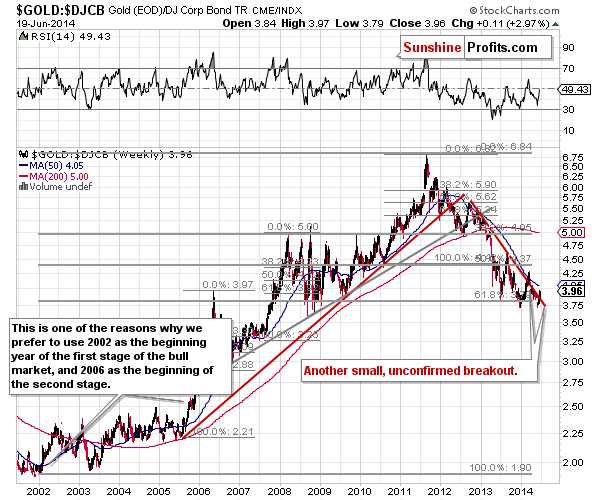
When we compare gold’s performance with the one of bonds we see that gold is still very week and the gold to bonds ratio remains close to the previous lows. We have indeed seen a breakout above the declining resistance line, but it was rather small and unconfirmed. This makes us question the bullish implications of this upswing as the previous rally took the ratio above the declining resistance line by as much as the current rally has.
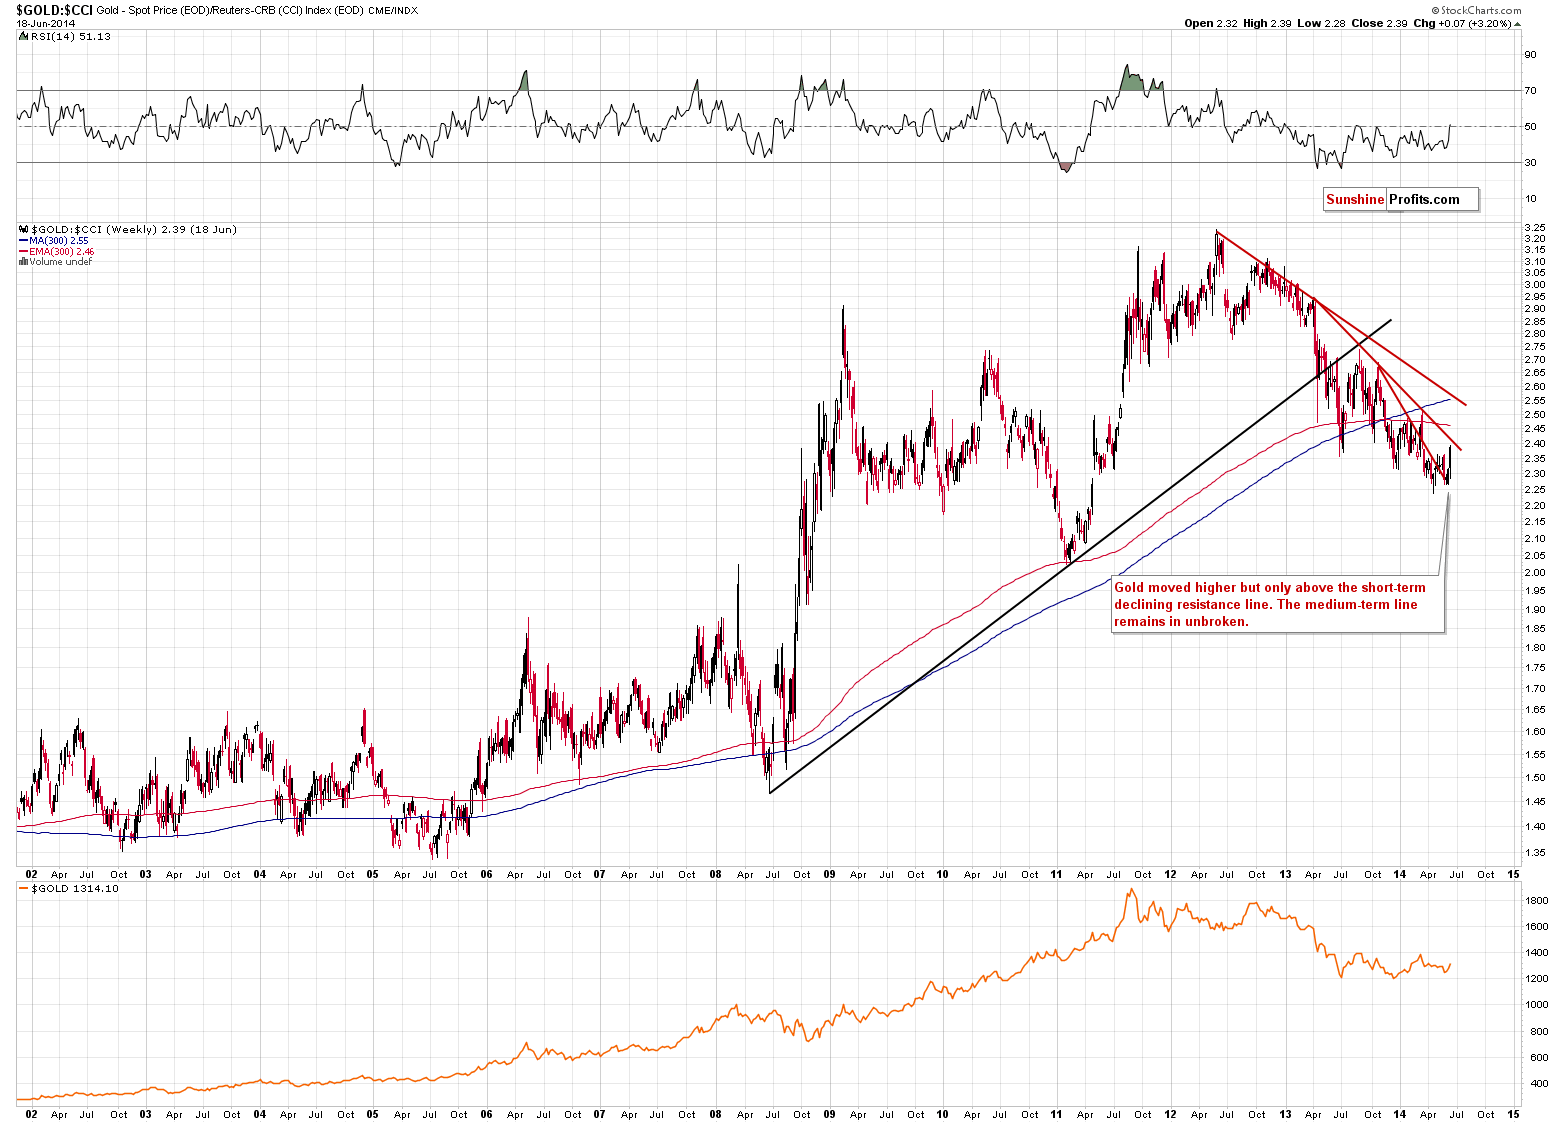
Yesterday, we wrote: gold has not really rallied relative to bonds and the same goes for gold price relative to the CCI Index (commodity sector) and gold price relative to the price of crude oil. In fact, it’s very close to its previous lows just waiting to break down.
The above looks up-to-date, especially in terms of the gold to commodities ratio. We have indeed seen a rally in the ratio, but the move higher hasn’t taken it above the medium-term declining resistance line. Consequently, not that much changed based on yesterday’s significant rally.
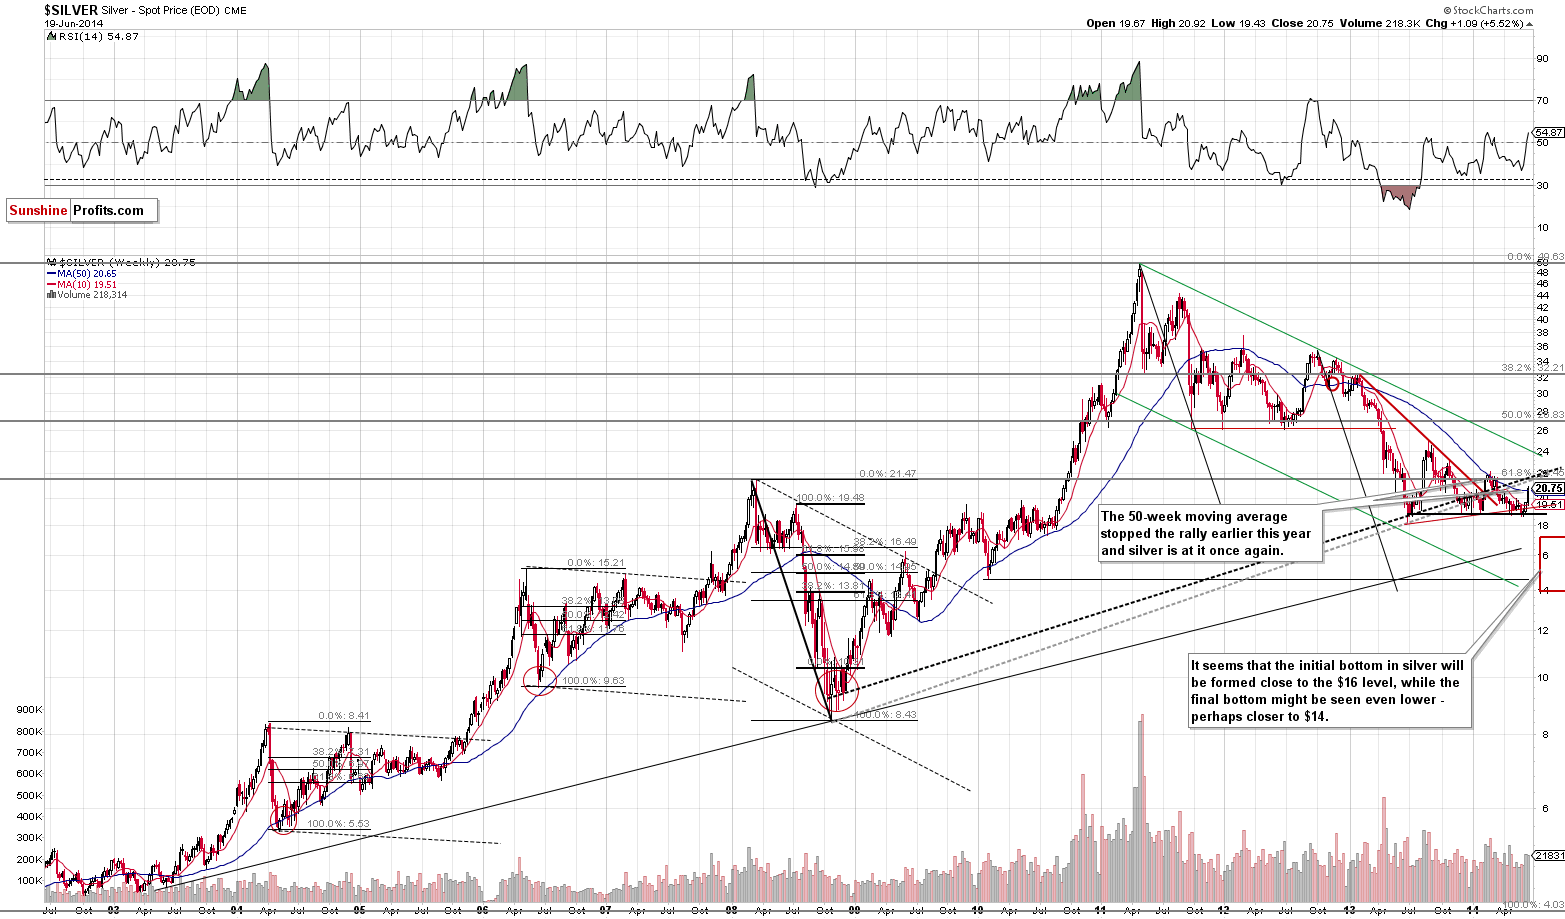
Silver moved to the 50-week moving average and since this was the average that stopped the previous rally, it seems that we could see a local top forming exactly at this time. The short-term rally looks encouraging, but it doesn’t change that much. The trend still remains down.
Mining stocks have rallied most significantly; let’s see what changed.
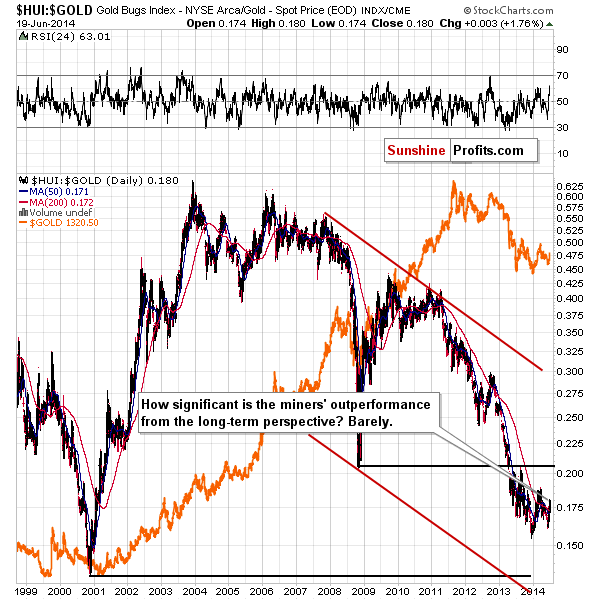
Quoting our previous alert... From the long-term perspective, we can finally see the most recent rally in the gold stocks to gold ratio. Seeing it is the most that we can tell about it as it’s still just a blip on the radar screen. It’s so small that even without further analysis it’s clear that at this time it’s nothing more than just a correction, not yet a sign – let alone proof – of a new rally.
The decline in the ratio that has been in place since early 2011 has broken below the key long-term support (2008 low) and verified this breakdown. It is natural to expect the decline to continue until another strong support stops it. There’s only one level on the horizon strong enough to do it and that’s the 2000 low. The ratio will need to decline some more to get there and it seems to us that that it will.
On a short-term basis, however, the rally in the gold stocks to gold ratio was significant once again. The RSI indicator is more overbought than... EVER. Let’s quote what we wrote previously about this ratio, as it remains up-to-date:
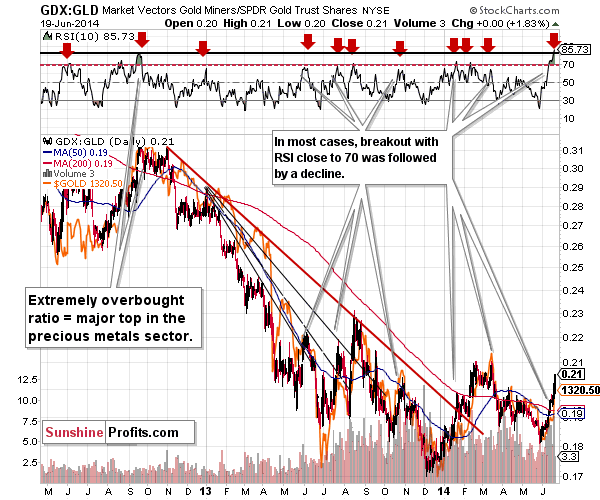
Now, from the short-term perspective, things are much more exciting. The ratio soared sharply and significantly. This means that miners are leading gold higher... Or does it?
It used to work years ago (we were successfully using the above ratio in this way about 4-5 years ago ourselves), but there are no real reasons to believe that this relationship still works. See for yourself. In most cases when the rally was significant enough for the RSI indicator to move to the 70 level, a local top formed – which suggests that during a medium-term decline a visible rally in the miners to gold ratio is a sell signal, not a buy one.
In the past years there was only one case when the RSI indicator was as extremely overbought as it is today – it was in the second half of 2012, when a major top formed. Higher prices were not seen since that time.
Perhaps miners are indeed leading the way. Perhaps it’s a sign of strength. Perhaps the relationship between miners and gold that has been gone for years is back. However, before we see more observations that confirm these changes, we think it’s more appropriate to remain skeptical and assume that things will work just how they used to work recently – and recently (in the past months) – a rally in the miners to gold ratio was not really a good sign.
There’s one more ratio that we would like to comment on today – the one that we haven’t discussed in months, but the one that seems very important today – the GDX to SPY ratio.
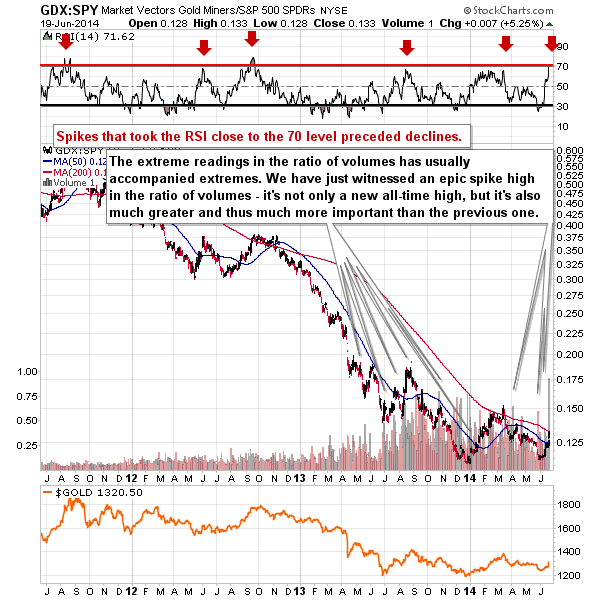
The very interesting thing about the ratio is not only the RSI indicator plotted on it, but also the volume (the ratio of volumes actually). In the past, it was very (!) often the case that when miners made a move on volume that was much higher than the volume in the SPY ETF (which is a proxy for the general stock market), we saw extremes. They were usually tops, but overall, the position of the RSI indicator tells us what kind of extreme are we about too see or have just seen.
At this time it seems that we have seen a major and… epic top. We’ll see if that’s the case in the following days, but the combination of volume and the RSI’s level is uncanny.
Summing up, even though the precious metals sector moved much higher, it seems that we are at or quite close to a local top in the precious metals sector. While the medium-term trend in the precious metals market is down, we were likely to see a corrective upswing – and we have. While in the past days it seemed that the corrective upswing was not over yet, we have some signs that it is over now. We have gold at a significant resistance line, we have short-term outperformance in silver, gold has made the headlines and its volatility is very low – and these are all bearish signs.
The only thing that seems exceptionally bullish at the first sight – the miners’ strength – is not really that bullish after one examines it more closely. We were stopped out of the previous positions, and part of yesterday’s move didn’t affect you, but more importantly, let’s keep in mind that the impact on your portfolio of the latest speculative position was relatively small (the position was only half of the previous one), and the gains on the previous short position (which was a full position) were greater than the outcome of the most recent one. Overall, we continue to think that placing positions that are in tune with the medium-term trend (which still remains down) is the way to go. It might seem perplexing or weird at first, given what happened yesterday, but over time, it is exactly this coherent and unemotional risk/reward approach that makes you money. We’ll continue to care about your portfolio whatever happens in to short run.
To summarize:
Trading capital (our opinion): No positions
Long-term capital: No positions
Insurance capital: Full position
Please note that a full position doesn’t mean using all of the capital for a given trade. You will find details on our thoughts on gold portfolio structuring in the Key Insights section on our website.
As always, we'll keep you - our subscribers - updated should our views on the market change. We will continue to send out Gold & Silver Trading Alerts on each trading day and we will send additional Alerts whenever appropriate.
The trading position presented above is the netted version of positions based on subjective signals (opinion) from your Editor, and the automated tools (SP Indicators and the upcoming self-similarity-based tool).
As a reminder, Gold & Silver Trading Alerts are posted before or on each trading day (we usually post them before the opening bell, but we don't promise doing that each day). If there's anything urgent, we will send you an additional small alert before posting the main one.
Thank you.
Sincerely,
Przemyslaw Radomski, CFA
Founder, Editor-in-chief
Gold & Silver Trading Alerts
Forex Trading Alerts
Oil Investment Updates
Oil Trading Alerts

