

Briefly: In our opinion, a speculative short position (full) in gold, silver and mining stocks is justified from the risk/reward point of view.
Gold moved higher yesterday, but mining stocks refused to follow. The situation seems to be evolving in tune with our expectations. What’s next?
We could see another day or a few of what we saw in the last 2 days – small moves higher in metals (today’s pre-market moved about $10 higher in gold is a good example) and back-and-forth movement in mining stocks, but that’s rather unclear. The clearer thing is that whether we see another small corrective upswing or not, the next big move is very likely to be to the downside, so that’s what we think one should focus on. In short, everything that we wrote yesterday remains up-to-date and the situation actually deteriorated once again. Let’s take a look at the details (charts courtesy of http://stockcharts.com).
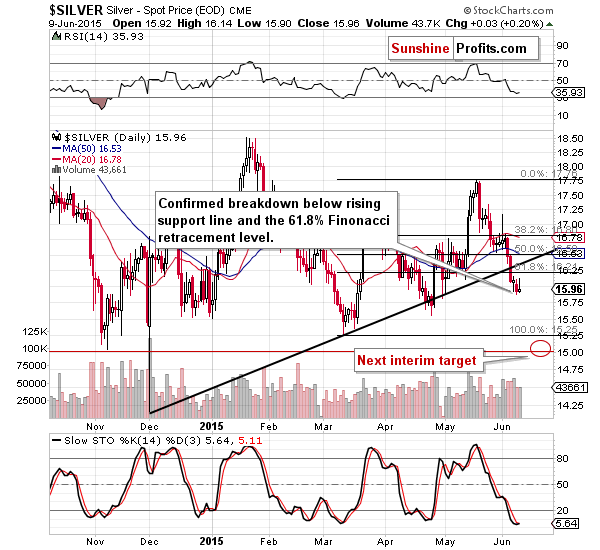
Silver stayed below the rising medium-term support line and the 61.8% Fibonacci retracement level and the breakdowns below them are more than confirmed.
Silver’s previous attempt to move below this line was invalidated and followed by a visible rally, however this time, we have a confirmation of a breakdown, which makes another decline very likely in the following weeks.
What about gold?
Our yesterday’s comments remain up-to-date:
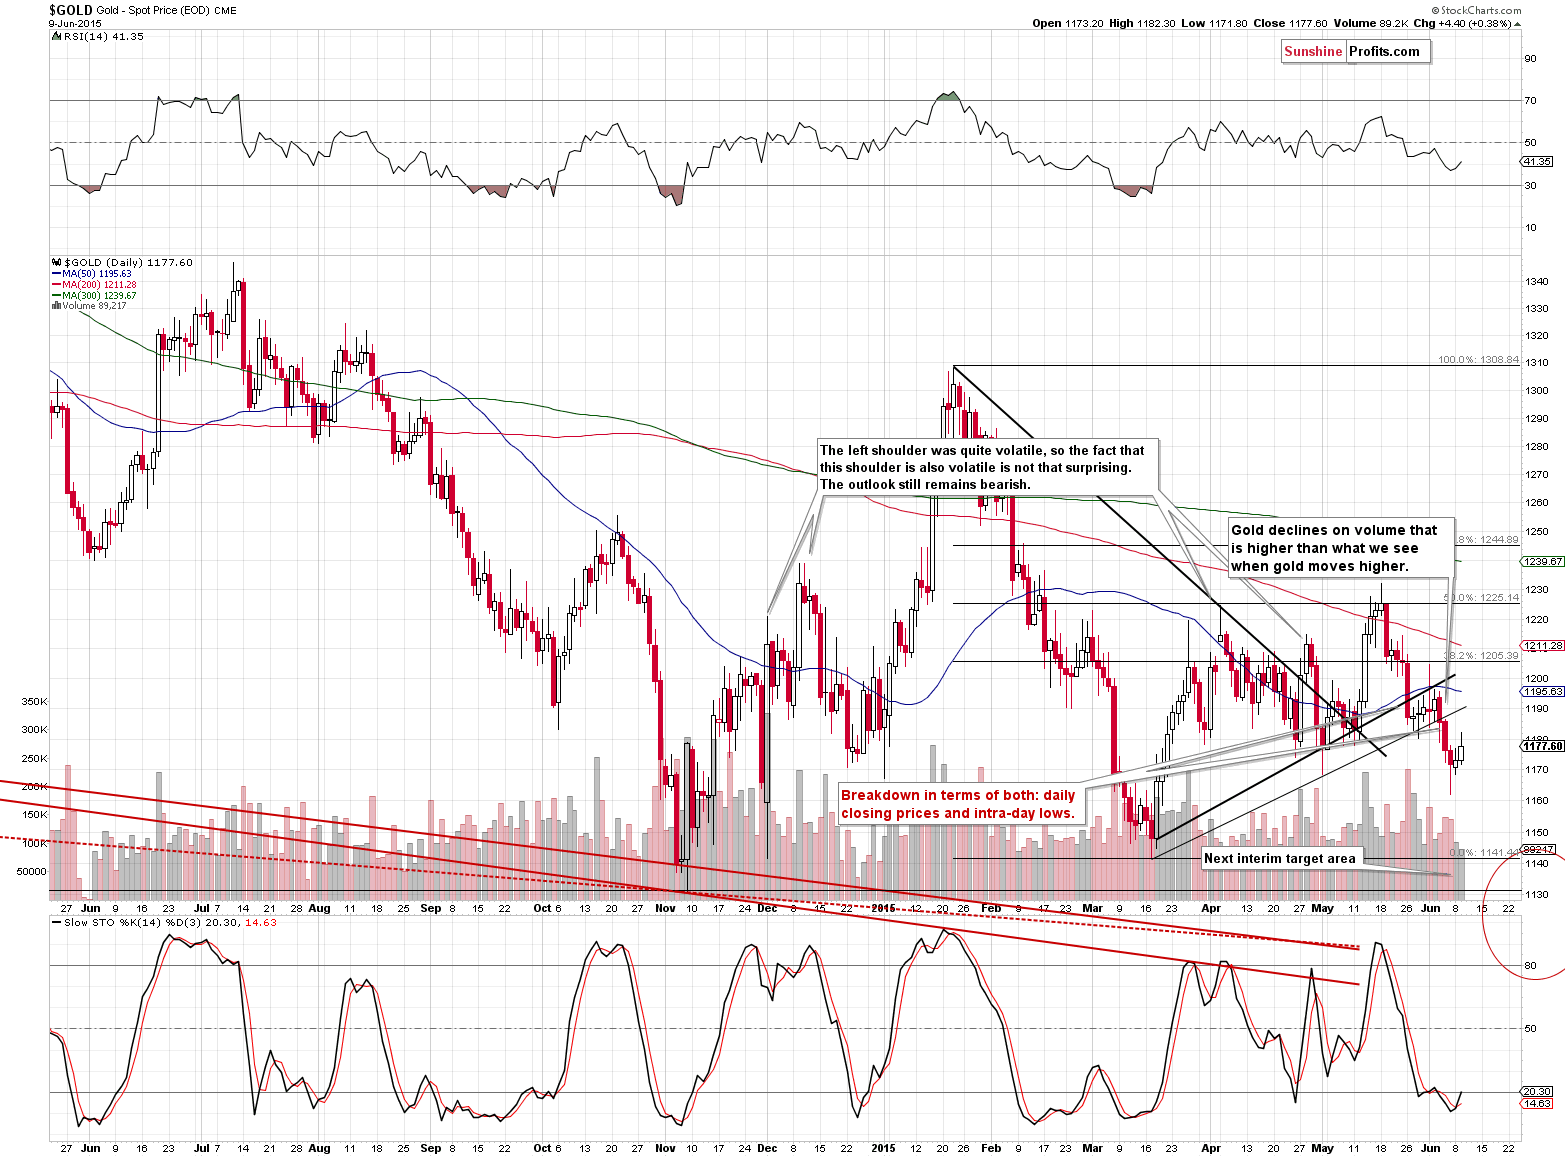
Gold confirmed its breakdowns last week, so the situation here is bearish and it will remain bearish even if we see some very short-term strength. Gold moved a bit higher yesterday [and on Monday], but the move was accompanied by relatively low volume, which suggests that it was just a counter-trend bounce – nothing more. The trend remains down.
Gold moving a bit higher on low volume once again confirms the above and is actually a bearish signal.
As far as the situation in gold stocks is concerned, our yesterday’s comments remain up-to-date as well:
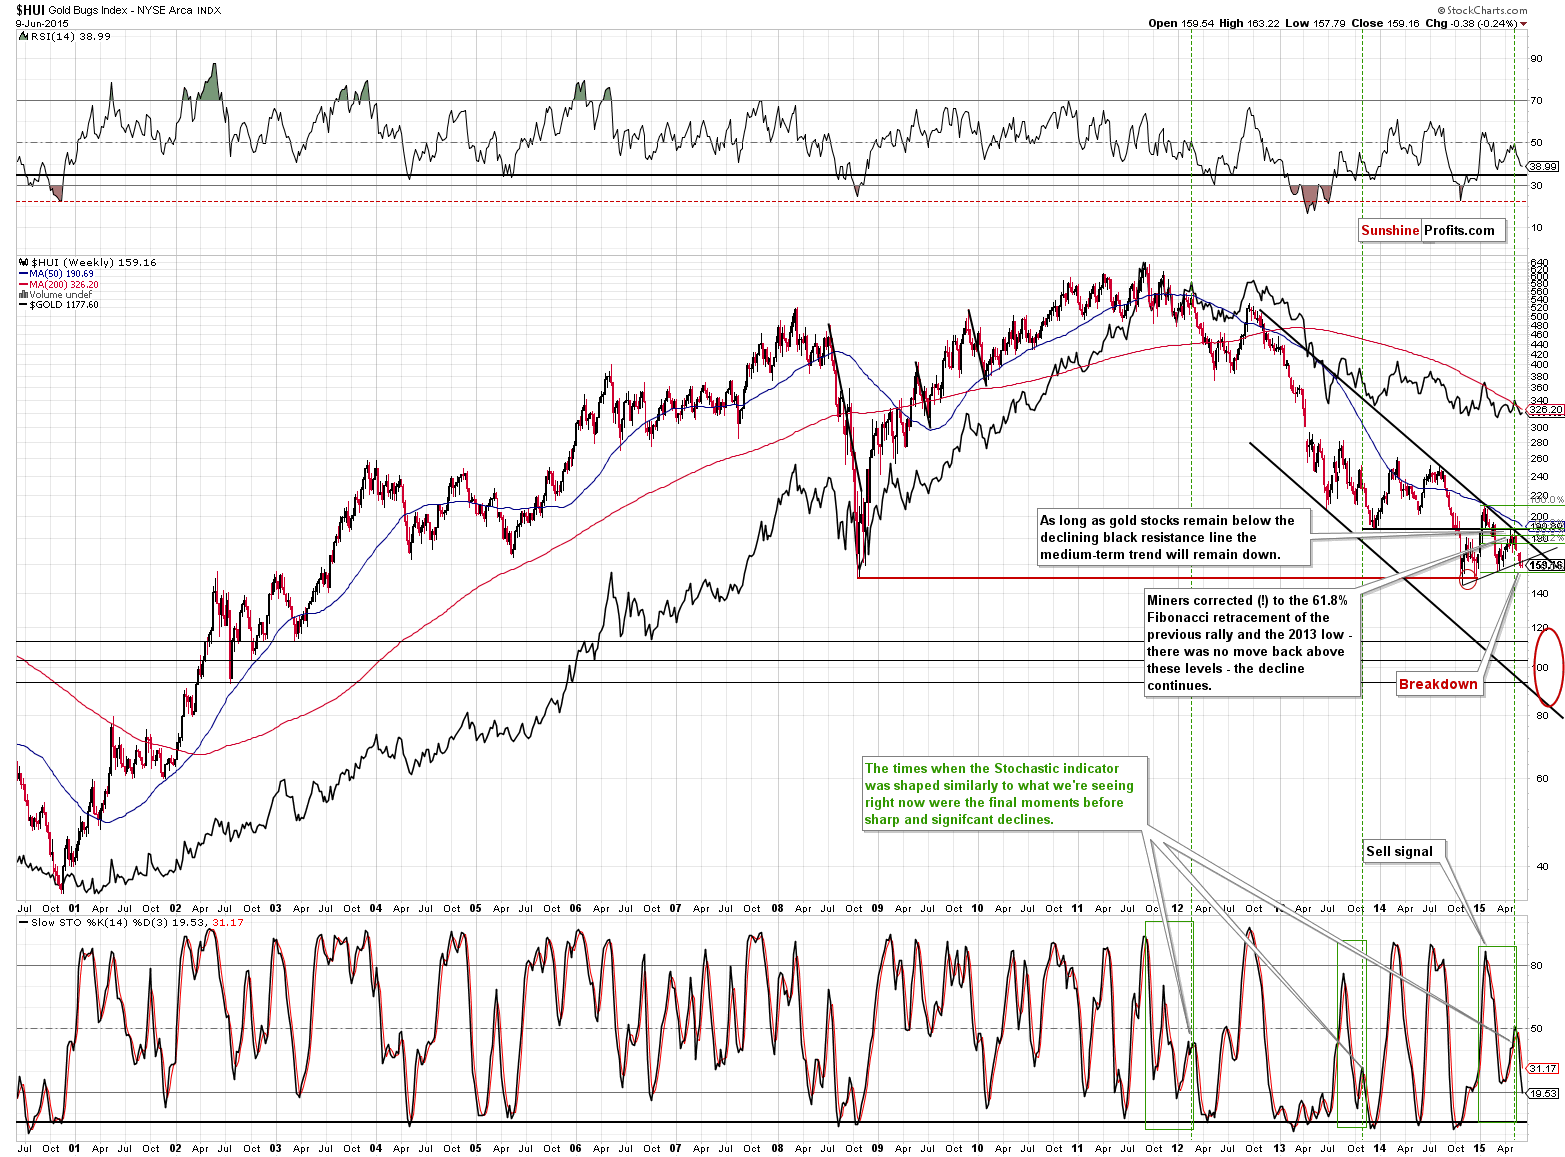
(…) gold stocks have broken below a certain support level. This level is created by the rising line based on the 2014 low and the March 2015 low.
With another daily close below it, we are closer to a confirmation of the breakdown (you will find more about waiting for confirmations in our list of gold trading tips) – the situation is now more bearish, but it will be much more bearish if the breakdown is indeed confirmed.
The HUI Index closed below the rising support line for the third consecutive trading day, so we can say that the breakdown is confirmed. The implications are bearish.
Yesterday we wrote the following regarding the above chart:
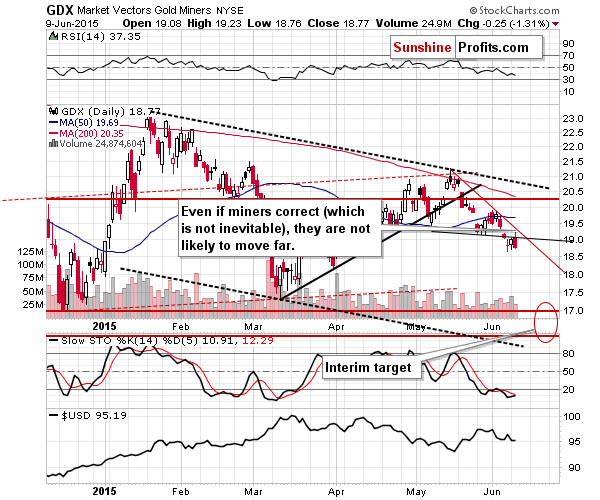
On a short-term basis we see that miners moved a bit higher and the move took place on relatively big volume. We could see some more short-term strength in the next few days, but we don’t expect to see anything significant. The declining red resistance line is relatively close and it seems that it would be able to stop the resulting rally, especially that miners have been underperforming gold for a few weeks now.
The GDX ETF indeed moved to the declining red resistance line and then declined once again. This is particularly bearish given the fact that there was no big slide in the general stock market and gold moved higher on that day. The miners’ underperformance is a bearish sign.
Summing up, the outlook for the precious metals market was bearish yesterday and after yesterday’s session it became – once again - even more bearish. It seems that the final bottom is still ahead of us. The current short positions in the precious metals sector are already profitable but it seems that they will become much more profitable in the future, so we are keeping them intact. After we see another decline, we will quite likely adjust the stop-loss levels and effectively lock-in some gains while keeping the chance of increasing them even further.
We will keep you – our subscribers – updated.
To summarize:
Trading capital (our opinion): Short (full position) position in gold, silver and mining stocks is justified from the risk/reward perspective with the following stop-loss orders and initial (!) target prices:
- Gold: initial target price: $1,115; stop-loss: $1,253, initial target price for the DGLD ETN: $87.00; stop loss for the DGLD ETN $63.78
- Silver: initial target price: $15.10; stop-loss: $18.13, initial target price for the DSLV ETN: $67.81; stop loss for DSLV ETN $38.44
- Mining stocks (price levels for the GDX ETN): initial target price: $16.63; stop-loss: $21.83, initial target price for the DUST ETN: $23.59; stop loss for the DUST ETN $10.37
In case one wants to bet on lower junior mining stocks' prices, here are the stop-loss details and initial target prices:
- GDXJ: initial target price: $21.17; stop-loss: $28.68
- JDST: initial target price: $14.35; stop-loss: $5.65
Long-term capital (our opinion): No positions
Insurance capital (our opinion): Full position
Please note that a full position doesn’t mean using all of the capital for a given trade. You will find details on our thoughts on gold portfolio structuring in the Key Insights section on our website.
As a reminder – “initial target price” means exactly that – an “initial” one, it’s not a price level at which we suggest closing positions. If this becomes the case (like it did in the previous trade) we will refer to these levels as levels of exit orders (exactly as we’ve done previously). Stop-loss levels, however, are naturally not “initial”, but something that, in our opinion, might be entered as an order.
Since it is impossible to synchronize target prices and stop-loss levels for all the ETFs and ETNs with the main markets that we provide these levels for (gold, silver and mining stocks – the GDX ETF), the stop-loss levels and target prices for other ETNs and ETF (among other: UGLD, DGLD, USLV, DSLV, NUGT, DUST, JNUG, JDST) are provided as supplementary, and not as “final”. This means that if a stop-loss or a target level is reached for any of the “additional instruments” (DGLD for instance), but not for the “main instrument” (gold in this case), we will view positions in both gold and DGLD as still open and the stop-loss for DGLD would have to be moved lower. On the other hand, if gold moves to a stop-loss level but DGLD doesn’t, then we will view both positions (in gold and DGLD) as closed. In other words, since it’s not possible to be 100% certain that each related instrument moves to a given level when the underlying instrument does, we can’t provide levels that would be binding. The levels that we do provide are our best estimate of the levels that will correspond to the levels in the underlying assets, but it will be the underlying assets that one will need to focus on regarding the sings pointing to closing a given position or keeping it open. We might adjust the levels in the “additional instruments” without adjusting the levels in the “main instruments”, which will simply mean that we have improved our estimation of these levels, not that we changed our outlook on the markets. We are already working on a tool that would update these levels on a daily basis for the most popular ETFs, ETNs and individual mining stocks.
Our preferred ways to invest in and to trade gold along with the reasoning can be found in the how to buy gold section. Additionally, our preferred ETFs and ETNs can be found in our Gold & Silver ETF Ranking.
As always, we'll keep you - our subscribers - updated should our views on the market change. We will continue to send out Gold & Silver Trading Alerts on each trading day and we will send additional Alerts whenever appropriate.
The trading position presented above is the netted version of positions based on subjective signals (opinion) from your Editor, and the Tools and Indicators.
As a reminder, Gold & Silver Trading Alerts are posted before or on each trading day (we usually post them before the opening bell, but we don't promise doing that each day). If there's anything urgent, we will send you an additional small alert before posting the main one.
=====
Latest Free Trading Alerts:
Although EUR/USD moved sharply lower yesterday, the exchange rate reversed and erased some of earlier gains as uncertainty over Greek debt negotiations weighed on investors’ sentiment. Will we see further deterioration in the coming days?
Forex Trading Alert: EUR/USD vs. Resistance Zone
Bitcoin moved higher yesterday, the volume was up but overall the appreciation didn’t really come in particularly strong. Does this mean that the bounce up is now over?
Bitcoin Trading Alert: Situation in Bitcoin Less Than Intuitive
The beginning of May brought a new 2015 high of $62.58 in crude oil, but we didn’t see a fresh high in case of oil stocks. In the following weeks, crude oil has been trading in a narrow range and erased less than 38.2% of earlier rally. What happened at the same time with the XOI? The index declined sharply and approached the 61.8% Fibonacci retracement in the recent days, showing its weakness in relation to light crude. Are there any factors on the horizon that could drive oil stocks higher or lower in the near future? Is it possible that the stocks-to-oil stocks ratio give us valuable clues about future moves?
What Can We Infer From the Stocks-to-Oil Stocks Ratio?
=====
Hand-picked precious-metals-related links:
How central banks will push up the gold price
=====
In other news:
Fund pros dump government bonds, rout continues
Exchange pushes the pedal to the metal
=====
Thank you.
Sincerely,
Przemyslaw Radomski, CFA
Founder, Editor-in-chief
Gold & Silver Trading Alerts
Forex Trading Alerts
Oil Investment Updates
Oil Trading Alerts

