
Briefly: In our opinion short speculative positions (half) in gold, silver and mining stocks are justified from the risk/reward perspective.
The mining stocks soared once again and they have done so without gold’s help. It seems that the mining stocks’ rally is on everyone’s tongue. No wonder – big rallies are exciting and we are also starting to feel a bit excited about it ourselves. The key to success in trading, however, is taking advantage of emotionality of the market, not following it. Therefore, instead of repeating that miners’ strength is the sign of an inevitable major rally in the sector – let’s focus on keeping as objective and unemotional as possible regarding the investments and focus on the facts. Let’s analyze the market without any biases and as if we didn’t have any trading position at this time - actually it’s always best to approach the market in this way.
Let’s start with the gold chart (charts courtesy of http://stockcharts.com.)
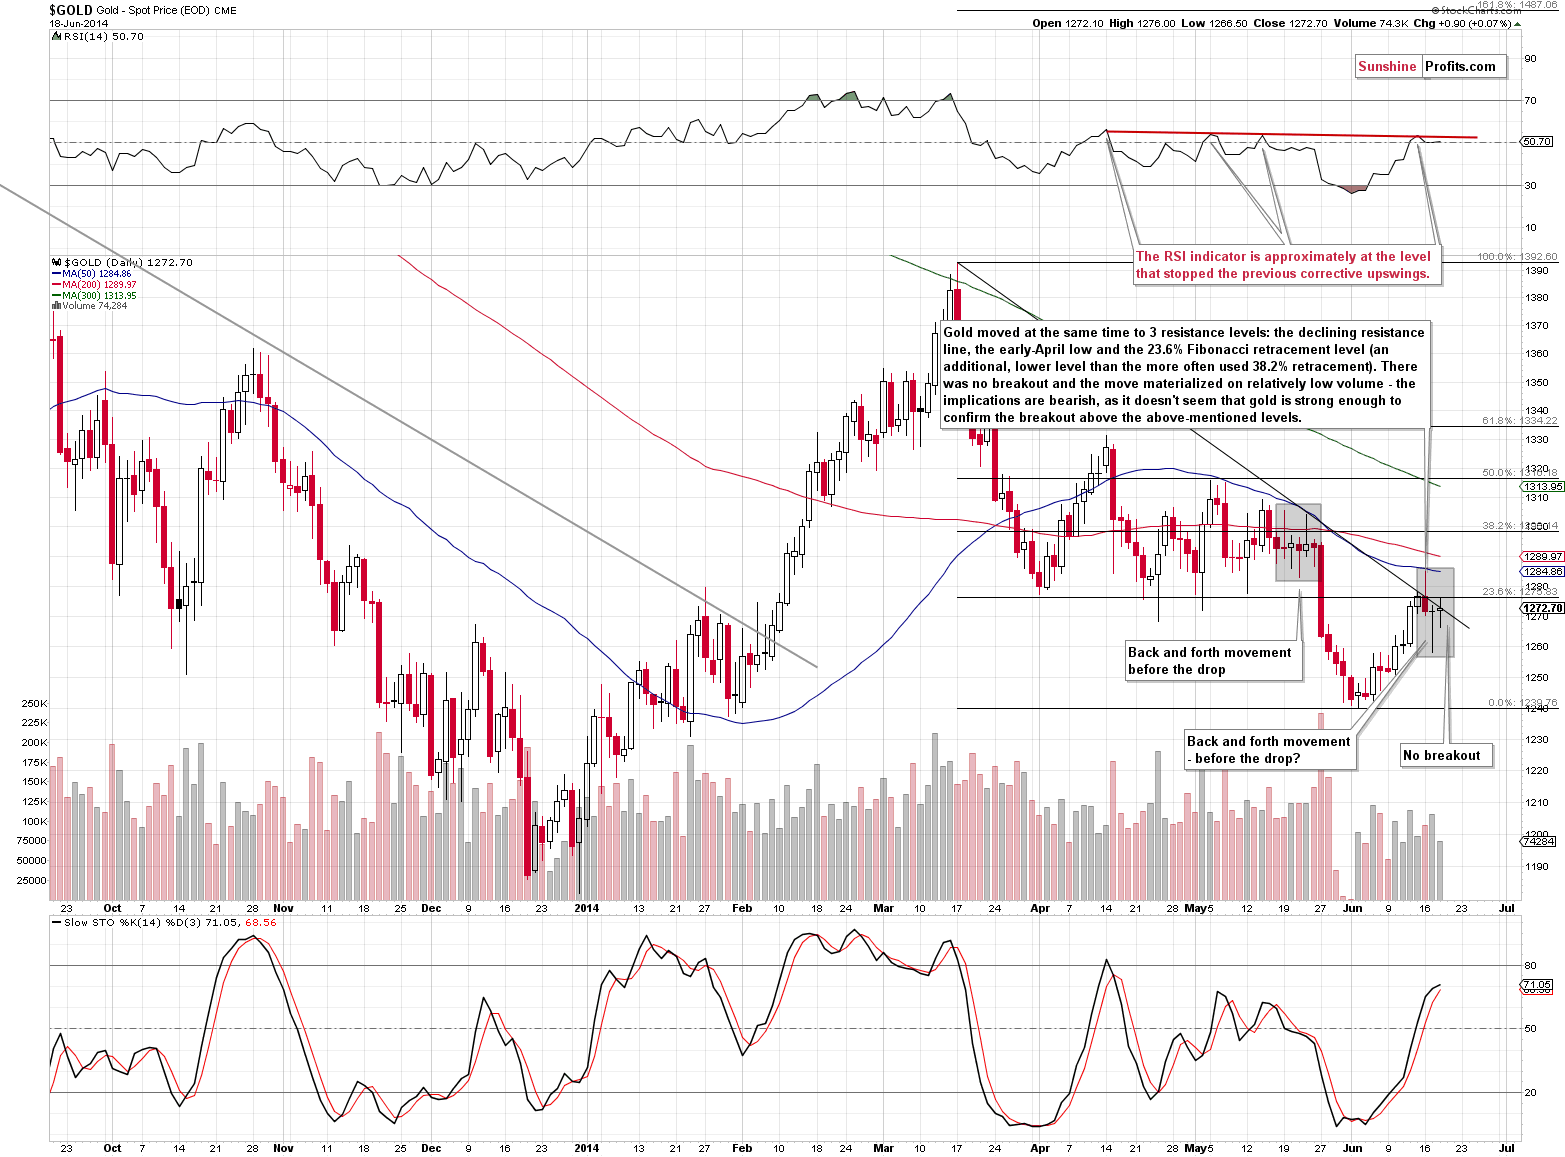
In today’s alert we zoomed the above chart a bit to see if gold has broken above the declining resistance line or not. It hasn’t. Consequently, as far as gold is concerned, absolutely nothing changed based on yesterday’s session, and the outlook remains bearish.
Yesterday, we wrote about the back and forth movement in the form of two intra-day reversals. We saw the continuation of the pattern – gold moved back and forth once again. That’s still in tune with what we’ve seen before the previous big decline, so the short-term implications remain bearish.
Moreover, let’s keep in mind that gold has not really rallied relative to bonds and the same goes for gold price relative to the CCI Index (commodity sector) and gold price relative to the price of crude oil. In fact, it’s very close to its previous lows just waiting to break down. There was no improvement in the gold market.
The gold-USD link has been working against gold this week as well.
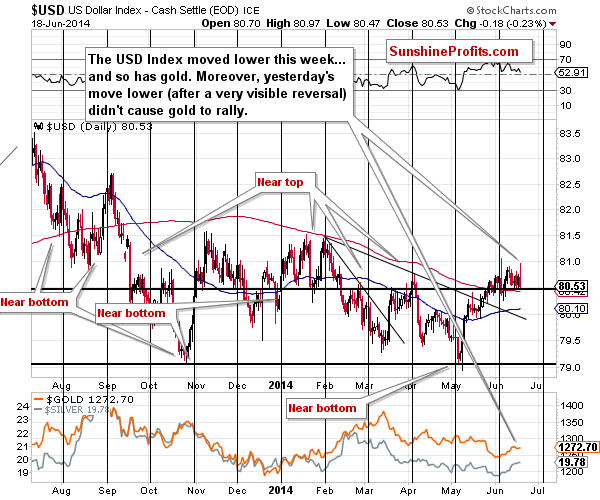
The USD Index moved lower this week and gold moved lower as well. Interestingly, even the big intra-day reversal didn’t trigger a substantial rally in gold. It doesn’t seem like gold is starting a big rally here – if it was the case, it would quite likely respond to dollar’s declines.
Does the most recent decline in the USD Index mean a start of a new downtrend? Based on the USD Index charts, this is unlikely. The USD index is after breakouts above long-, medium-, and short-term resistance lines and they have all been verified.
The analysis of the Euro Index shows that these moves – a small decline in the USD Index and a small rally in the Euro Index – had a very good reason.
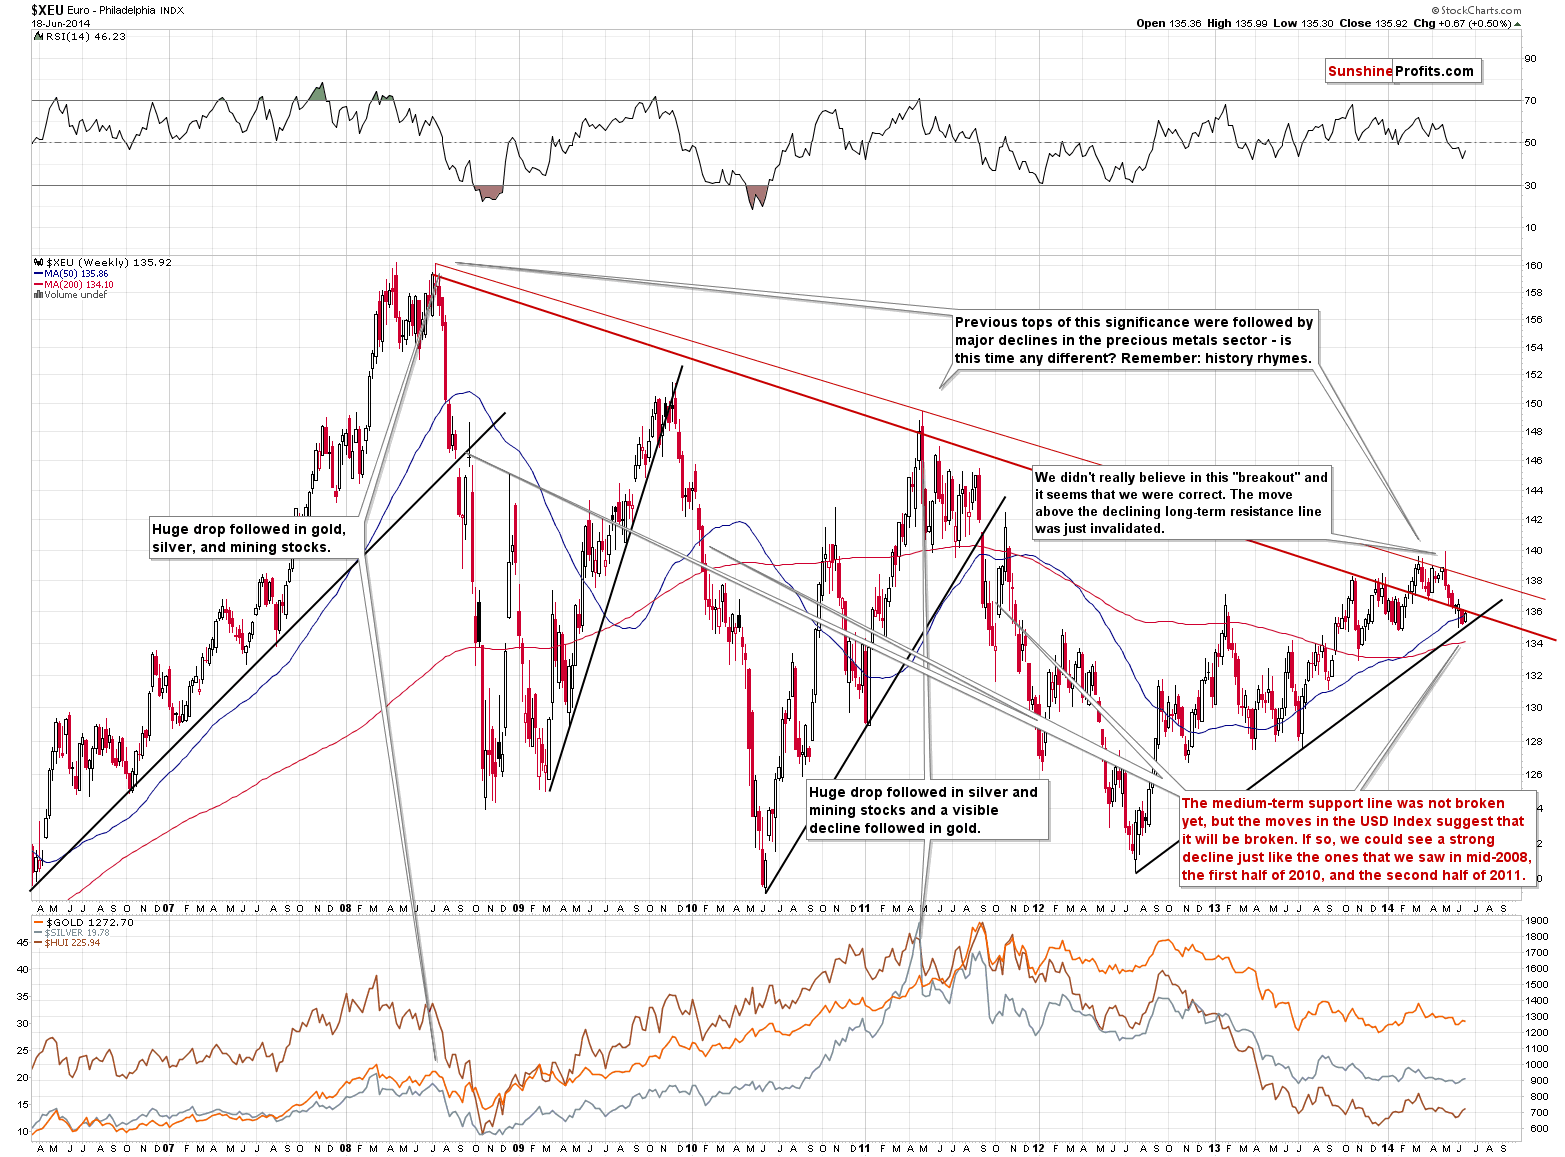
The Euro Index moved a bit higher after moving to the medium-term rising support line, but the rally took the index only to the declining very long-term resistance line. The invalidation of the previous breakout above the latter line is more important than the strength of the support line, so the implications are bearish.
Our previous comments regarding the above chart remain up-to-date:
The European currency is at the critical juncture as it’s been declining for several weeks and it’s now very close to the rising medium-term support line. It seems to us that the invalidation of the breakout above the declining very long-term resistance lines was bearish enough to trigger a breakdown below the support line, but we’ll know (almost) for sure once we see the breakdown and it is confirmed.
Once the Euro Index breaks below the rising support line (which seems likely, but not inevitable), we could see a significant and sharp decline similar to the ones we saw in mid-2008, the first half of 2010, and the second half of 2011. Naturally, the implications for the precious metals market of such a significant decline in the Euro Index would be bearish. If the Euro Index does the unlikely thing – shows strength and rallies – precious metals could move higher as well. However, please keep in mind that the outlook for the USD Index is bullish for the medium term, so the odds are that the move in the Euro Index (which tends to move in the opposite direction at almost all times) will indeed be to the downside.
The above chart suggests most of all that we’re likely to see increased volatility in gold in the coming weeks. The second implication is that gold is likely to decline, but that will become much more probable once we see a breakdown in the Euro Index below the rising medium-term support line.
So, gold and its relationship with currencies provide us with bearish implications. In this case, why does everyone seem so excited? Because the miners rallied and many investors and analysts interpret (!) as a sign of strength on the precious metals market.
Before we feature the charts, let’s recall that there could be a good reason for miners’ strength other than the internal strength of the precious metals sector.
(…) the strong rally in mining stocks could have been caused by the final part of an upswing in the stock market. Mining stocks have been one of the worst performing sectors for the past 2 years or so. It is quite often the case that the worst performing sectors catch up right at the top of the market (just at it is the case that individual companies that didn’t perform well catch up when the sector tops). Consequently, perhaps it was the case that the miners’ rally was just a confirmation of a top in the stock market. It could be just a local top, not necessarily a significant one – but still there could be something other than the internal strength of the precious metals market that caused miners to rally so strongly recently.
Stocks have indeed rallied strongly yesterday, so there is a good non-precious-metals-related reason for miners to move higher.
But – overall – they have moved much higher. Let’s see how much they rallied.
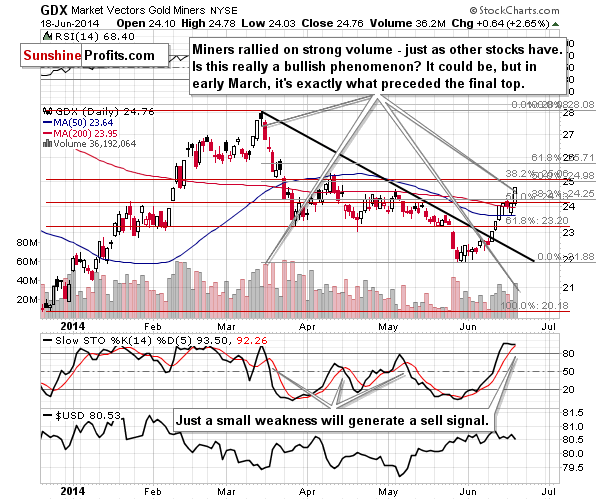
Miners moved higher and the move materialized on high volume. That’s a classic bullish sign. However, the question is how much can we trust this classic sign when it was exactly the same thing that preceded the final top in March. Our reply to this question is that we should remain cautious and not take it at face value.
Let’s keep in mind that the GDX ETF corrected less than half of its March – May decline (definitely less than the 61.8% Fibonacci retracement level), so the current move up is just a correction.
Moreover, the Stochastic indicator is about to flash a sell signal – just one more move lower and we’ll see it – and the last 3 times that we saw it, declines followed.
The thing that is so interesting about miners’ recent rally is their strong performance relative to gold. Let’s examine this major event from 2 perspectives: long- and short-term.
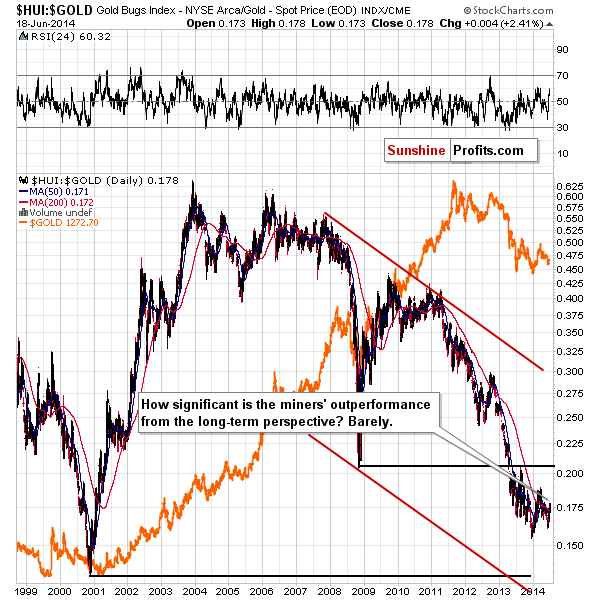
From the long-term perspective, we can finally see the most recent rally in the gold stocks to gold ratio. Seeing it is the most that we can tell about it as it’s still just a blip on the radar screen. It’s so small that even without further analysis it’s clear that at this time it’s nothing more than just a correction, not yet a sign – let alone proof – of a new rally.
The decline in the ratio that has been in place since early 2011 has broken below the key long-term support (2008 low) and verified this breakdown. It is natural to expect the decline to continue until another strong support stops it. There’s only one level on the horizon strong enough to do it and that’s the 2000 low. The ratio will need to decline some more to get there and it seems to us that that it will.
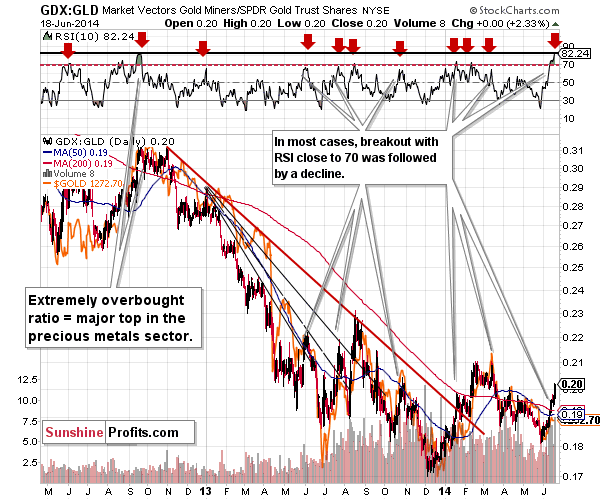
Now, from the short-term perspective, things are much more exciting. The ratio soared sharply and significantly. This means that miners are leading gold higher... Or does it?
It used to work years ago (we were successfully using the above ratio in this way about 4-5 years ago ourselves), but there are no real reasons to believe that this relationship still works. See for yourself. In most cases when the rally was significant enough for the RSI indicator to move to the 70 level, a local top formed – which suggests that during a medium-term decline a visible rally in the miners to gold ratio is a sell signal, not a buy one.
In the past years there was only one case when the RSI indicator was as extremely overbought as it is today – it was in the second half of 2012, when a major top formed. Higher prices were not seen since that time.
Perhaps miners are indeed leading the way. Perhaps it’s a sign of strength. Perhaps the relationship between miners and gold that has been gone for years is back. However, before we see more observations that confirm these changes, we think it’s more appropriate to remain skeptical and assume that things will work just how they used to work recently – and recently (in the past months) – a rally in the miners to gold ratio was not really a good sign.
Summing up, it seems that we are at or quite close to a local top in the precious metals sector. While the medium-term trend in the precious metals market is down, we were likely to see a corrective upswing – and we have. While in the past days it seemed that the corrective upswing was not over yet, we have some signs that it is over now. We have gold at a significant resistance line, we have short-term outperformance in silver, gold has made the headlines and its volatility is very low – and these are all bearish signs.
The only thing that seems exceptionally bullish at the first sight – miners’ strength – is not really that bullish after one examines it more closely. If we didn’t have any short position (and we have a small one – half of the regular position - at this time), we would open one today, because of the extreme reading in the miners to gold ratio, lack of breakout in gold, the medium-term trend in it being down and other factors mentioned today and in the previous alerts.
To summarize:
Trading capital (our opinion): Short positions (half) in gold, silver and mining stocks with the following stop loss orders (please note that we are moving them a bit higher in case of silver and mining stocks):
- Gold: $1,306
- Silver: $20.50
- GDX ETF: $25.9
Long-term capital: No positions
Insurance capital: Full position
Please note that a full position doesn’t mean using all of the capital for a given trade. You will find details on our thoughts on gold portfolio structuring in the Key Insights section on our website.
As always, we'll keep you - our subscribers - updated should our views on the market change. We will continue to send out Gold & Silver Trading Alerts on each trading day and we will send additional Alerts whenever appropriate.
The trading position presented above is the netted version of positions based on subjective signals (opinion) from your Editor, and the automated tools (SP Indicators and the upcoming self-similarity-based tool).
As a reminder, Gold & Silver Trading Alerts are posted before or on each trading day (we usually post them before the opening bell, but we don't promise doing that each day). If there's anything urgent, we will send you an additional small alert before posting the main one.
Thank you.
Sincerely,
Przemyslaw Radomski, CFA
Founder, Editor-in-chief
Gold & Silver Trading Alerts
Forex Trading Alerts
Oil Investment Updates
Oil Trading Alerts

