

Briefly: In our opinion speculative short positions (full) are currently justified from the risk/reward perspective.
Gold and mining stocks declined yesterday and the most interesting thing about this decline was that it happened while the USD Index declined as well. Is gold losing its gleam?
In a way – it does as our short positions are becoming more profitable. But the situation has not become extremely bearish just yet – it’s bearish, but not bearish enough to make us suggest staying entirely out of the precious metals market with one’s long-term investments. Keeping the full short position in speculative terms seems justified, though.
Let’s see why (charts courtesy of http://stockcharts.com).
Yesterday we wrote the following:
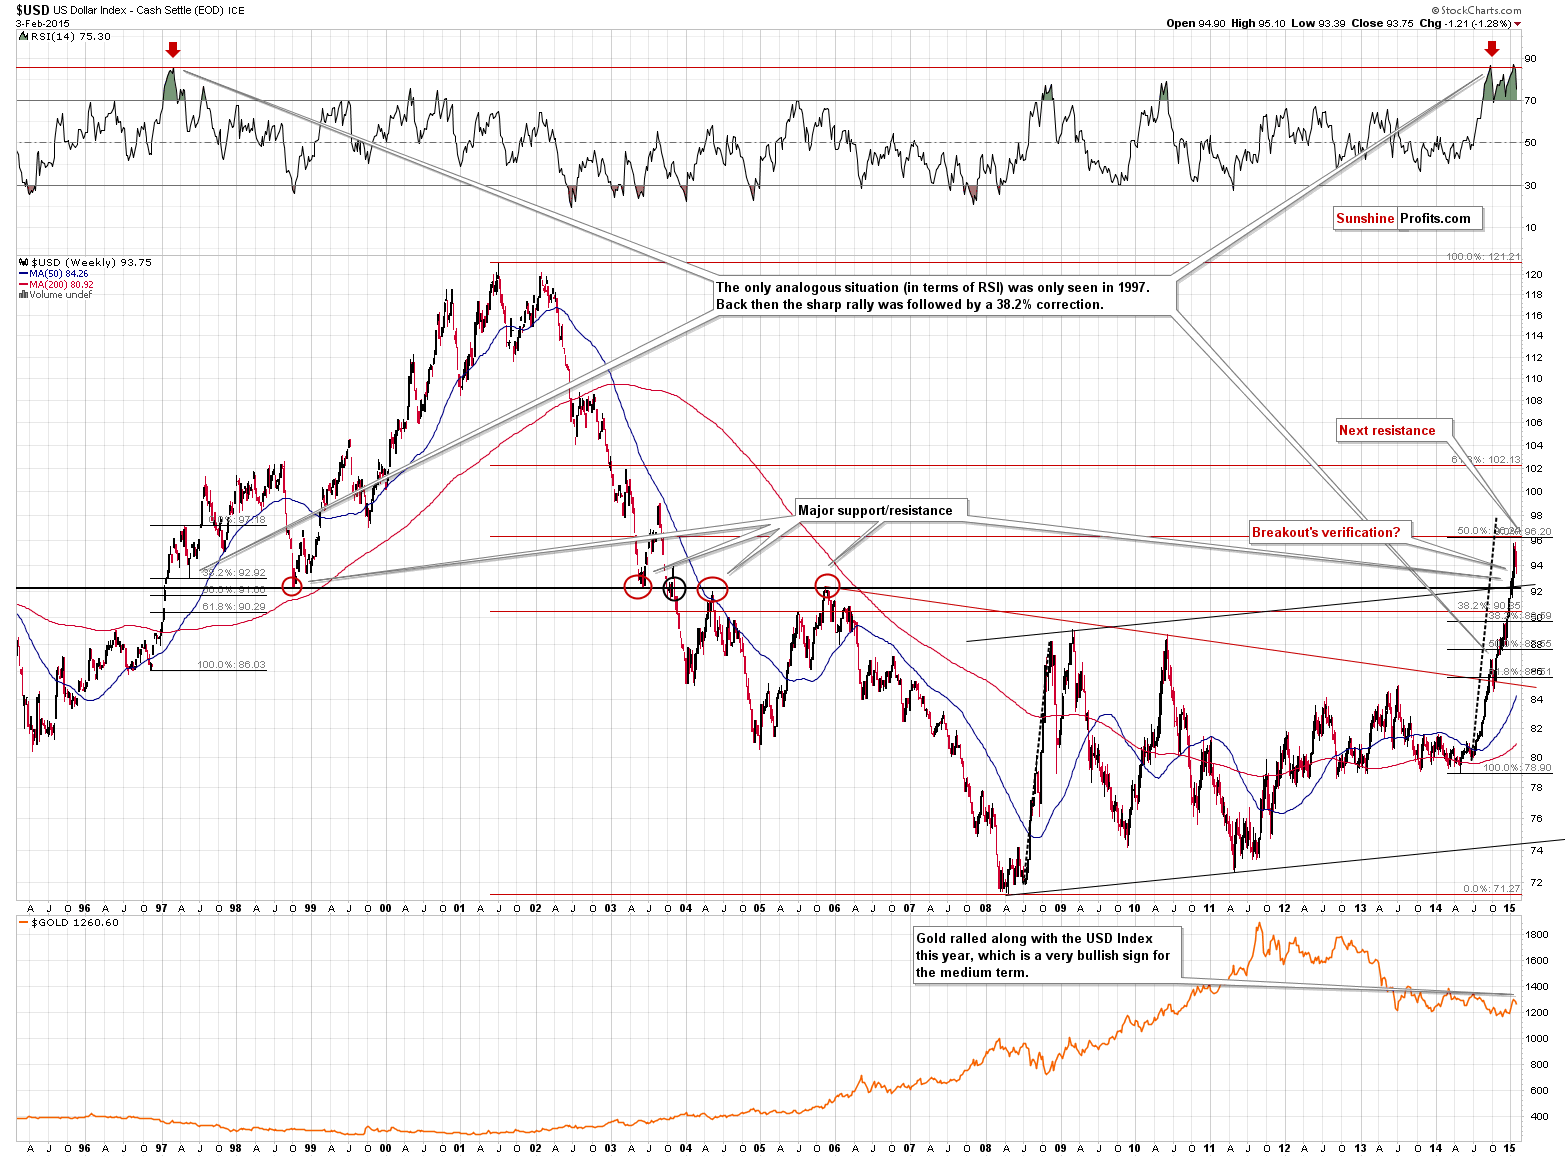
The USD Index has not reached its long-term resistance just yet (96.2), so the odds are that it will rally further (even if not right away), negatively influencing the precious metals prices.
At this time, however, it doesn’t seem that the USD Index has to rally shortly. Since it moved below the short-term rising support line, it seems that it could decline all the way to the long-term support lines before the next local bottom. It could move to the 92.30 level or so before we see a turnaround.
This doesn’t have very bullish implications for gold – if any. Gold previously rallied on the euro weakness, not the USD weakness, so now – with the euro showing some strength – gold could decline.
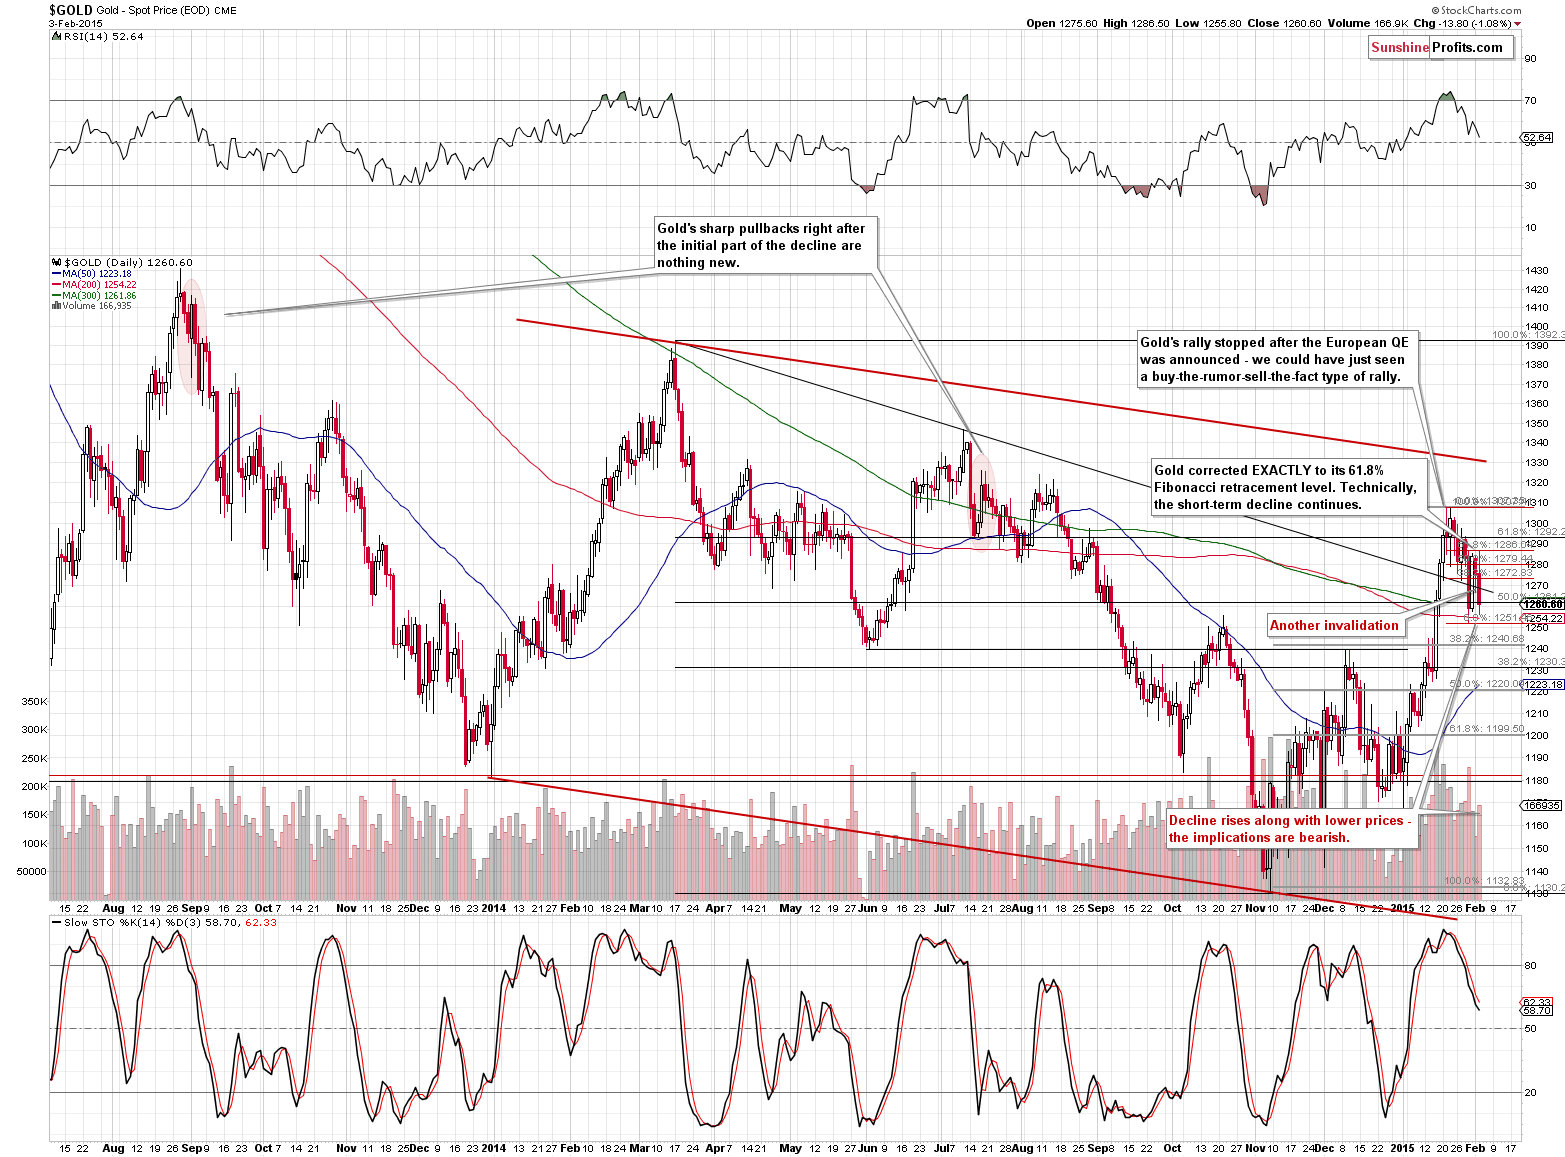
Gold has just once again invalidated the breakout above the declining support/resistance line and the implications are bearish. Gold has also declined on volume that was higher than what we saw during Monday’s upswing, which is also bearish.
Our previous comments on the above chart remain up-to-date:
Gold is once again trying to break above the declining support line, but will it succeed? It rallied on relatively low volume on Friday, so it’s more likely that this move was just a corrective upswing, not a beginning of another rally. Gold didn’t move above the 61.8% retracement from the previous downswing, so the short-term decline remains in place also from this perspective.
Please note that it’s not uncommon for gold to correct sharply after the initial decline after an important local top. The same was the case in mid-2013 and mid-2014.
It seems that profits from the current short position were lowered only temporarily.
(…)
How low can it go? It might be best to keep the short position intact until we see bullish signs, but at this time the highest of the target prices is the first Fibonacci retracement level – close to $1,240. The $1,200 level, which is approximately the 61.8% retracement, is even more likely to stop the current decline. Still, it seems that we are not seeing a local top in the USD Index and gold keeps declining, so perhaps we will see a move even below the 2014 lows. We will be monitoring the market for signs of strength and report to you accordingly.
Since gold declined on Tuesday, the sell signal from the Stochastic indicator became even more visible. The bearish implications and yesterday’s comments remain up-to-date:
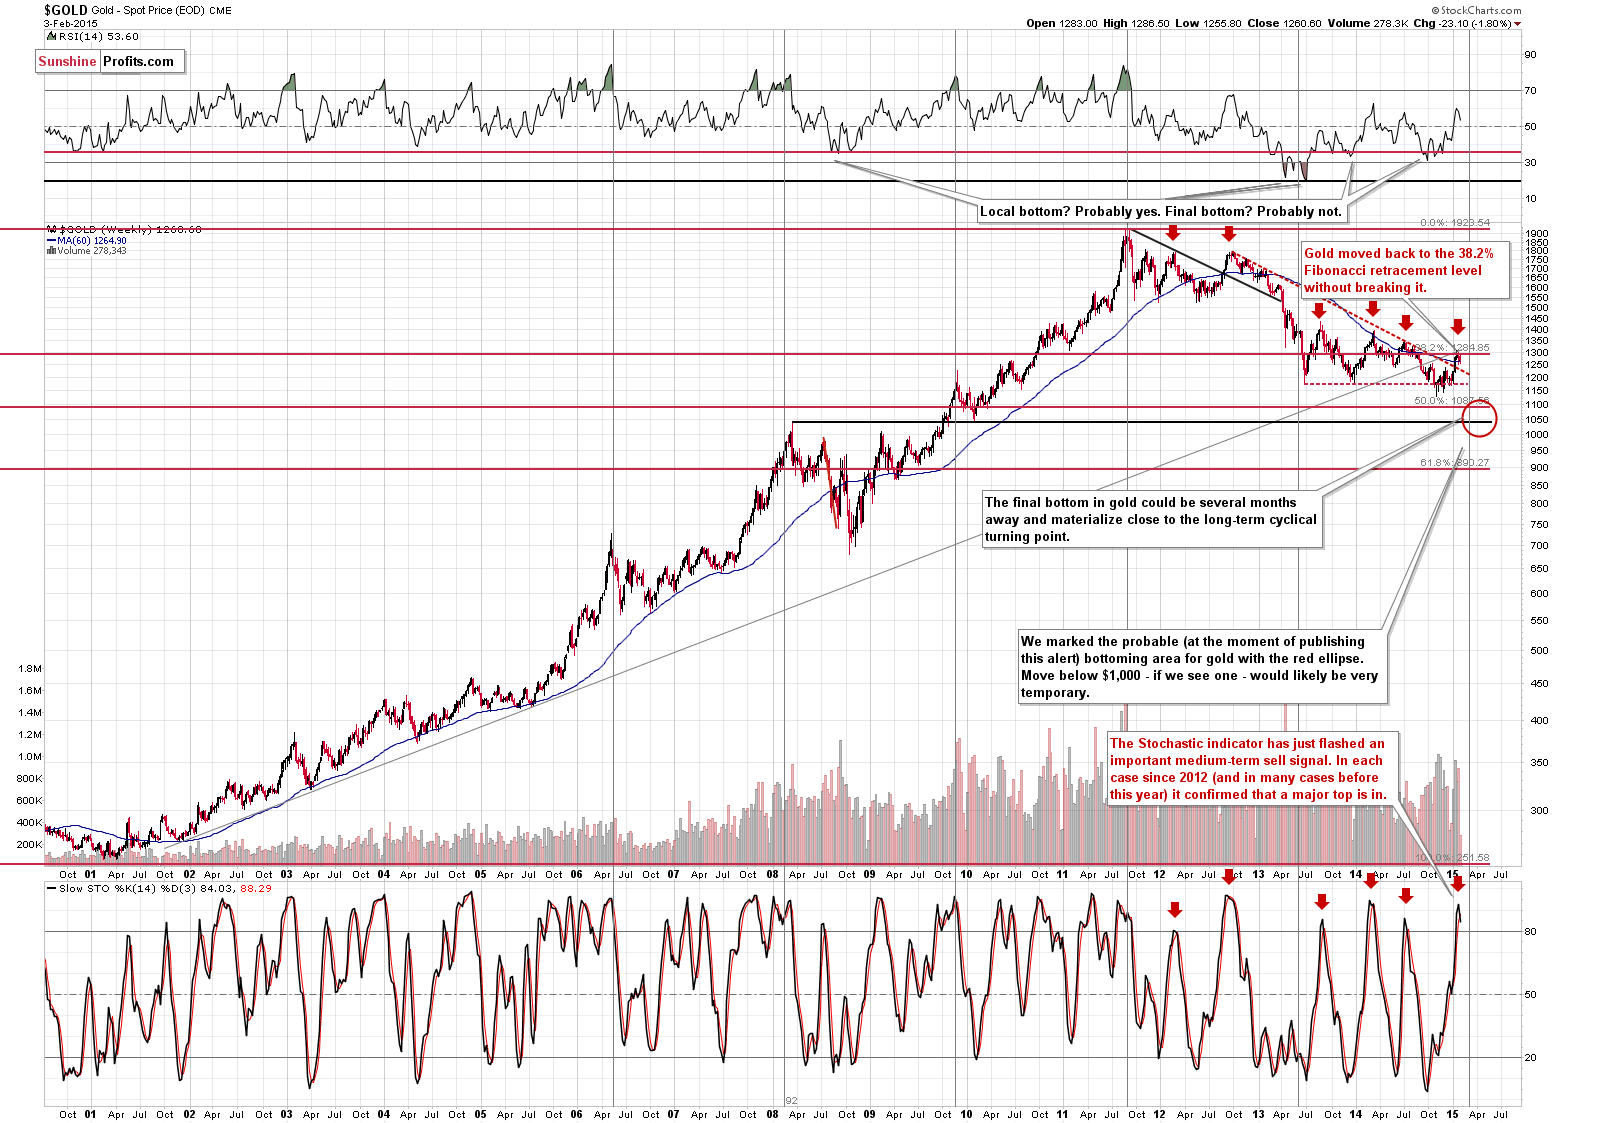
The Stochastic indicator just flashed a sell signal. That doesn’t seem to be a big deal until you consider what has happened each time since 2012 when we saw this signal. We saw major tops. All of them, actually. So, has gold formed a top recently? As always, there are no sure bets in any market, but “this time is different” is often a quite costly phrase, especially given a high efficiency of a given technique (like in this case). The indicator is based on weekly closing prices, so the signal will be fully confirmed after Friday’s close, but gold would have to move much higher in order for the Stochastic indicator not to flash the sell signal and the resistance is very close.
Moreover, please note that the last 2 major tops were formed after gold moved a bit above the 60-week moving average. This is exactly what happened recently – gold moved above this level.
(…)
From the long-term perspective, we see that [on Friday] gold moved back to the 38.2% retracement based on the entire 2001-2011 rally but didn’t close above it. Consequently, there are no changes in the above picture (…).
Let’s keep in mind that gold is quite likely to decline based on the long-term cyclical turning point. It seems probable that the next major bottom will be formed within the next several months – please see how effective these turning points were in the past cases.
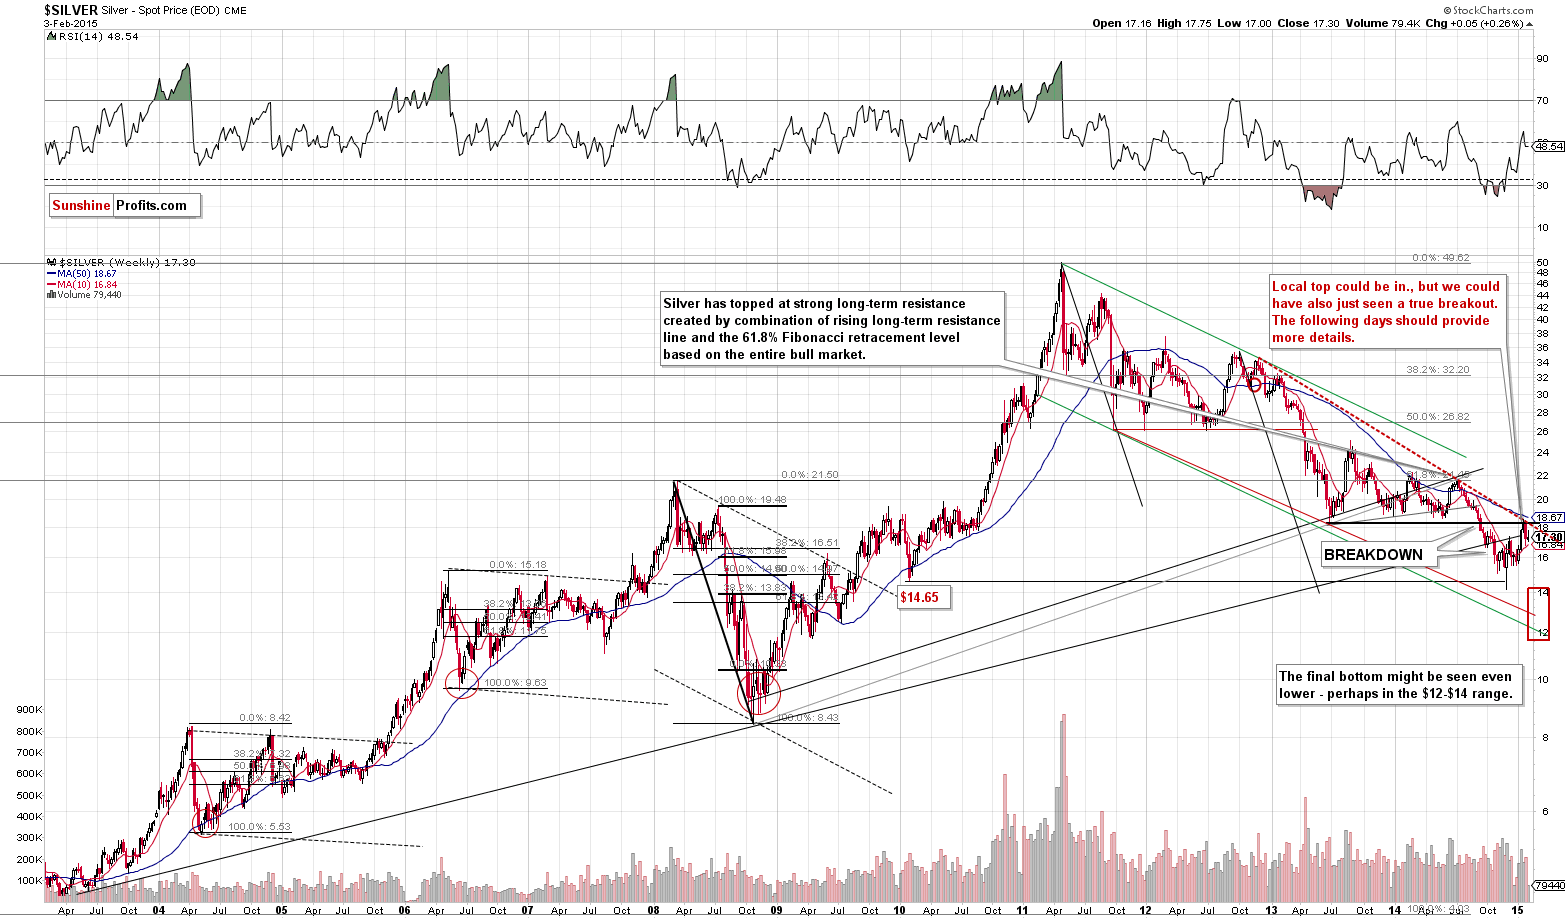
The situation in the silver market didn’t change and the outlook remains bearish. Silver showed some strength on Tuesday before the session started but it didn’t manage to hold these gains for long. The white metal closed below the rising long-term resistance/support line, so basically nothing changed and the outlook remains bearish.
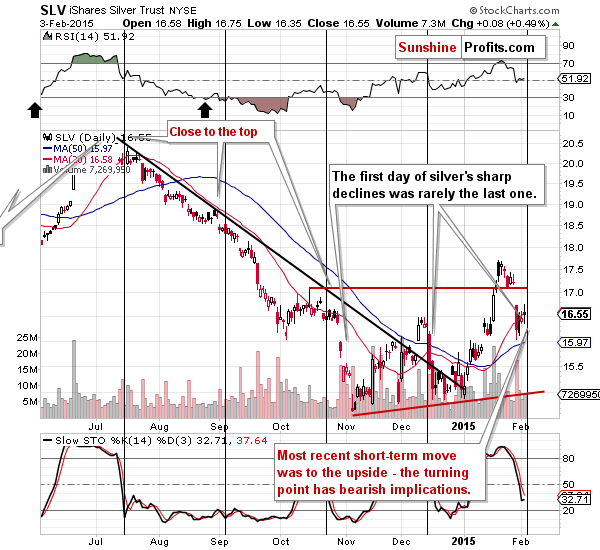
On a short-term basis, we see an additional bearish sign. While it may seem counter-intuitive, the most recent move up has bearish implications. The reason is the current cyclical turning point. When silver declined, we were rather unsure if silver would slide right before the turning point or correct and then decline once again after the turning point – it seems that the latter will take place. Since the most recent move was to the upside, it seems that silver will now decline once again.
Moving on to the mining stocks, it seems that we’ve just seen a bearish confirmation. We have previously written the following:
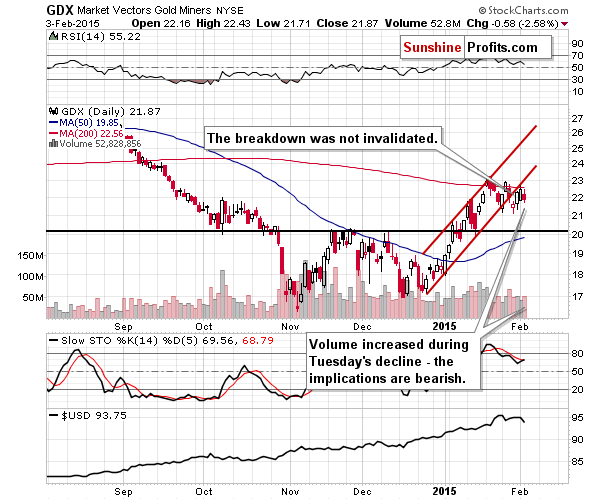
Mining stocks moved higher, but the volume was not huge, it doesn’t serve as a confirmation of the rally and – most importantly – the breakdown below the rising support line was not invalidated. Consequently, the bearish signal that we got when the breakout materialized remains in place.
The breakdown is now confirmed as the GDX ETF has closed for the third time below the rising support/resistance line. Moreover, mining stocks moved lower on volume that was a bit higher than what we had seen during the previous day’s rally and this has bearish implications.
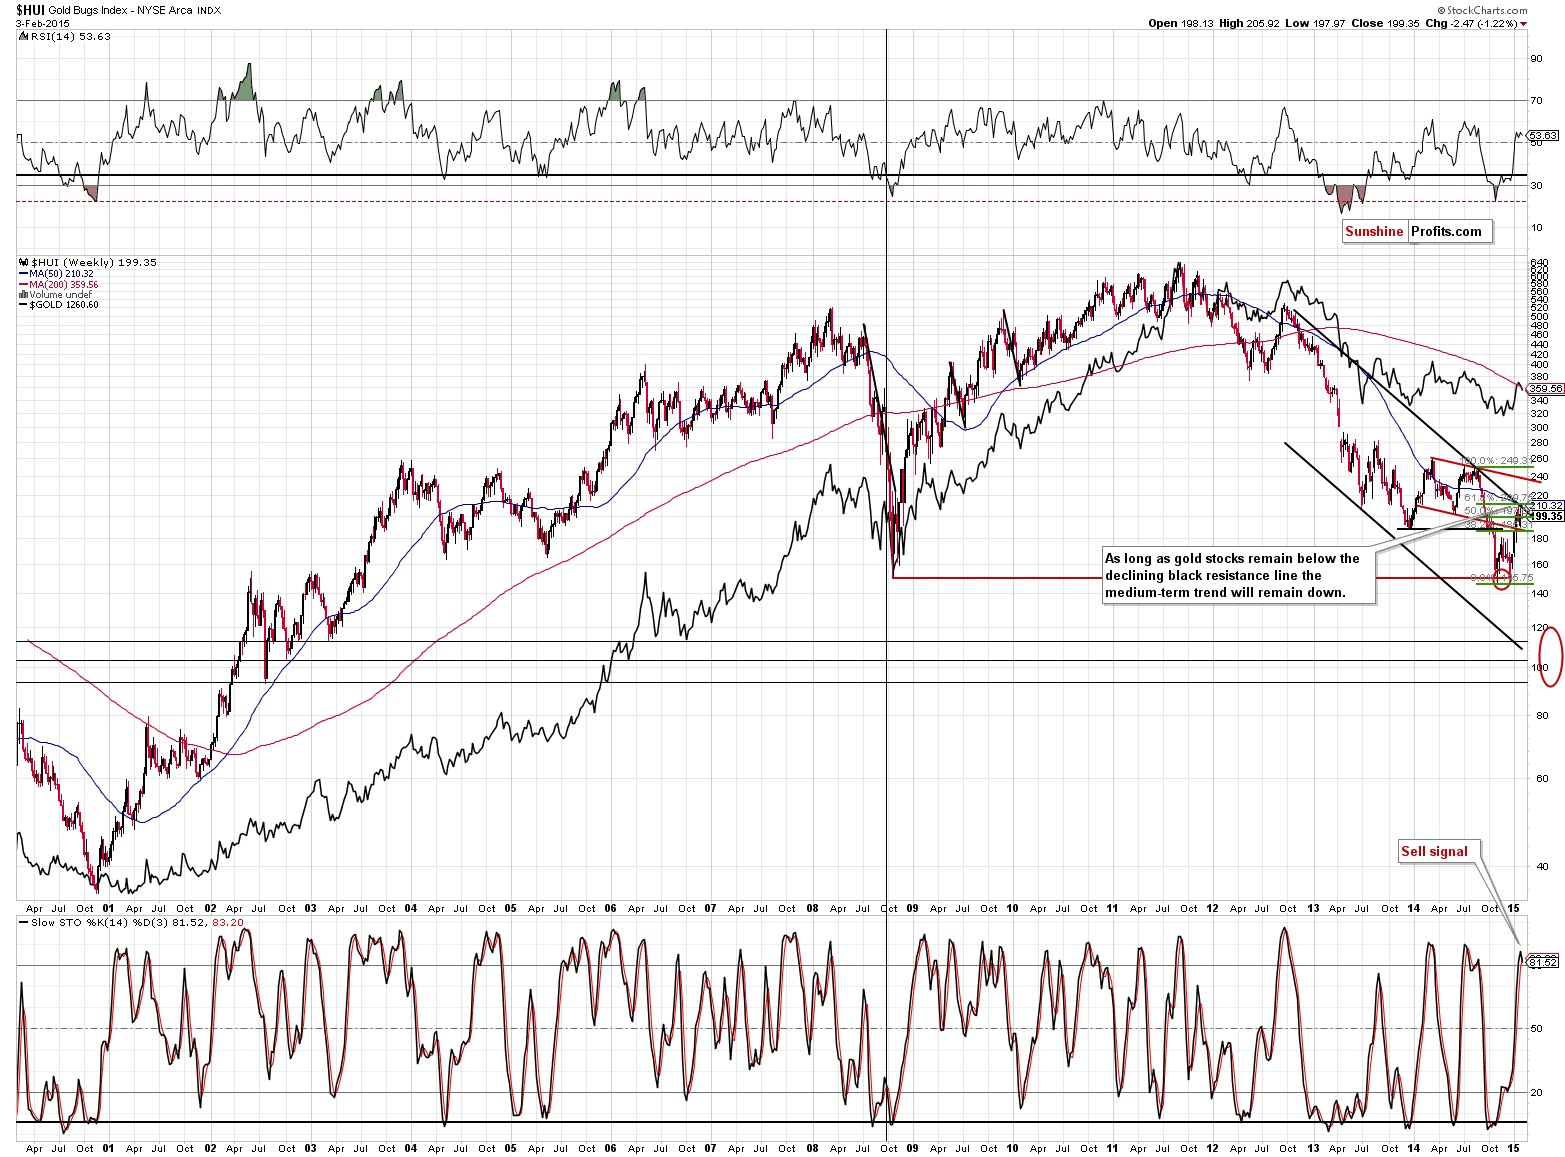
There are no changes from the long-term point of view – the medium-term trend remains down as the declining resistance line remains unbroken.
Yesterday, we wrote that the HUI Index was practically at the declining resistance line, which means that it was quite likely to decline from there. It has – the decline is not huge yet, but it’s once again a few index points below the declining resistance line. The important thing is that we have just seen a sell signal from the Stochastic indicator, which serves as a bearish confirmation of the same signal that we have recently seen in gold. The bearish implications remain in place and so do our previous comments:
(…) it is possible that we will see a breakout but it’s not likely. A trend remains in place and has certain implications until there is clear evidence (a confirmed breakout) that it was broken. Since we see gold stocks right at the resistance and there was no breakout – the implications are bearish.
Last, but not the least, is the chart featuring the gold to oil ratio. Before we comment on it, we would like to feature what we wrote about it about a month ago, in the January Oil Investment Update:
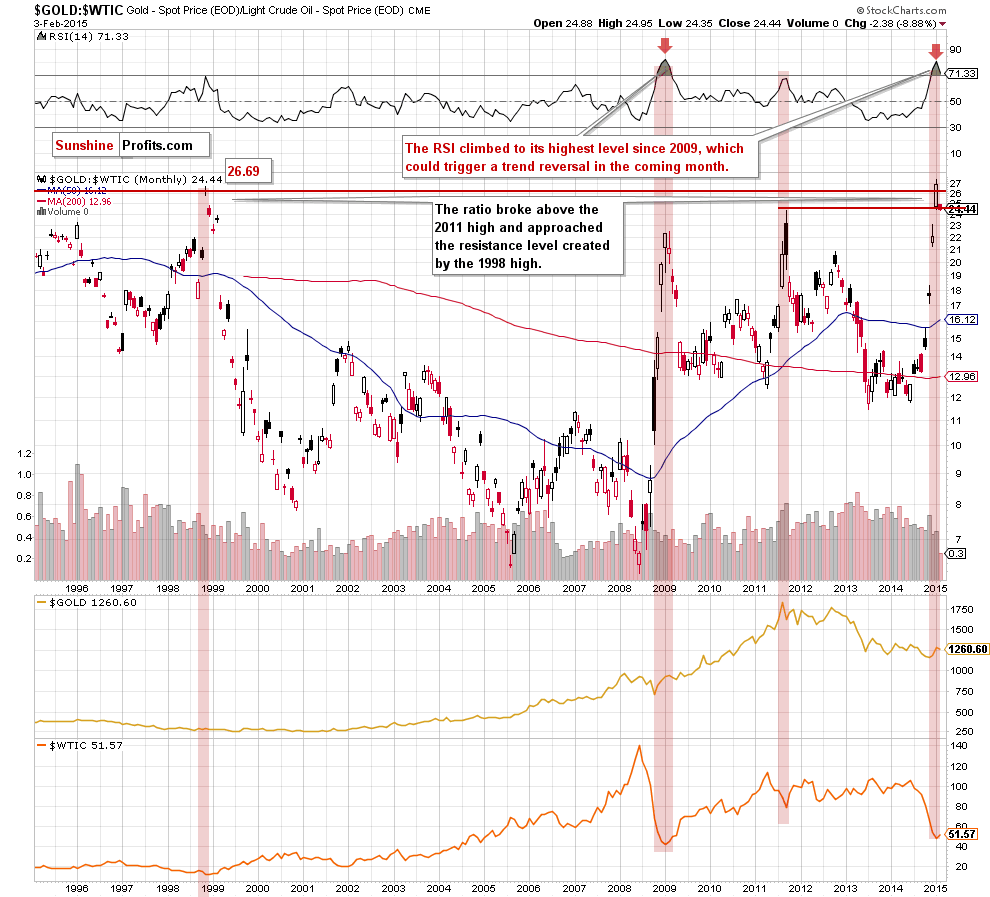
As you see on the monthly chart, the ratio broke above the 2011 high and approached the resistance level created by the 1998 high, which could pause (or even stop) further improvement and trigger a bigger correction in the ratio in the coming weeks. This scenario is currently reinforced by the position of the RSI, which climbed to its highest level since 2009. In the previous years, similar (or even lower) readings of the indicator preceded tops in ratio and local bottoms in crude oil. Therefore, as we have pointed out before, it seems to us that the next move in the ratio will be to the downside, which will push crude oil higher.
Crude oil has indeed moved a bit higher since the above was posted, but there are also other implications that precious metals investors have to keep in mind.
The times when the gold to oil ratio was as high as it has been recently were the times when we saw major tops in gold and major bottoms in oil (or at least they were at hand). The ratio was likely to move lower – and it has. It invalidated the breakout above the 1998 high, which is a major bearish signal. The RSI based on the gold to oil ratio was heavily oversold and moved back below the 70 level, thus confirming the change in the trend. No matter how we slice it, it seems that an important top in gold is right behind us.
Summing up, the outlook for the precious metals sector deteriorated further as gold declined along with the USD Index, invalidating a breakout above the declining medium-term resistance line and due to the sell signal from the Stochastic indicator based on the HUI Index. It seems precious metals and mining stocks will move lower in the short run, perhaps much lower. If gold continues to slide along with the USD Index, we might exit the long-term investment positions (the half that is invested at this time), but it’s too early for that just now.
We will be re-evaluating these positions on a daily basis and if we think that the situation no longer justifies keeping speculative short positions or that adjustments to the long-term investment capital are necessary, we’ll let you know. As always, we’ll keep you – our subscribers – informed.
To summarize:
Trading capital (our opinion): Short positions (full) in gold, silver and mining stocks with the following stop-loss orders and initial (!) target prices:
- Gold: initial target level: $1,245; stop-loss: $1,318, initial target level for the DGLD ETN: $64.60 ; stop loss for the DGLD ETN $55.00
- Silver: initial target level: $16.13 ; stop-loss: $18.63, initial target level for the DSLV ETN: $62.07 ; stop loss for DSLV ETN $41.94
- Mining stocks (price levels for the GDX ETN): initial target level: $20.40 ; stop-loss: $24.23, initial target level for the DUST ETN: $15.55 ; stop loss for the DUST ETN $9.28
In case one wants to bet on lower junior mining stocks' prices, here are the stop-loss details and initial target prices:
- GDXJ: initial target level: $25.43 ; stop-loss: $32.17
- JDST: initial target level: $10.50 ; stop-loss: $5.19
Long-term capital (our opinion): Half positions in gold, half positions in silver, half position in platinum and half position in mining stocks.
Insurance capital (our opinion): Full position
Please note that a full position doesn’t mean using all of the capital for a given trade. You will find details on our thoughts on gold portfolio structuring in the Key Insights section on our website.
As a reminder – “initial target price” means exactly that – an “initial” one, it’s not a price level at which we suggest closing positions. If this becomes the case (like it did in the previous trade) we will refer to these levels as levels of exit orders (exactly as we’ve done previously). Stop-loss levels, however, are naturally not “initial”, but something that, in our opinion, might be entered as an order.
Since it is impossible to synchronize target prices and stop-loss levels for all the ETFs and ETNs with the main markets that we provide these levels for (gold, silver and mining stocks – the GDX ETF), the stop-loss levels and target prices for other ETNs and ETF (among other: UGLD, DGLD, USLV, DSLV, NUGT, DUST, JNUG, JDST) are provided as supplementary, and not as “final”. This means that if a stop-loss or a target level is reached for any of the “additional instruments” (DGLD for instance), but not for the “main instrument” (gold in this case), we will view positions in both gold and DGLD as still open and the stop-loss for DGLD would have to be moved lower. On the other hand, if gold moves to a stop-loss level but DGLD doesn’t, then we will view both positions (in gold and DGLD) as closed. In other words, since it’s not possible to be 100% certain that each related instrument moves to a given level when the underlying instrument does, we can’t provide levels that would be binding. The levels that we do provide are our best estimate of the levels that will correspond to the levels in the underlying assets, but it will be the underlying assets that one will need to focus on regarding the sings pointing to closing a given position or keeping it open. We might adjust the levels in the “additional instruments” without adjusting the levels in the “main instruments”, which will simply mean that we have improved our estimation of these levels, not that we changed our outlook on the markets. We are already working on a tool that would update these levels on a daily basis for the most popular ETFs, ETNs and individual mining stocks.
Our preferred ways to invest in and to trade gold along with the reasoning can be found in the how to buy gold section. Additionally, our preferred ETFs and ETNs can be found in our Gold & Silver ETF Ranking.
As always, we'll keep you - our subscribers - updated should our views on the market change. We will continue to send out Gold & Silver Trading Alerts on each trading day and we will send additional Alerts whenever appropriate.
The trading position presented above is the netted version of positions based on subjective signals (opinion) from your Editor, and the automated tools (SP Indicators and the upcoming self-similarity-based tool).
As a reminder, Gold & Silver Trading Alerts are posted before or on each trading day (we usually post them before the opening bell, but we don't promise doing that each day). If there's anything urgent, we will send you an additional small alert before posting the main one.
=====
Latest Free Trading Alerts:
Yesterday, the U.S. Census Bureau showed that factory orders dropped by 3.4% in December, missing expectations for a decline of 2.2%. Thanks to these numbers, EUR/USD moved sharply higher, breaking above important resistance levels. Will we see a comeback above 1.1600 in the coming days?
Forex Trading Alert: EUR/USD – Time For Recovery
=====
Hand-picked precious-metals-related links:
Swiss Exported 1,746 Tons of Gold, Russian Deliveries Raise Questions
BofA: Brace for gold 'singularity' if Fed doesn't tighten
=====
In other news:
The Treasury Market's Legendary Liquidity Has Been Drying Up
China cuts bank reserves to 'keep economy stable'
Greece has started debt-swap talks with IMF, minister tells paper
Dark-Pool Trade Size Doubles in Europe as Venues Hunt Blocks
=====
Thank you.
Sincerely,
Przemyslaw Radomski, CFA
Founder, Editor-in-chief
Gold & Silver Trading Alerts
Forex Trading Alerts
Oil Investment Updates
Oil Trading Alerts

