

Briefly: In our opinion speculative short positions (full) are currently justified from the risk/reward perspective.
Yesterday’s session was a tricky one. Gold initially declined, then came back with a vengeance only to slide once again right before the end of the session, but… The real trick is that while the traders were occupied with short-term price swings, they missed (or at least it seems that most of them did) something much bigger.
A major sell signal was seen for gold in the Stochastic indicator and we are very close to seeing one in the HUI Index. Before discussing the above, let’s take a look at the USD Index (charts courtesy of http://stockcharts.com).
Yesterday we wrote the following:
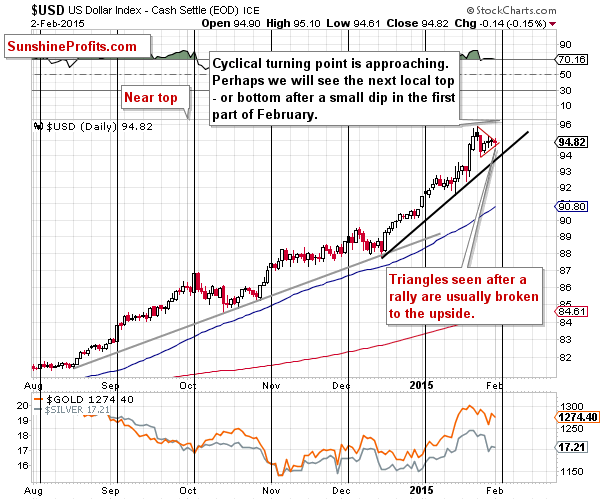
The USD Index has not reached its long-term resistance just yet (96.2), so the odds are that it will rally further (even if not right away), negatively influencing the precious metals prices.
It seems that the USD Index formed a short-term triangle pattern, which is usually followed by a continuation of the previous move, especially when this move was a rally.
In the past weeks gold and the USD have moved higher together, but taking the last week into account makes us view the likely move higher in the USD as a bearish factor for the precious metals market.
The cyclical turning point is very close, so the current short-term consolidation is likely coming to an end. If the USD Index moves lower, then the support line will be very close – at about 94. If it moves higher (which seems likely), it will be likely to move much higher – above the 96 level.
On a short-term basis, not much changed in gold. The yellow metal moved back and forth without decisive action. Overall, gold declined on low volume, which has neither bearish, nor bullish implications. Our previous comments on the above chart remain up-to-date:
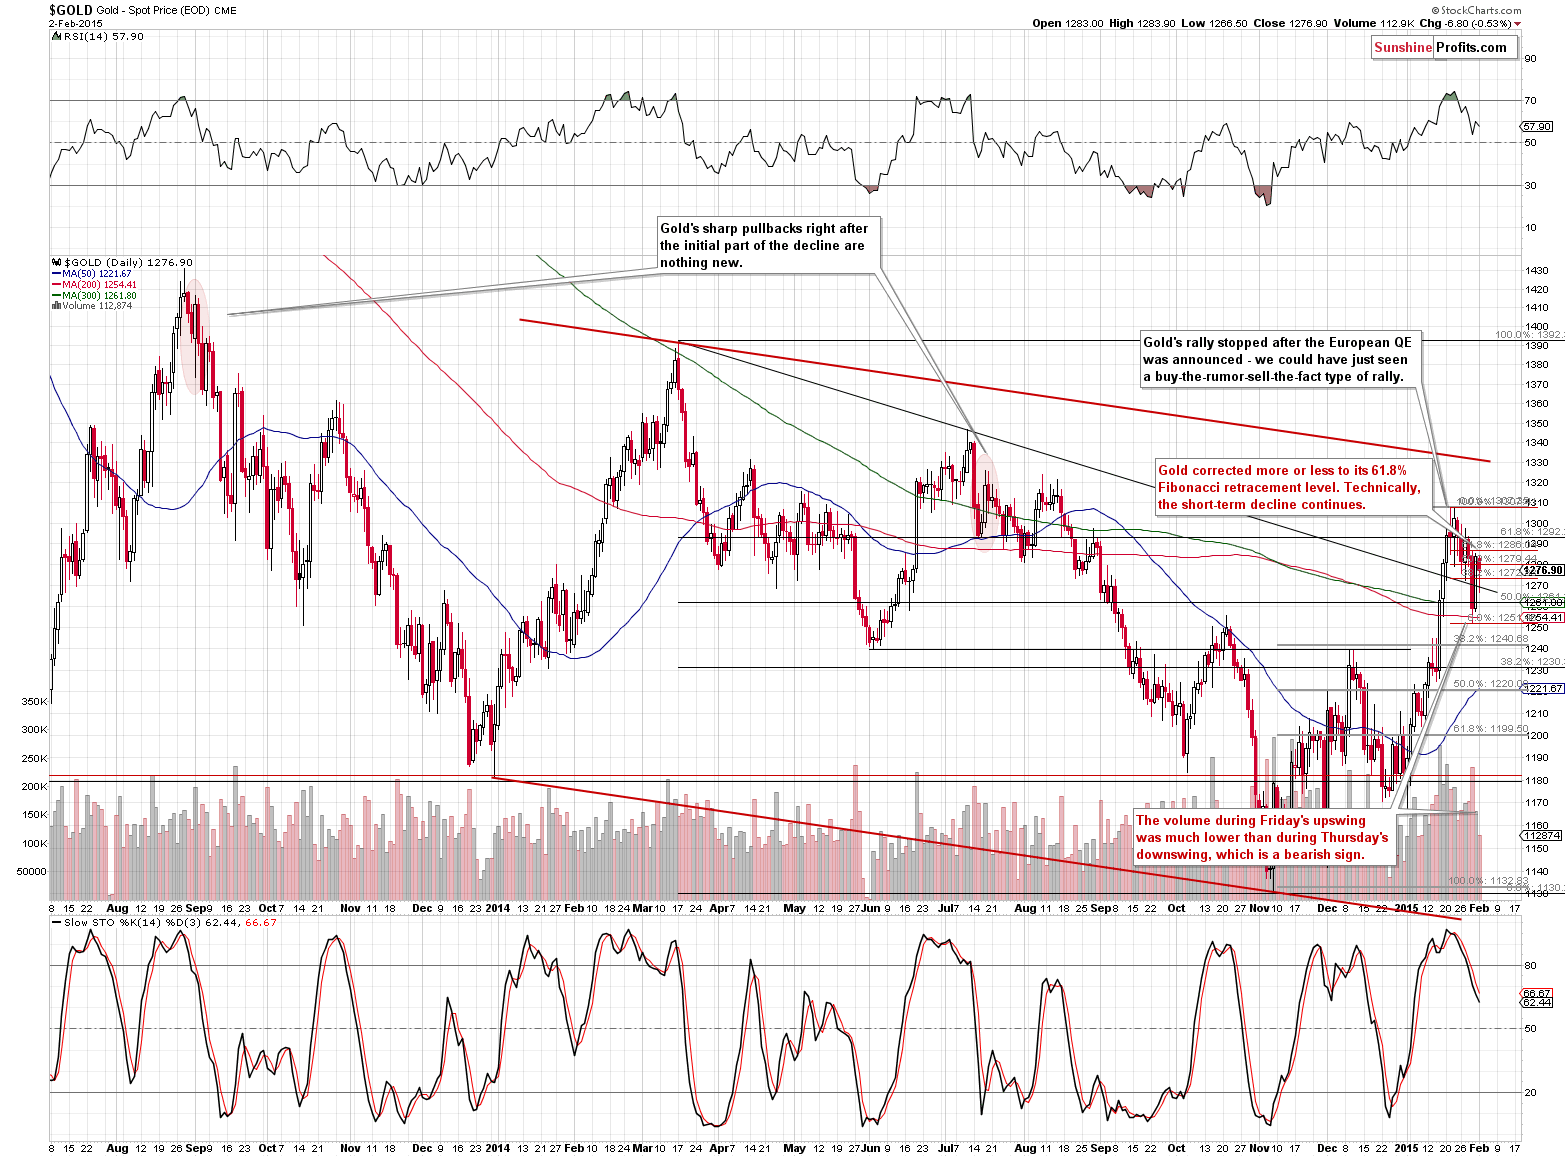
Gold is once again trying to break above the declining support line, but will it succeed? It rallied on relatively low volume on Friday, so it’s more likely that this move was just a corrective upswing, not a beginning of another rally. Gold didn’t move above the 61.8% retracement from the previous downswing, so the short-term decline remains in place also from this perspective.
Please note that it’s not uncommon for gold to correct sharply after the initial decline after an important local top. The same was the case in mid-2013 and mid-2014.
It seems that profits from the current short position were lowered only temporarily.
(…)
How low can it go? It might be best to keep the short position intact until we see bullish signs, but at this time the highest of the target prices is the first Fibonacci retracement level – close to $1,240. The $1,200 level, which is approximately the 61.8% retracement, is even more likely to stop the current decline. Still, it seems that we are not seeing a local top in the USD Index and gold keeps declining, so perhaps we will see a move even below the 2014 lows. We will be monitoring the market for signs of strength and report to you accordingly.
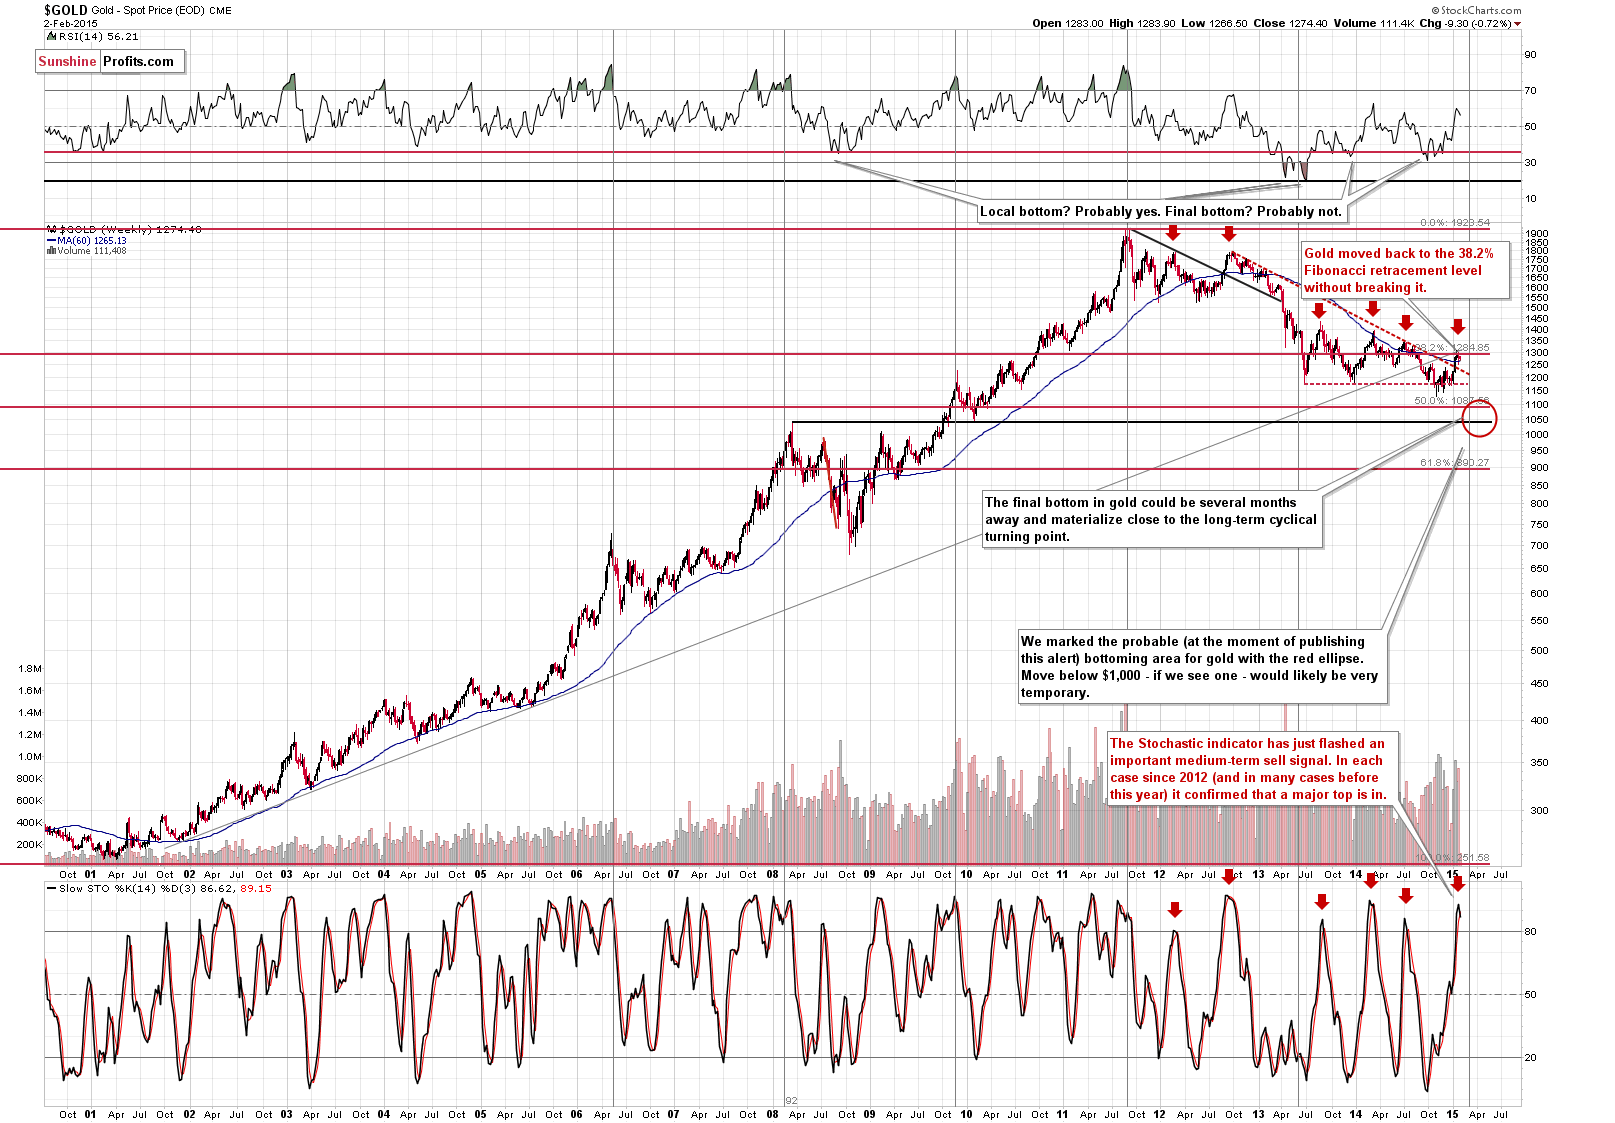
The Stochastic indicator just flashed a sell signal. That doesn’t seem to be a big deal until you consider what has happened each time since 2012 when we saw this signal. We saw major tops. All of them, actually. So, has gold formed a top recently? As always, there are no sure bets in any market, but “this time is different” is often a quite costly phrase, especially given a high efficiency of a given technique (like in this case). The indicator is based on weekly closing prices, so the signal will be fully confirmed after Friday’s close, but gold would have to move much higher in order for the Stochastic indicator not to flash the sell signal and the resistance is very close.
Moreover, please note that the last 2 major tops were formed after gold moved a bit above the 60-week moving average. This is exactly what happened recently – gold moved above this level.
Our previous comments on the above chart remain up-to-date:
From the long-term perspective, we see that [on Friday] gold moved back to the 38.2% retracement based on the entire 2001-2011 rally but didn’t close above it. Consequently, there are no changes in the above picture (…).
Let’s keep in mind that gold is quite likely to decline based on the long-term cyclical turning point. It seems probable that the next major bottom will be formed within the next several months – please see how effective these turning points were in the past cases.
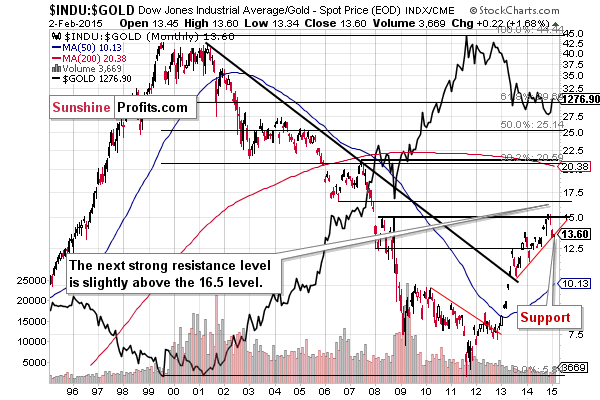
Meanwhile, the Dow to gold ratio moved to the rising support line once again, without breaking it. It seems that we are at a local bottom in the ratio and a local top in gold, or close to them.
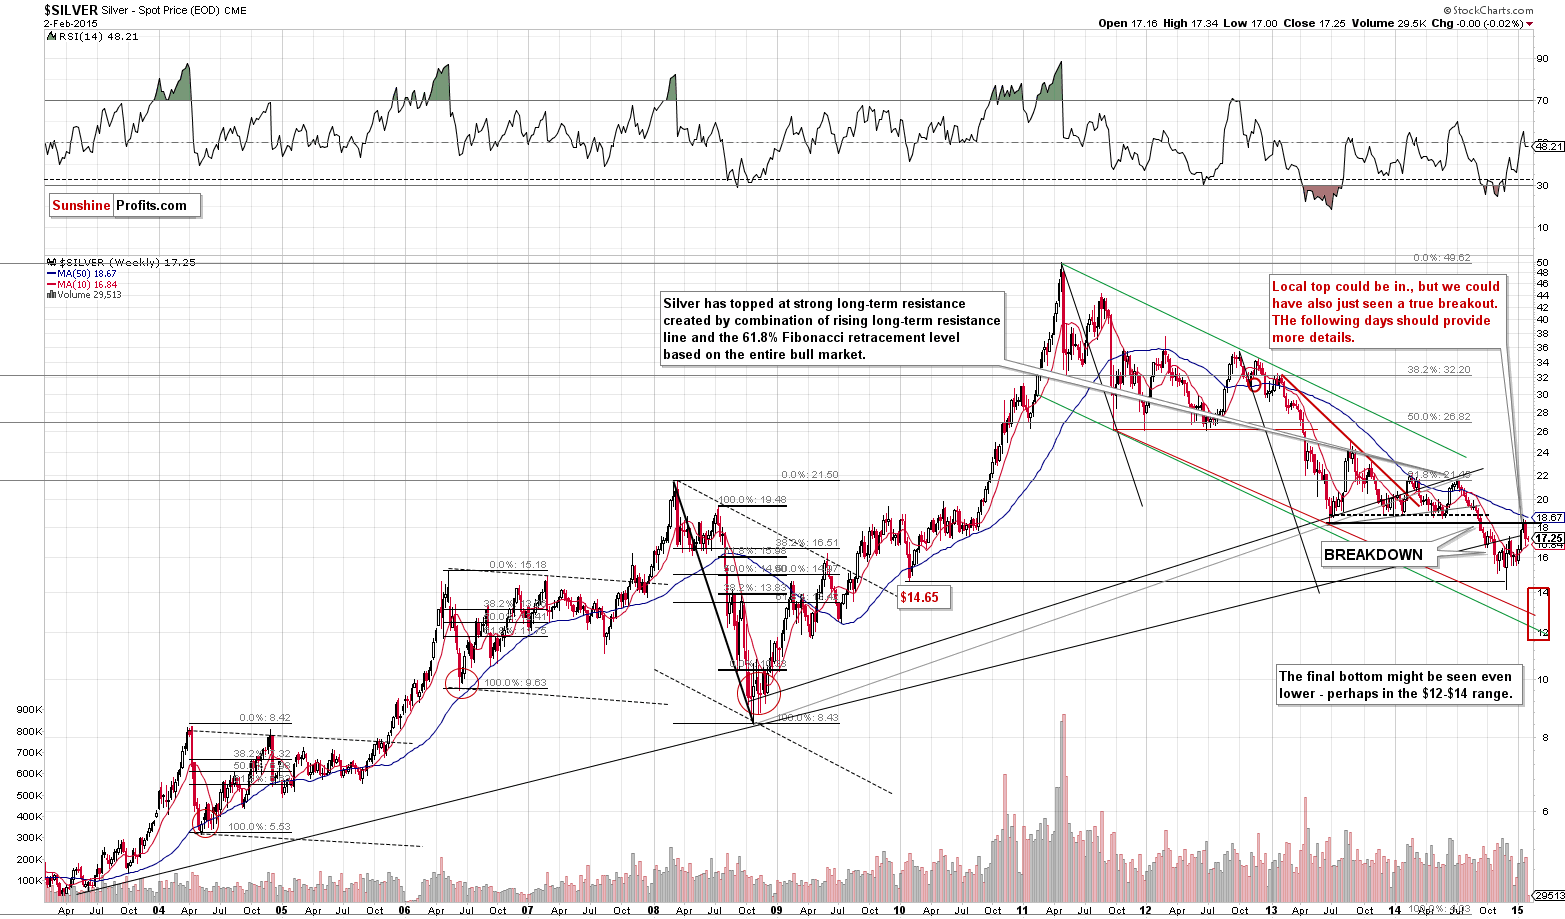
The situation in the silver market didn’t change and the outlook remains bearish. The white metal moved back below the rising long-term resistance/support line last week, thus invalidating the previous move above it.
Generally, from the short-term perspective we saw a repeat of what we had seen on Friday. Consequently, our yesterday’s comments are up-to-date also today:
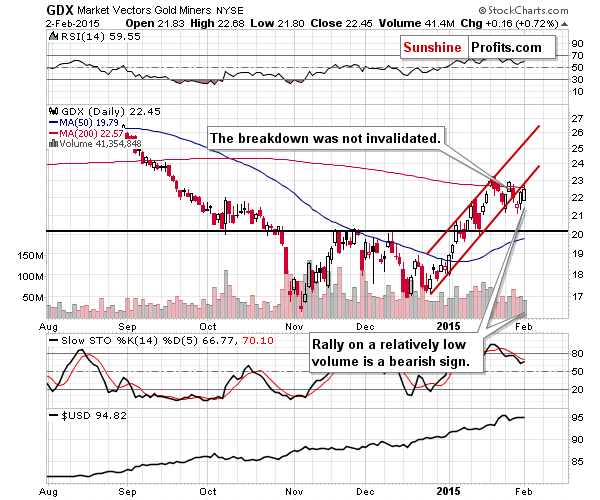
Mining stocks moved higher, but the volume was not huge, it doesn’t serve as a confirmation of the rally and – most importantly – the breakdown below the rising support line was not invalidated. Consequently, the bearish signal that we got when the breakout materialized remains in place.
Mining stocks moved higher along with a small decline in gold, but we don’t view this as a strong bullish signal, because of the overall small size of the rally and insignificant volume.
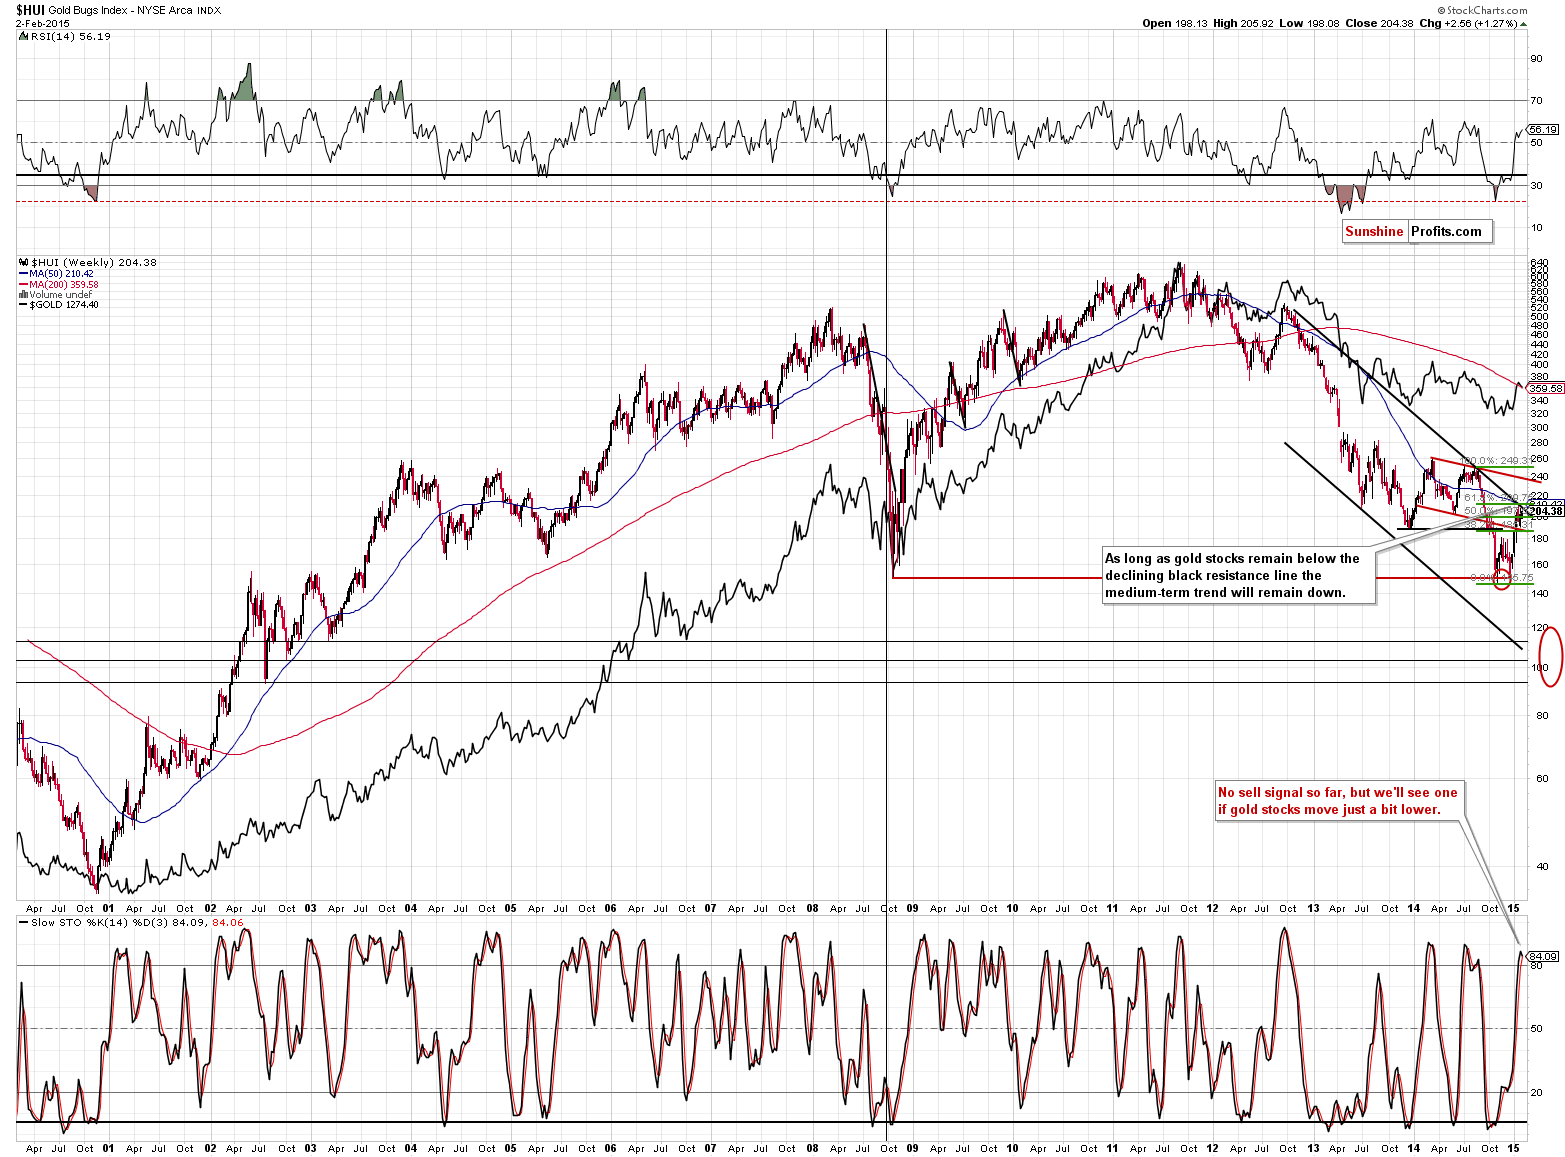
There are no changes from the long-term point of view – the medium-term trend remains down as the declining resistance line remains unbroken.
Please note that the HUI Index is now practically at the declining resistance line, which means that it’s quite likely to decline from here. Before you ask – yes, it is possible that we will see a breakout but it’s not likely. A trend remains in place and has certain implications until there is clear evidence (a confirmed breakout) that it was broken. Since we see gold stocks right at the resistance and there was no breakout – the implications are bearish.
Summing up, looking at day-to-day price action might make one believe that the situation has just become more bullish for the precious metals market, but zooming out and seeing the big picture allows us to see that it has either not changed, or perhaps even become more bearish. Please note that long- or medium-term signals are more important than the short-term ones, and at this time, the former seem to suggest lower values of the precious metals and mining stocks in the coming weeks.
We will be re-evaluating these positions on a daily basis and if we think that the situation no longer justifies keeping speculative short positions or that adjustments to the long-term investment capital are necessary, we’ll let you know. As always, we’ll keep you – our subscribers – informed.
To summarize:
Trading capital (our opinion): Short positions (full) in gold, silver and mining stocks with the following stop-loss orders and initial (!) target prices:
- Gold: initial target level: $1,245; stop-loss: $1,318, initial target level for the DGLD ETN: $64.60 ; stop loss for the DGLD ETN $55.00
- Silver: initial target level: $16.13 ; stop-loss: $18.63, initial target level for the DSLV ETN: $62.07 ; stop loss for DSLV ETN $41.94
- Mining stocks (price levels for the GDX ETN): initial target level: $20.40 ; stop-loss: $24.23, initial target level for the DUST ETN: $15.55 ; stop loss for the DUST ETN $9.28
In case one wants to bet on lower junior mining stocks' prices, here are the stop-loss details and initial target prices:
- GDXJ: initial target level: $25.43 ; stop-loss: $32.17
- JDST: initial target level: $10.50 ; stop-loss: $5.19
Long-term capital (our opinion): Half positions in gold, half positions in silver, half position in platinum and half position in mining stocks.
Insurance capital (our opinion): Full position
Please note that a full position doesn’t mean using all of the capital for a given trade. You will find details on our thoughts on gold portfolio structuring in the Key Insights section on our website.
As a reminder – “initial target price” means exactly that – an “initial” one, it’s not a price level at which we suggest closing positions. If this becomes the case (like it did in the previous trade) we will refer to these levels as levels of exit orders (exactly as we’ve done previously). Stop-loss levels, however, are naturally not “initial”, but something that, in our opinion, might be entered as an order.
Since it is impossible to synchronize target prices and stop-loss levels for all the ETFs and ETNs with the main markets that we provide these levels for (gold, silver and mining stocks – the GDX ETF), the stop-loss levels and target prices for other ETNs and ETF (among other: UGLD, DGLD, USLV, DSLV, NUGT, DUST, JNUG, JDST) are provided as supplementary, and not as “final”. This means that if a stop-loss or a target level is reached for any of the “additional instruments” (DGLD for instance), but not for the “main instrument” (gold in this case), we will view positions in both gold and DGLD as still open and the stop-loss for DGLD would have to be moved lower. On the other hand, if gold moves to a stop-loss level but DGLD doesn’t, then we will view both positions (in gold and DGLD) as closed. In other words, since it’s not possible to be 100% certain that each related instrument moves to a given level when the underlying instrument does, we can’t provide levels that would be binding. The levels that we do provide are our best estimate of the levels that will correspond to the levels in the underlying assets, but it will be the underlying assets that one will need to focus on regarding the sings pointing to closing a given position or keeping it open. We might adjust the levels in the “additional instruments” without adjusting the levels in the “main instruments”, which will simply mean that we have improved our estimation of these levels, not that we changed our outlook on the markets. We are already working on a tool that would update these levels on a daily basis for the most popular ETFs, ETNs and individual mining stocks.
Our preferred ways to invest in and to trade gold along with the reasoning can be found in the how to buy gold section. Additionally, our preferred ETFs and ETNs can be found in our Gold & Silver ETF Ranking.
As always, we'll keep you - our subscribers - updated should our views on the market change. We will continue to send out Gold & Silver Trading Alerts on each trading day and we will send additional Alerts whenever appropriate.
The trading position presented above is the netted version of positions based on subjective signals (opinion) from your Editor, and the automated tools (SP Indicators and the upcoming self-similarity-based tool).
As a reminder, Gold & Silver Trading Alerts are posted before or on each trading day (we usually post them before the opening bell, but we don't promise doing that each day). If there's anything urgent, we will send you an additional small alert before posting the main one.
=====
Latest Free Trading Alerts:
S&P 500 index got close to three-month long consolidation's lower limits, as it fell below the level of 2,000. Will it break down?
Stock Trading Alert: Mixed Expectations Following Friday's Move Down
=====
Hand-picked precious-metals-related links:
Shanghai Gold Exchange Withdrawals Point to Strong Chinese Demand
Gold bears too complacent about Grexit
World top 10 gold producers – countries and miners
Randgold looking at new gold mine in Mali
=====
In other news:
US budget same 'old pantomime': Gartman
Greek plans lift European shares, euro zone debt
Turkish central bank rules out emergency rate cut
India refrains from another rate cut
Australia cuts rates to new record low of 2.25%
Why yields may take another leg down
=====
Thank you.
Sincerely,
Przemyslaw Radomski, CFA
Founder, Editor-in-chief
Gold & Silver Trading Alerts
Forex Trading Alerts
Oil Investment Updates
Oil Trading Alerts

